Nanex Research

Nanex ~ 18-Jul-2012 ~ Mistake or Master Plan?
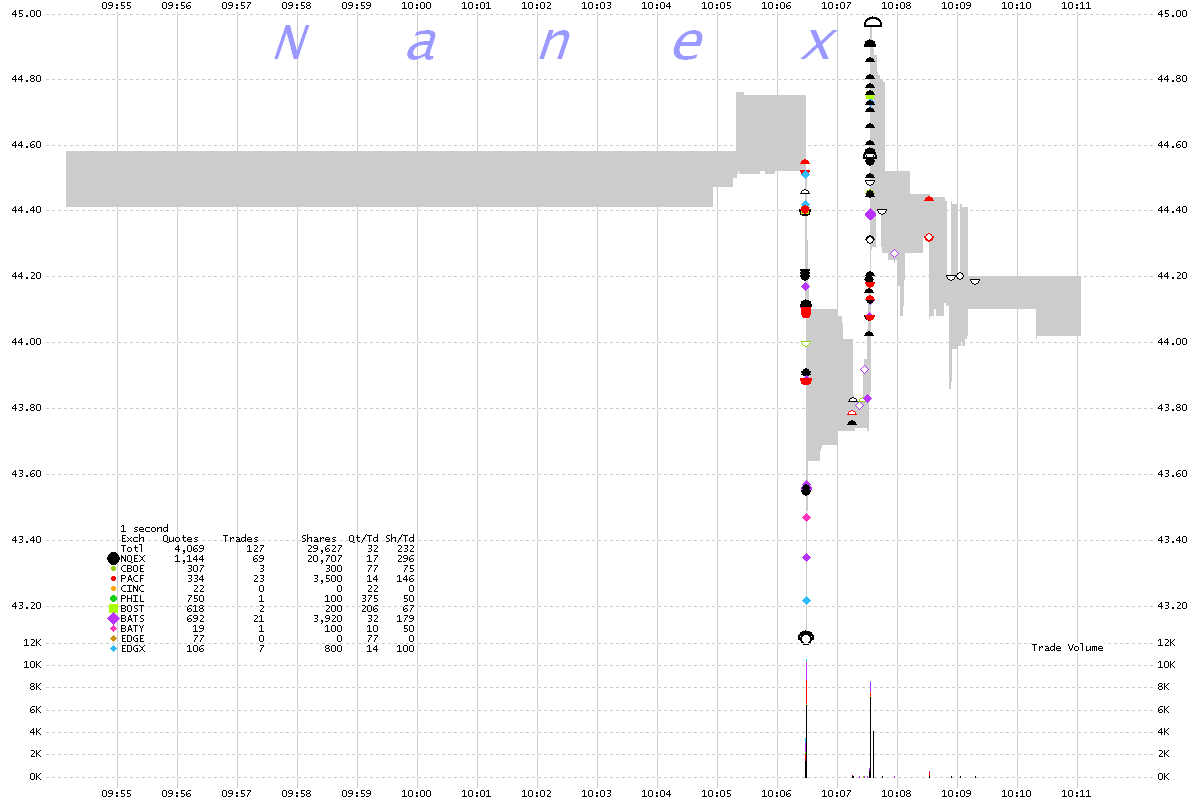
On July 18, 2012, at 10:06am in the symbol AHGP (Alliance Holdings), it looks as if
someone wanted to buy instead of sell. Perhaps they have money to lose and like buying
high and selling low.
Or maybe they wanted to cause volatility, or some other pair symbol
or basket is part of this strategy.
A total of
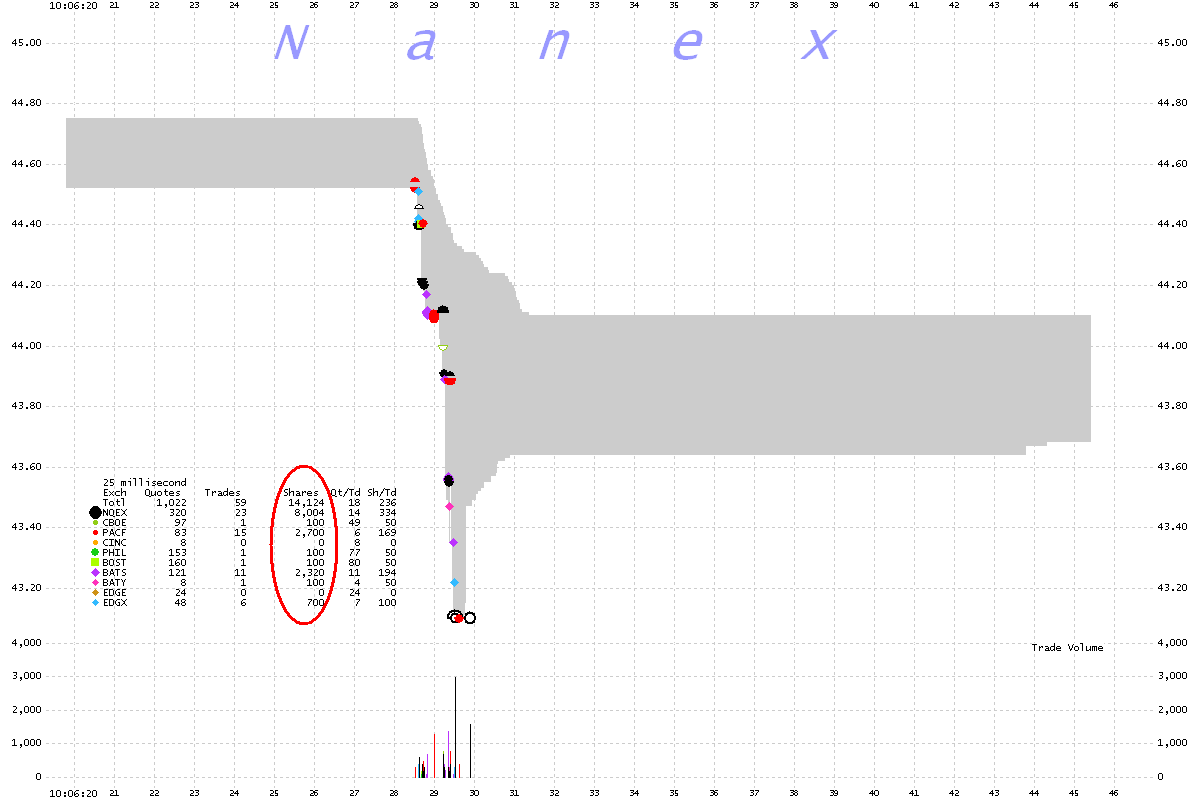
14,124 shares (59 trades) were involved in
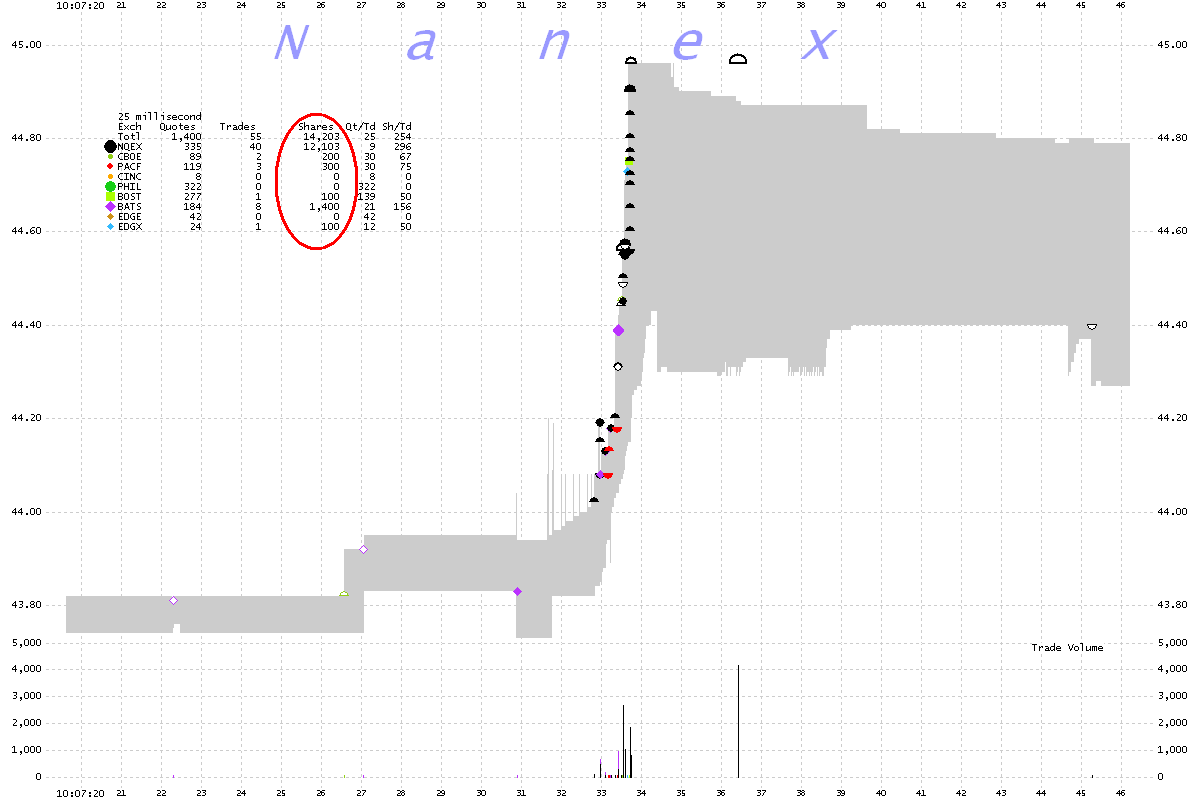
the spike down and 14,203 shares (55 trades) were involved in the recovery spike up.
Trades were reported from 8 different exchanges.
Take a look at this
detailed analysis of this event on
PremarketInfo.
AHGP 1 second interval chart showing NBBO (gray shade) along with trades (circles)
color coded by reporting exchange.
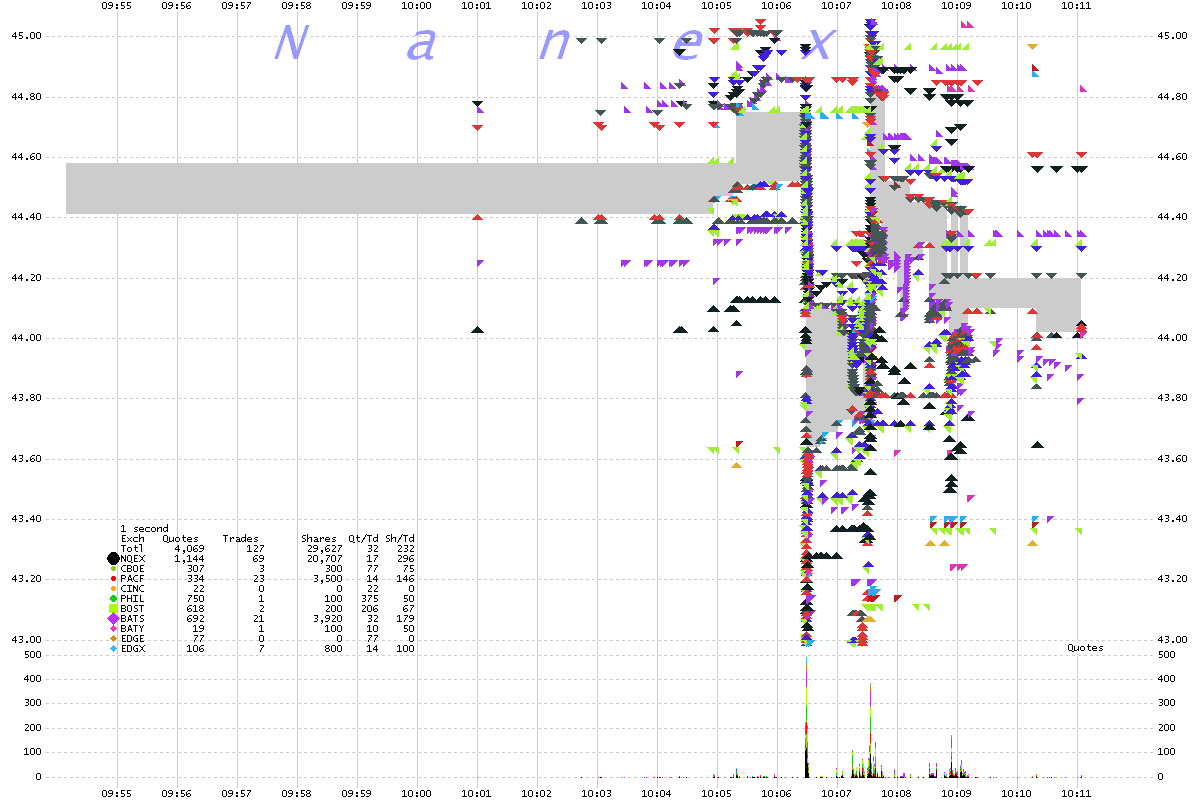
AHGP 1 second interval chart showing NBBO (gray shade) along with bids (up triangle)
and offers (down triangle) color coded by reporting exchange.
When HFT algos sense an order from a real sucker (investor), they quickly go into action.
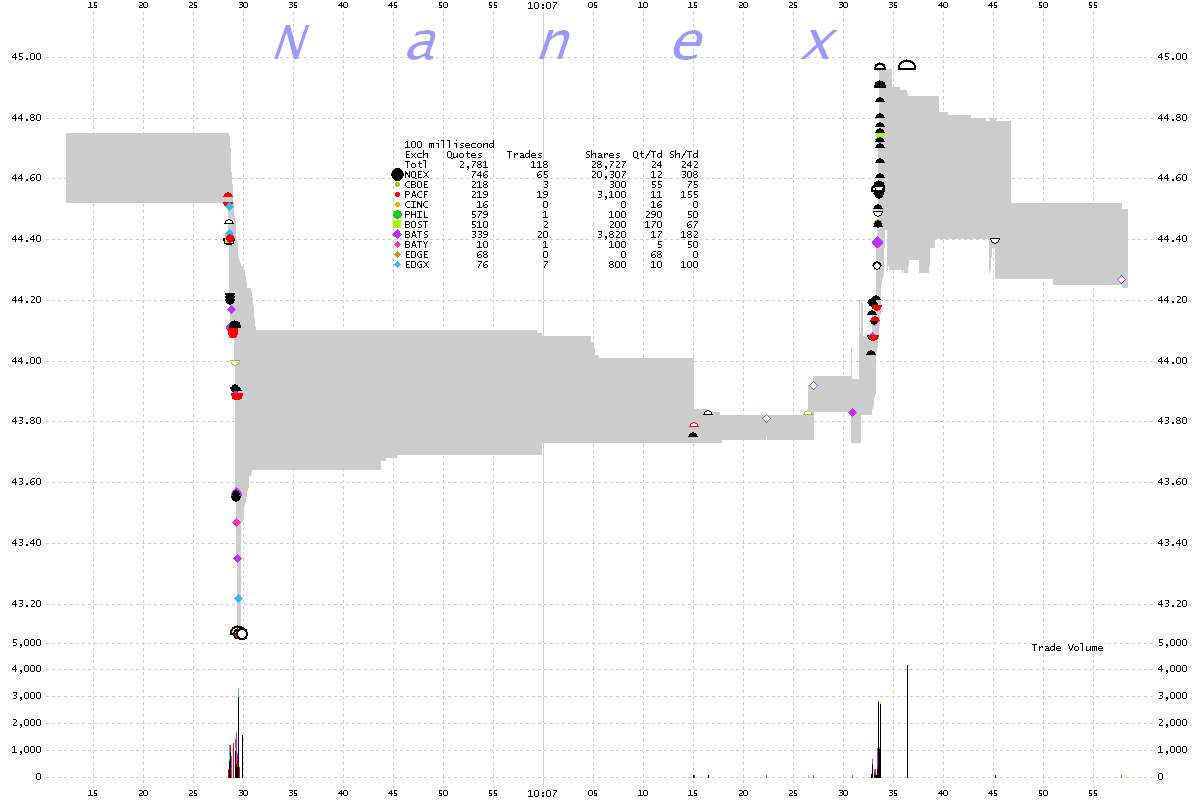
Zooming down to a 100 millisecond interval chart that shows the down spike (left)
and up spike (right).
25ms interval chart showing the spike down. Circled in red is the number of
shares executed at each reporting exchange.
25ms interval chart showing the spike up. Circled in red is the number of shares
executed at each reporting exchange.
Nanex Research


