Nanex Research

Nanex ~ 25-Jul-2012 ~ BP - New Flash Crash Poster Child?
BP is one of the world's leading international oil and gas companies, with over 80,000
employees and $375 billion in annual revenues. BP's market capitalization is $125 billion.
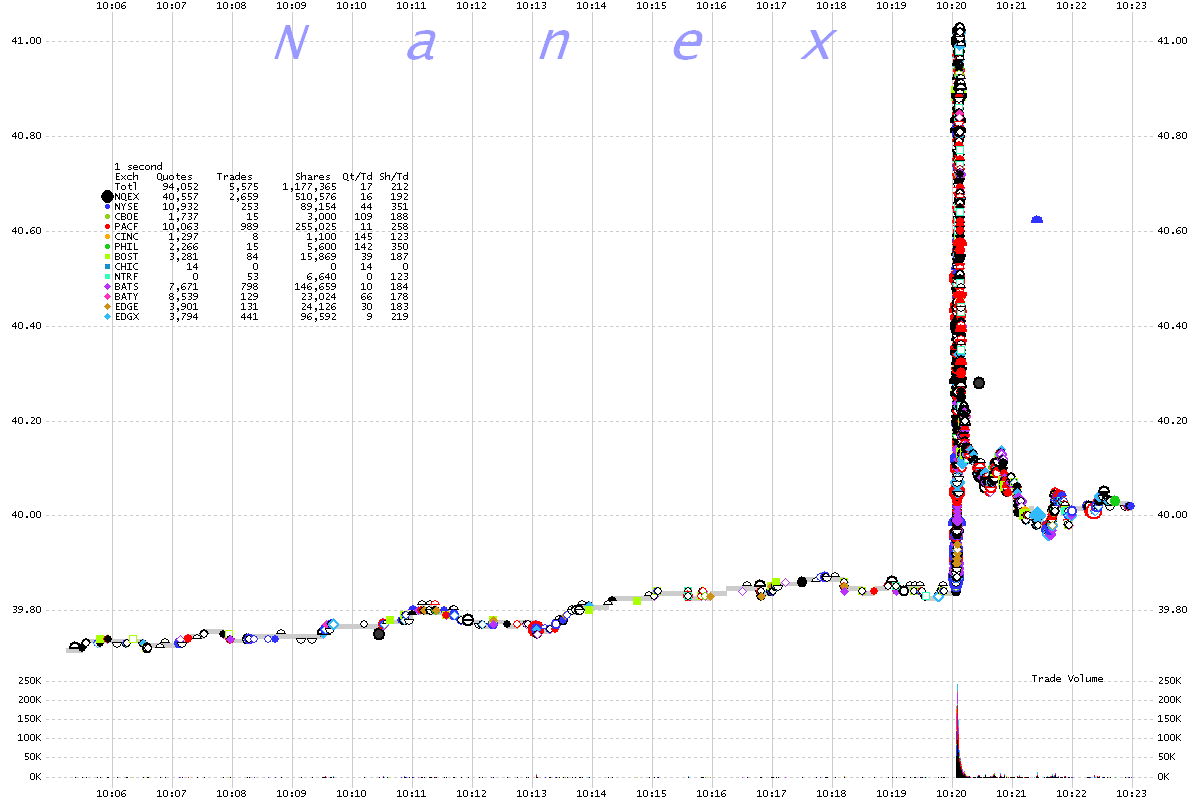
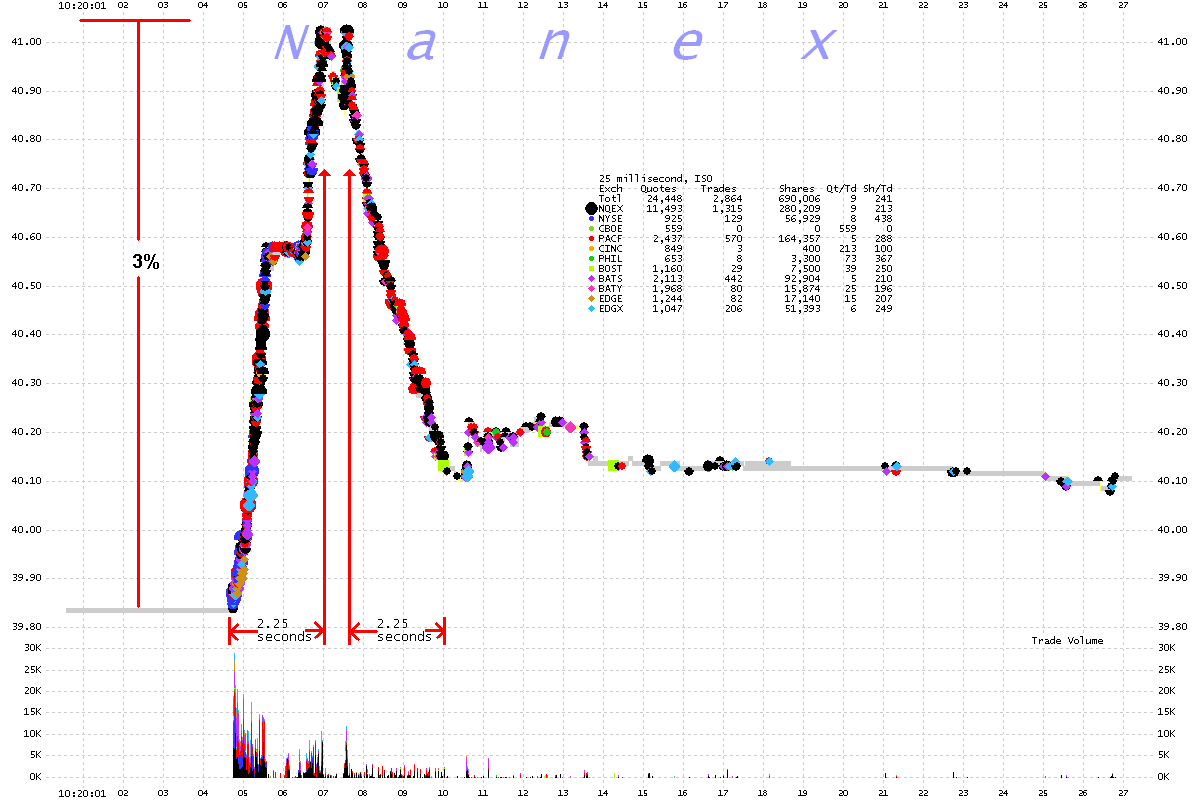
On July 25, 2012, starting at 10:20:04.750 and lasting just 2.25 seconds, the stock
of BP rocketed 3% in value. It stayed there for about a half a second, then promptly
dropped 2% over the next 2.25 seconds. Almost 600,000 shares traded during the rally
and about 200,000 shares traded during the drop that followed. Based on the high participation
of ISO orders (both up and down), this looks like a case of HFT algos spinning out of
control.
Just how out of control was this 2.25 second 3% rally? Over the last 2 years BP's trading range over the entire day (23,400 seconds) averaged 1.8%. And on 92% of those days,
BP's daily high-low range was less than what HFT achieved in 2.25 seconds.
PremarketInfo made a
video of this event.
1. BP One second interval chart showing NBBO (gray shade) along with trades (circles) color coded by reporting exchange.
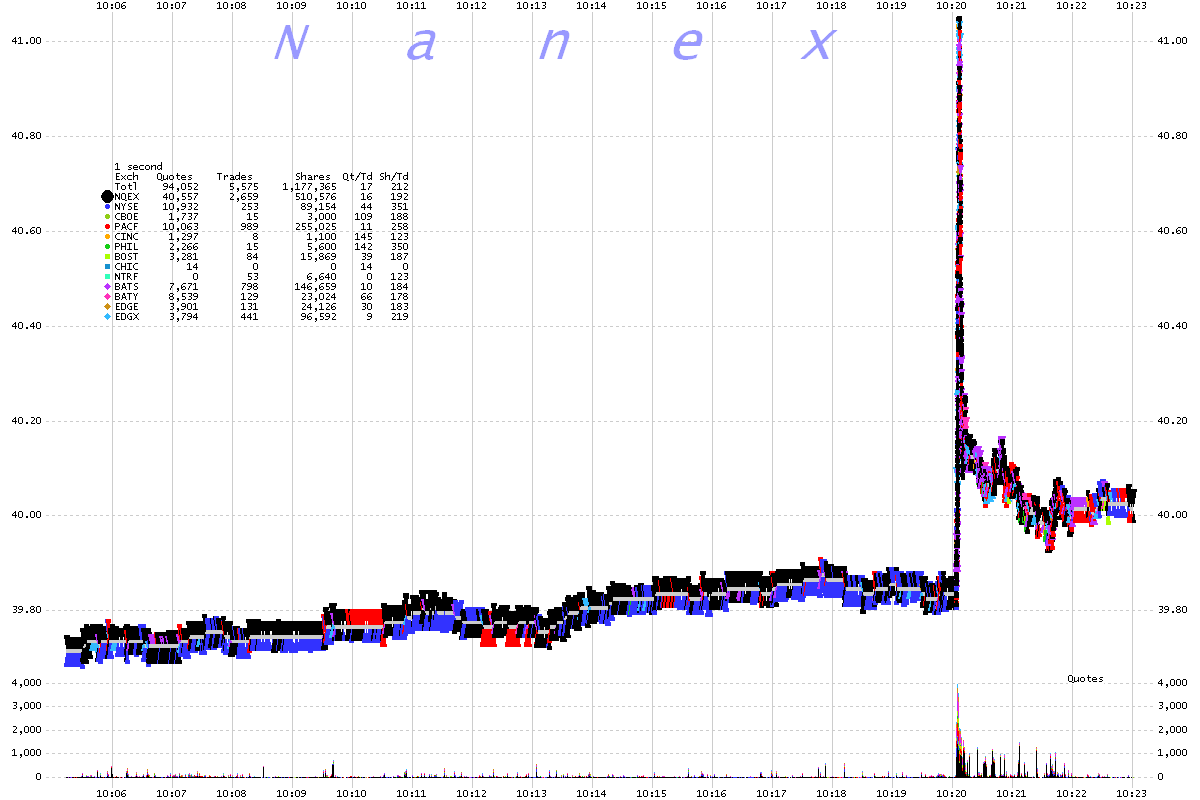
2. BP One second interval chart showing best bids and offers color coded by reporting exchange.
3. BP 25 millisecond interval chart showing trades marked ISO (used primarily
by HFT).
A stock sporting a 125 billion market capitalization rockets 3% in 2.25 seconds,
then falls nearly as much in 2.25 seconds.
4. Same chart as above, but showing all trades (ISO and non-ISO).

5. BP 25 millisecond interval chart showing best bids and offers color coded
by reporting exchange.
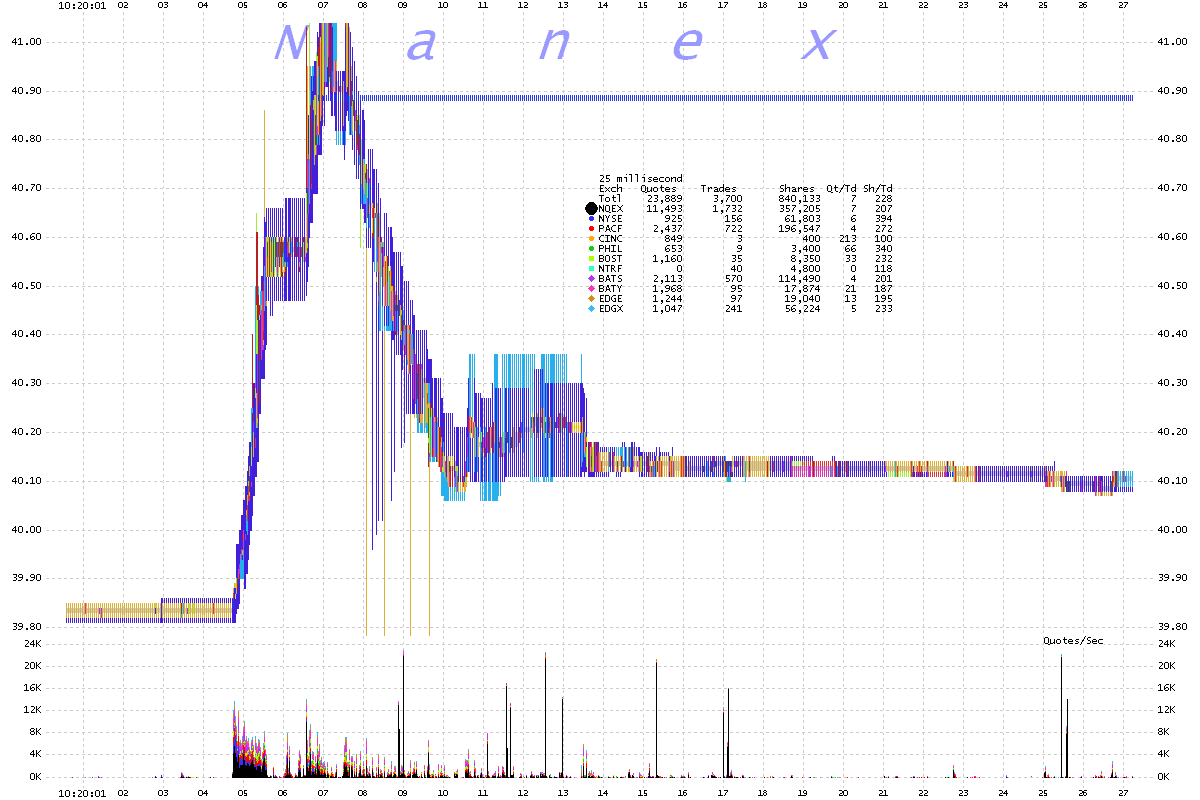
Note how tight the NBBO is all the way up and down. Also note that many different
exchanges were the best bid or offer on the way up (multi-color).

6. BP 25 millisecond interval chart showing all bids and offers color coded
by reporting exchange.
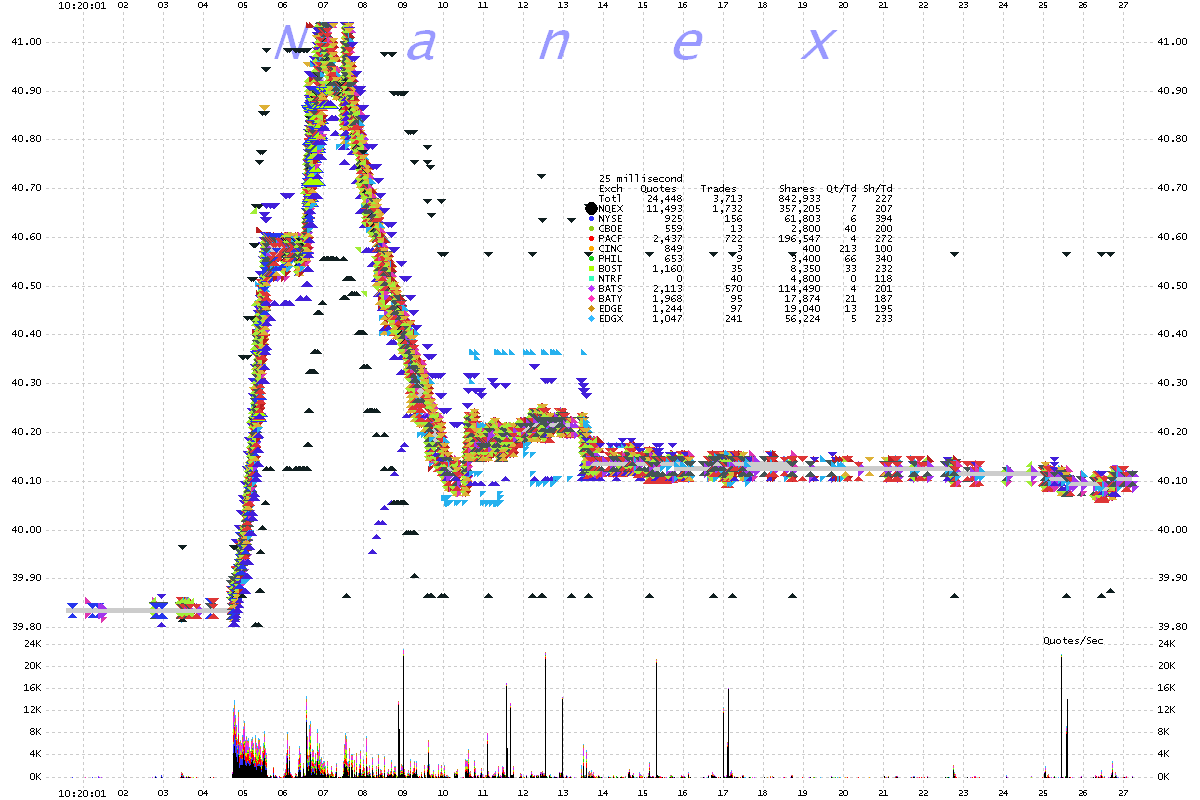
7. BP 25 millisecond interval chart showing bid-ask spreads by reporting exchange.
Note the blue horizontal shading is NYSE which hit a LRP (Liquidity Replenishment Point)
and went into slow mode.
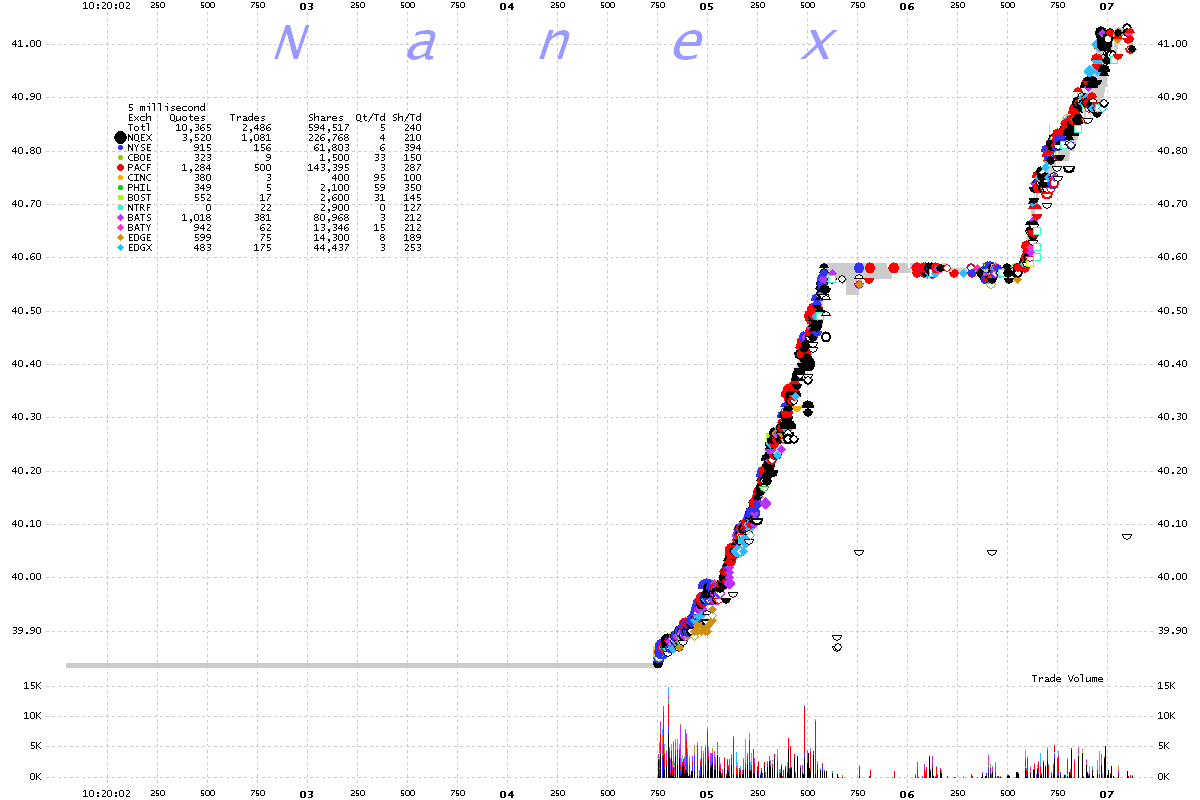
8. BP 5 millisecond interval chart. This is a zoomed in view of chart 4 showing
the rally.
There were 594,517 shares from 2,486 trades in the rally.
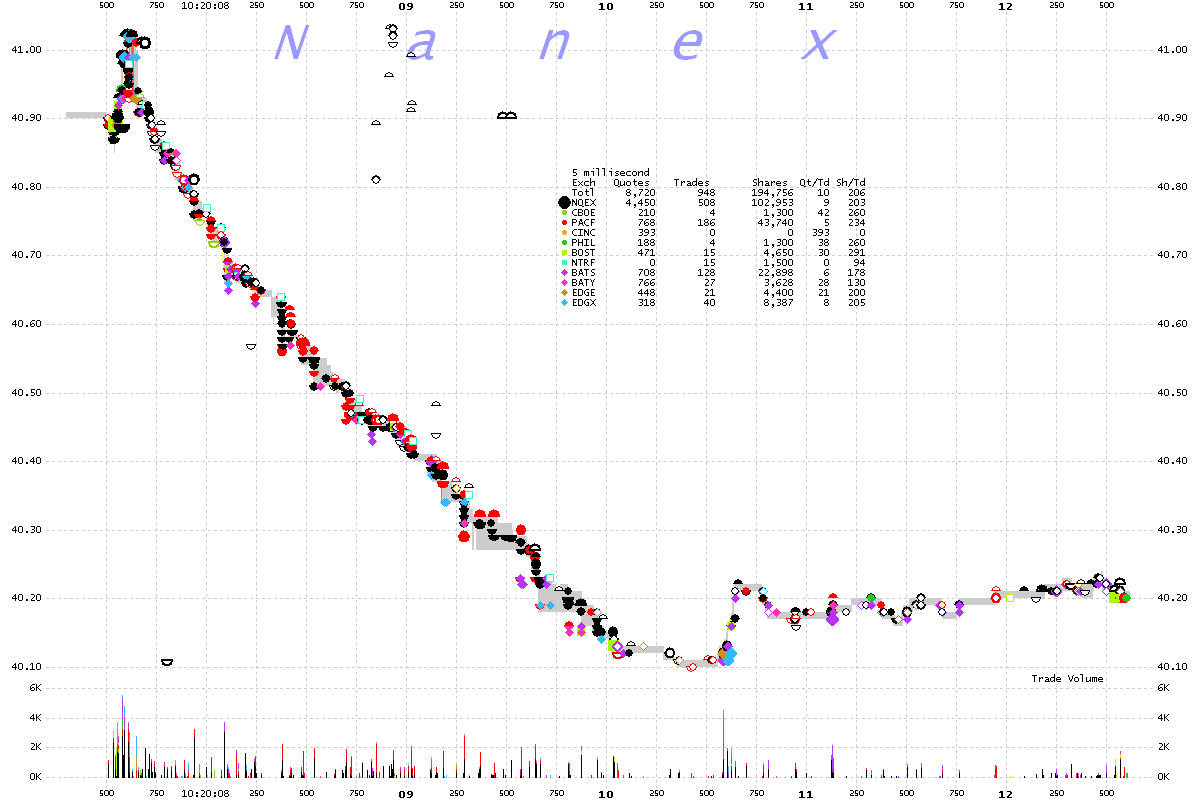
9. BP 5 millisecond interval chart. This is a zoomed in view of chart 4 showing
the drop.
There were 194,756 shares from 948 trades in the drop.
Nanex Research


