Nanex ~ 31-Jul-2012 ~ eMini Wipe-outOn July 31, 2012, starting about 15:59:57 EDT (3 seconds before the close of equity trading) our monitoring software alerted us to an unusually large trade of over 60,000 eMini (ES September 2012) contracts. At the same time, we also received a series of alert showing large and unusual trades in ETFs; the largest shown in the table below (note the last column is the value of the trade in millions of dollars): 1. One second interval chart of eMini (ES September 2012) Depth of Book on July 31, 2012 showing price and depth levels in the upper panel and contract volume traded in lower panel. |
|
2. Same chart as above but showing size map in lower panel.. |
|
At 15:50:15 we noticed a sudden and unusual drop in the number
of contracts in the eMini depth of book, signalling a loss of liquidity. A drop in liquidity
during the last 15 minutes of equity trading (15:45 to 16:00) is very unusual.
3. One second interval chart of eMini (ES September 2012) Depth of Book on July 31, 2012 showing price and depth levels in upper panel and size map in lower panel. |
|
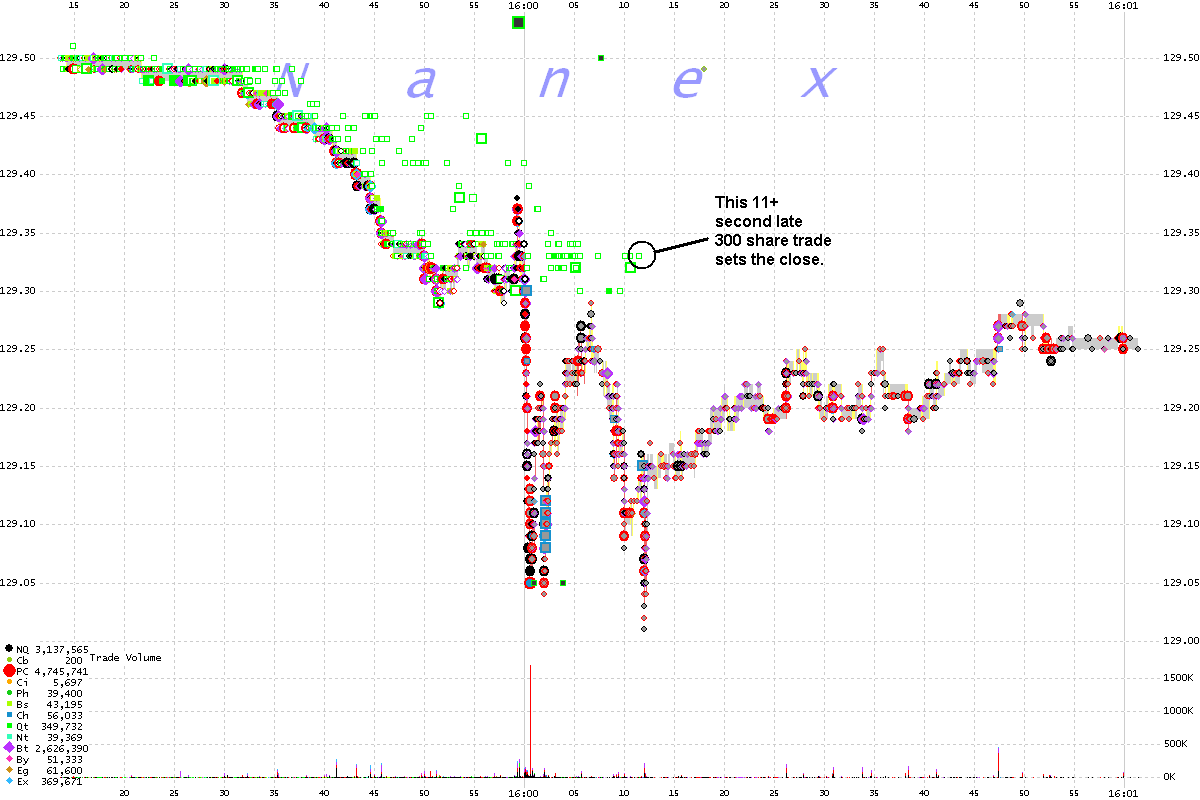
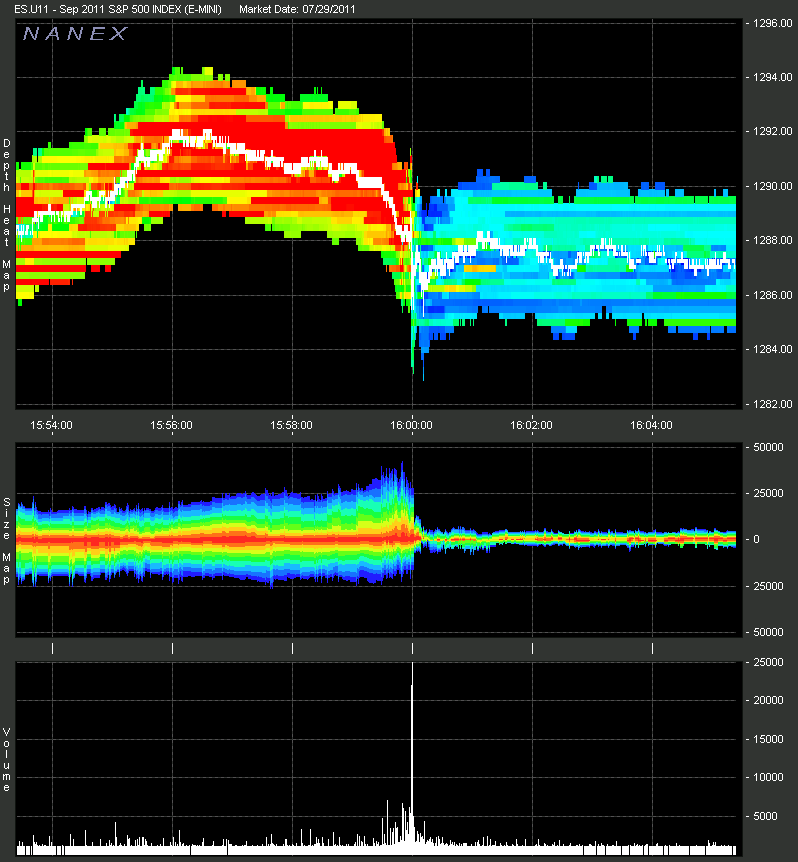
On July 29, 2011, also the last trading day of July, we noticed a eerily similar event and published
a paper on it.
4. SPY on July 29, 2011 from 15:59:15 to 16:01:00 showing trade executions color coded by reporting exchange. |
|
5. One second interval chart of eMini (ES September 2011) Depth of Book on July 29, 2011. Upper panel shows price and depth levels, lower level shows contract volume traded. |
|