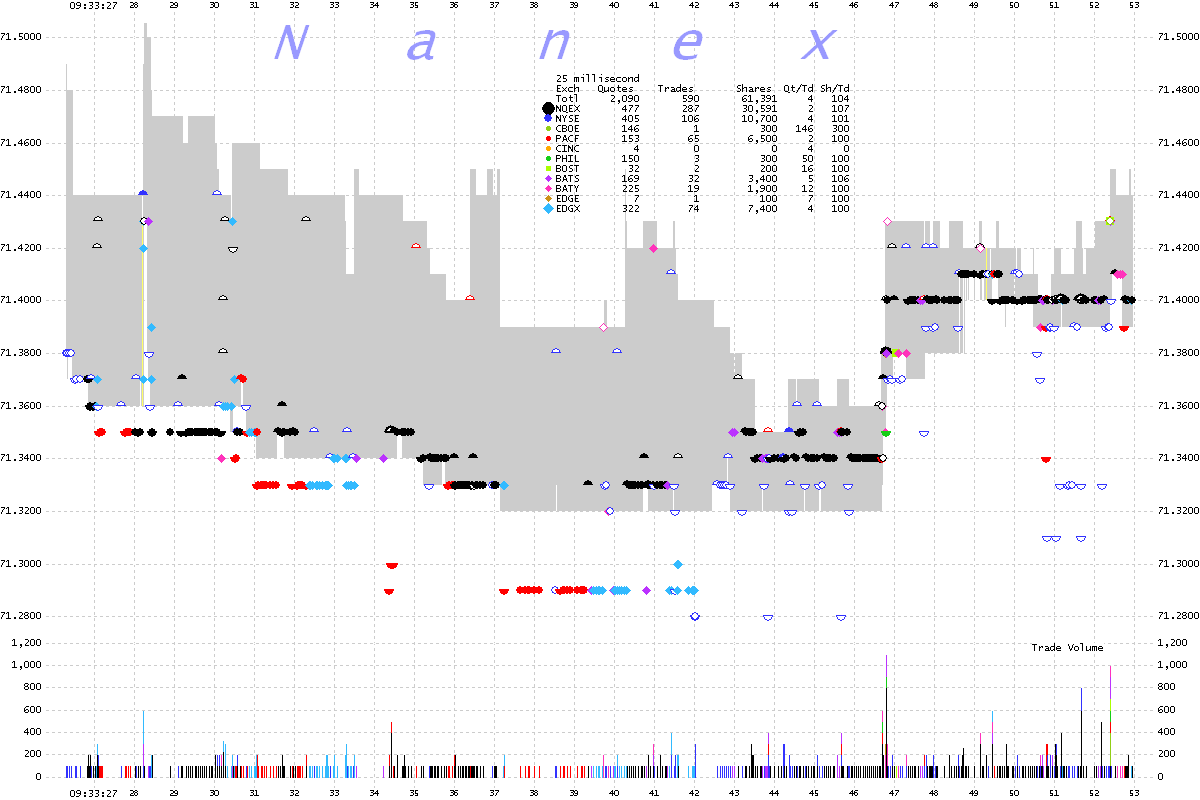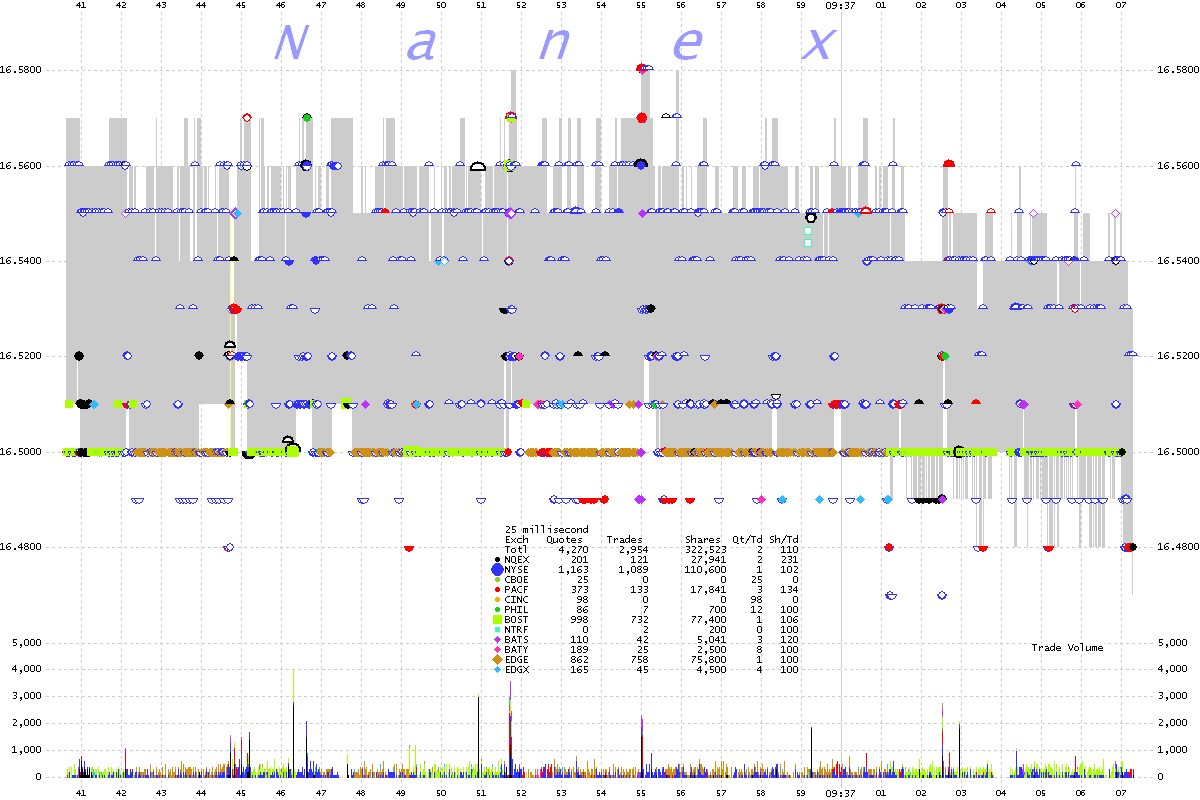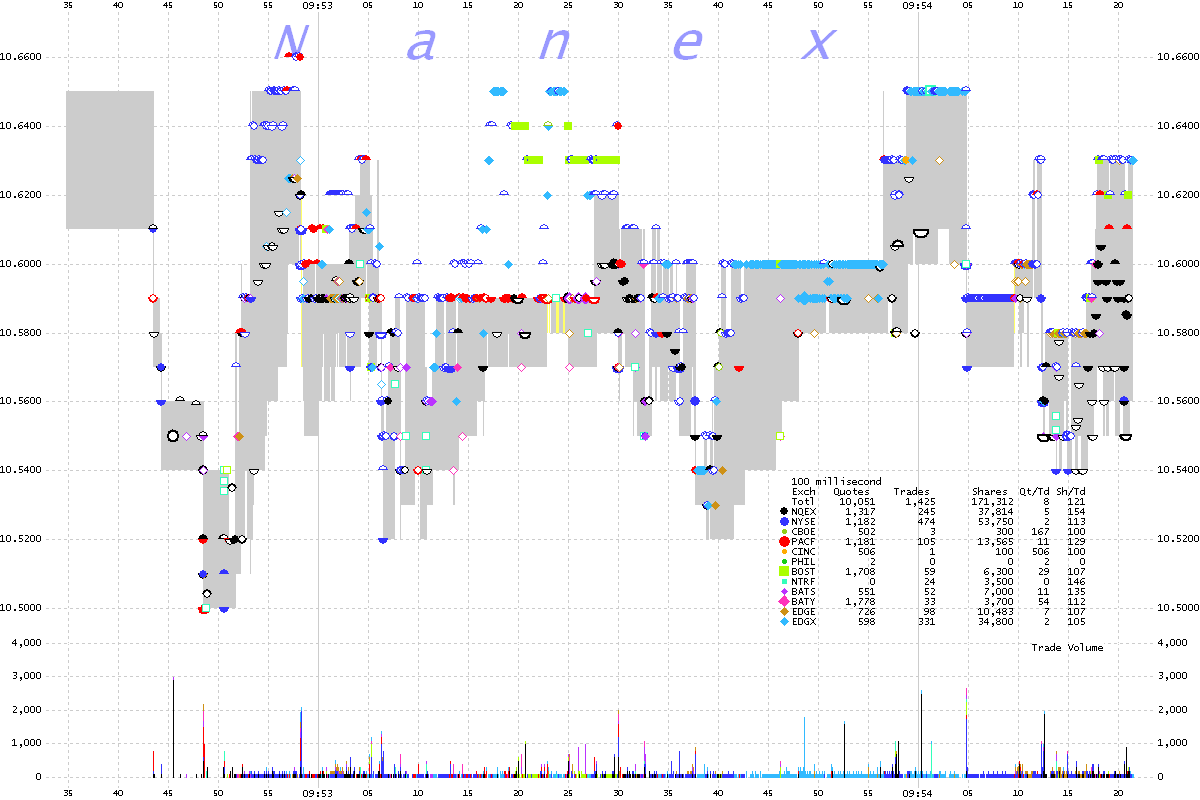
| Images of the fallout from the Knight debacle
on August 1, 2012. See also our
explanation of what likely happened. The following 375 charts of 40 different stocks show examples of trade executions that occurred outside the National Best Bid/Ask spread (NBBO). Trades executing outside the NBBO rarely happen unless the trade-through protection provision afforded by Reg NMS is being ignored. All charts show the NBBO as a gray band: the bottom edge of this band is the Best Bid, and the top edge of the band is the Best Ask. Trades are shape and color coded by reporting exchange. Filled in shapes denote ISO trades (Intermarket Sweep Orders), which usually indicate HFT activity. Look for trades occurring outside of the NBBO (not within the gray band). Also note how some trades from some exchanges appear to consistently execute near the top, bottom or middle of the gray band for periods of time. We took quotes that changed the NBBO in EXC from 9:47 to 9:49 and mapped them to piano sound samples resulting in this audio file: |


