09-Aug-2012 ~ Friends without Benefits
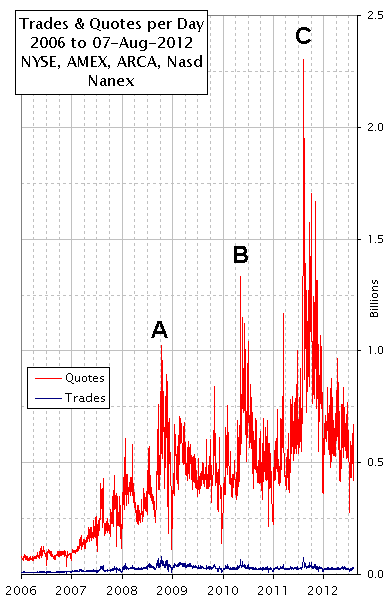
The chart on the right plots daily trade and quote counts from January 2006 through August 7, 2012. The red line shows the number of quotes
|
each trading
day for U.S. Stocks. The blue line snaking across the bottom of the chart shows the
number of trade executions. Note the scale is in billions. During the end of the Internet bull market in 2000 (not
shown), the number of quotes in a day was about 5 million, less than the height of 1 pixel
on our chart. After Reg NMS, a form of High Frequency Trading (HFT) appeared that took advantage of time latency arbitrage caused by differential system loads (an imbalance of quotes on one network versus another). It wasn't long before one of these HFT figured out how to induce latency arbitrage and the divergence between quote and trade traffic began. There are three peaks labeled A, B, and C that brought out the worst in HFT: After the system-overloading quote volumes during August 2011, Nanex, Themis Trading, and others who were concerned about the long term health of our markets, became vocal about the enormous costs being heaped on those who do not benefit from HFT, yet have to pay for the infrastructure they require. In fact, during peak times, quote spreads are often wide and unstable. We are paying for the costs, but reaping none of the benefits.Whenever a new peak in message traffic occurs, those who process market data must upgrade systems to be able to handle the new capacity plus additional overhead for higher traffic on high volume days. In other words, peak message rates set new, permanent capacity requirements. You can't just flip a switch and get additional capacity when you need it, then turn it off to reduce costs when you don't. |
 |
We've written about this topic a number of times using different measurements. Here are a few good links:
- HFT: A Clear and Present Danger
- High Frequency Quote Spam
- Exhibit A (response to NYSE claiming no harm from HFT)
- HFT is Insatiable. It's Hidden Costs
- CQS Delays (footprints of latency arbitrage)
- Feed Saturation Ratio stands out in Flash Crash.
- See data for Berkshire Hathaway over the same period.
