10-Aug-2012 ~ HFT Discovers Berkshire Hathaway
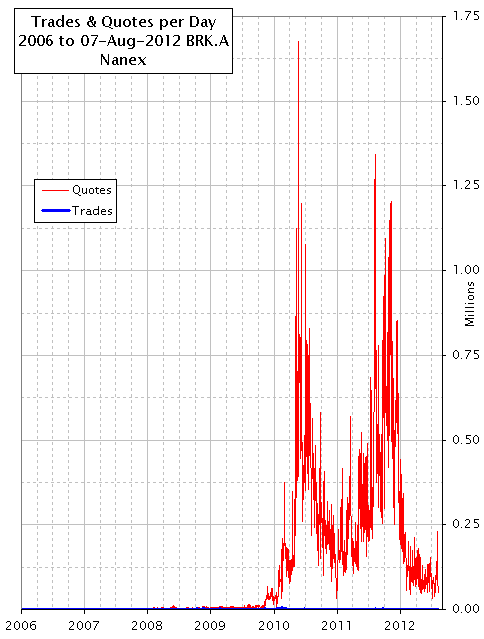
The chart on the left plots daily trade and quote counts from January 2006 through August 7, 2012 for each trading day for the stock Berkshire Hathaway (symbol BRK.A) The red line shows the number of quotes and the barely visible blue line shows the number of trade executions. Note the scale is in millions. For a chart showing all stocks, click here.
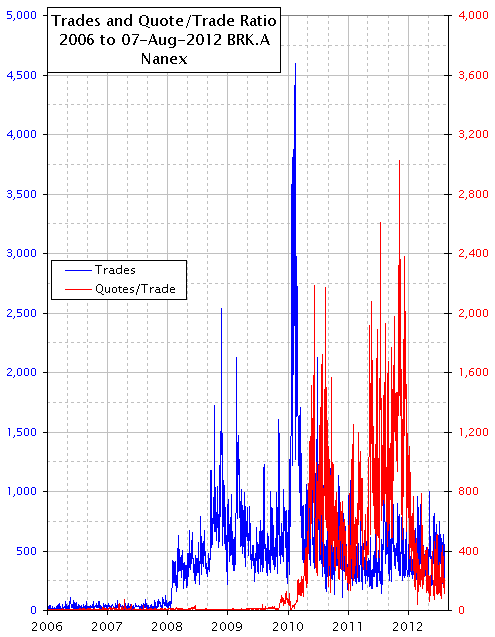
The chart on the right plots trades (blue) and the quote to trade ratio (red). Note how often quote to trade ratio averaged over the entire day exceeded 1,000. The highest was 3022 quotes for every trade, and the average over 6 years is 256 quotes per trade.
That sure is a lot of price discovery going on.
 |
 |
