Nanex ~ 16-Aug-2012 ~ UNG and DGAZ - Zero to Crazy in Seconds
On 16-Aug-2012, just before the 10:30 EIA Natural Gas Report, Natural Gas Futures and ETFs became violently volatile. Charts f UNG and DGAZ below. There is also an animation of the Natural Gas Futures depth of book.
Chart 1. UNG 1 second interval showing bids and offers color coded by exchange.
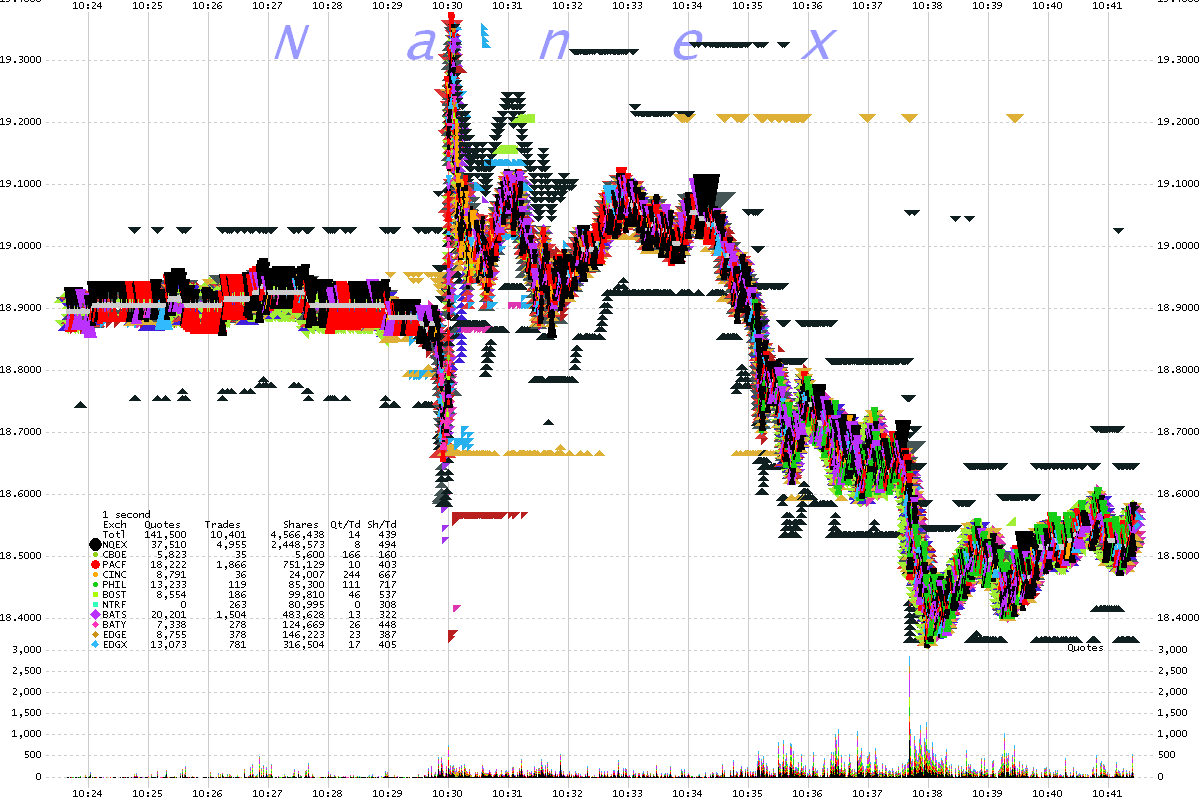
Chart 2. UNG 1 second interval showing trades color coded by exchange.
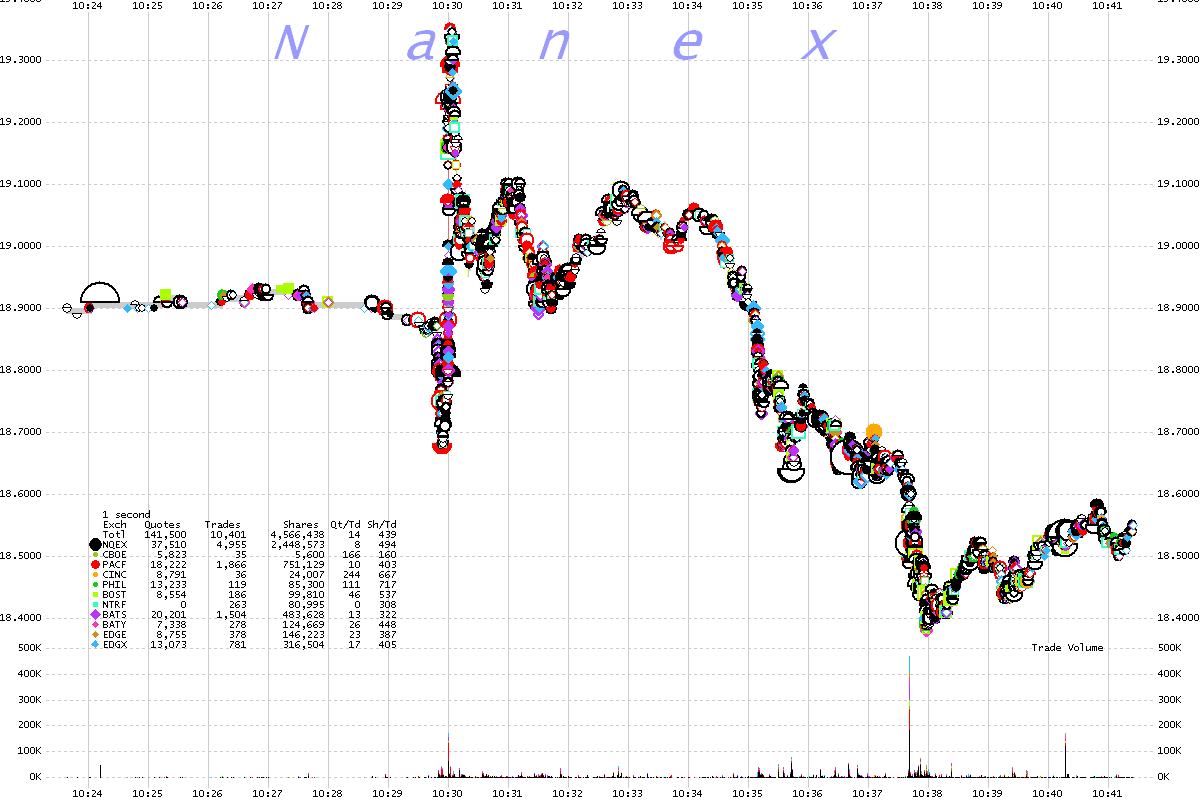
Chart 3. UNG 25 millisecond interval showing bids and offers color coded by exchange.
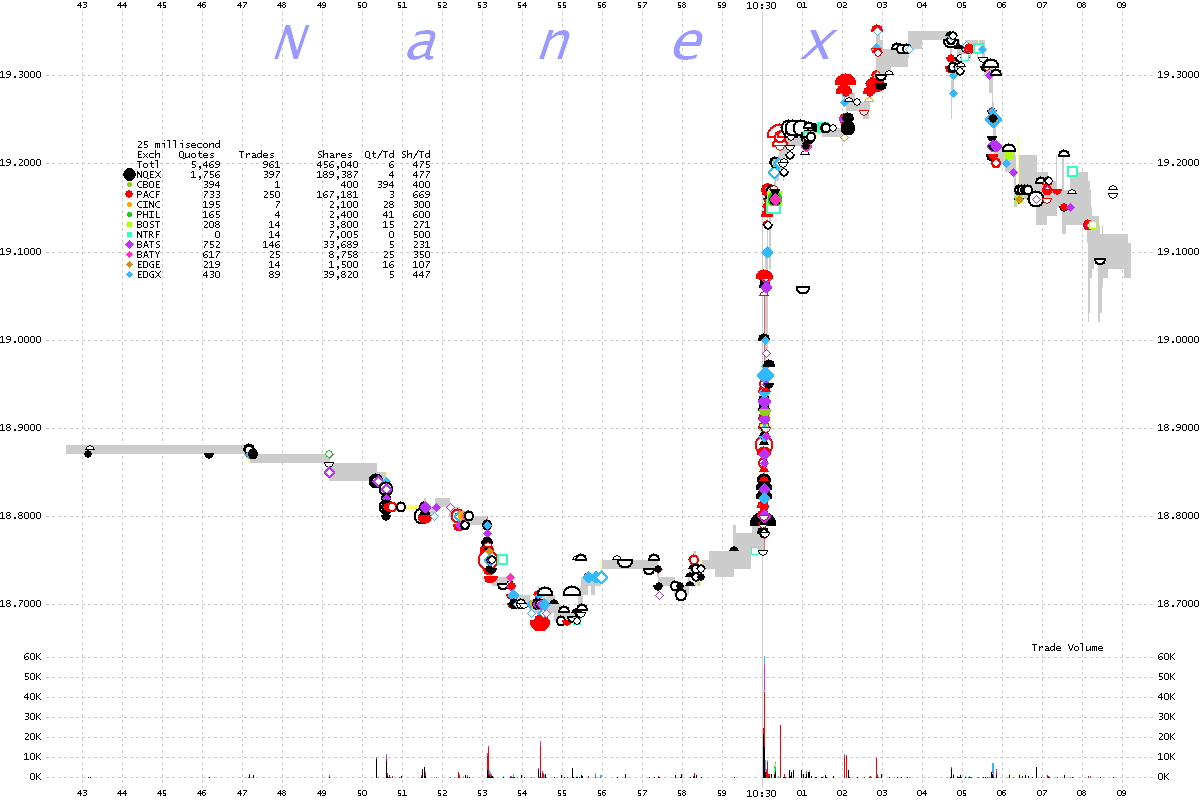
Chart 4. UNG 1 millisecond interval showing trades color coded by exchange. Chart shows 1 second of data.
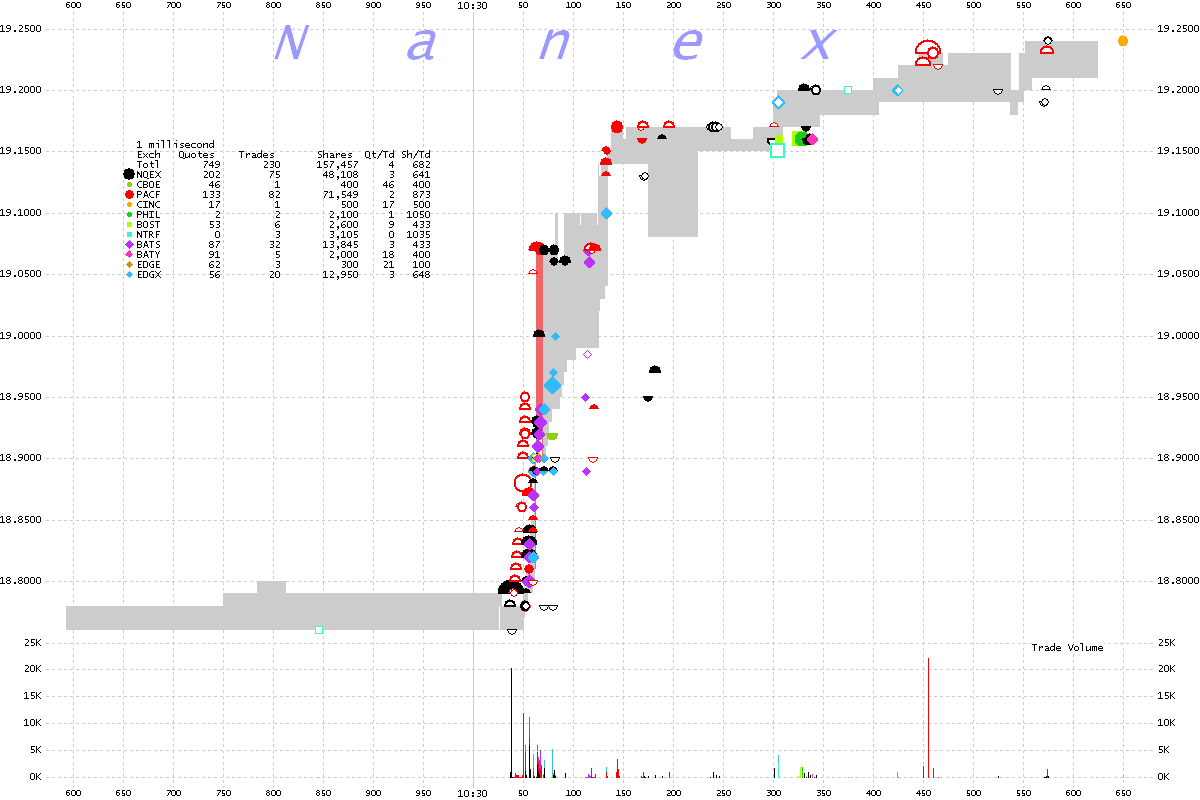
Chart 5. DGAZ 1 second interval showing bids and offers color coded by exchange.
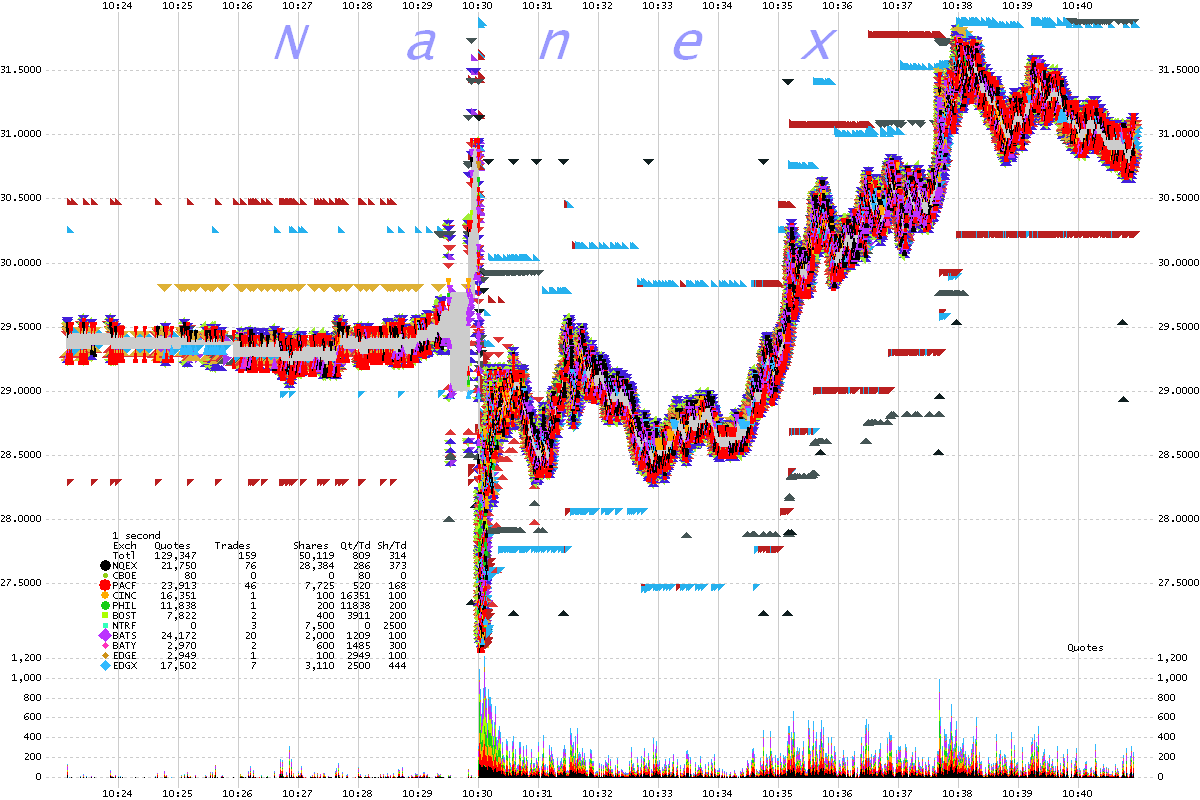
Chart 6. DGAZ 25 millisecond interval showing best bids and offers color coded by exchange.
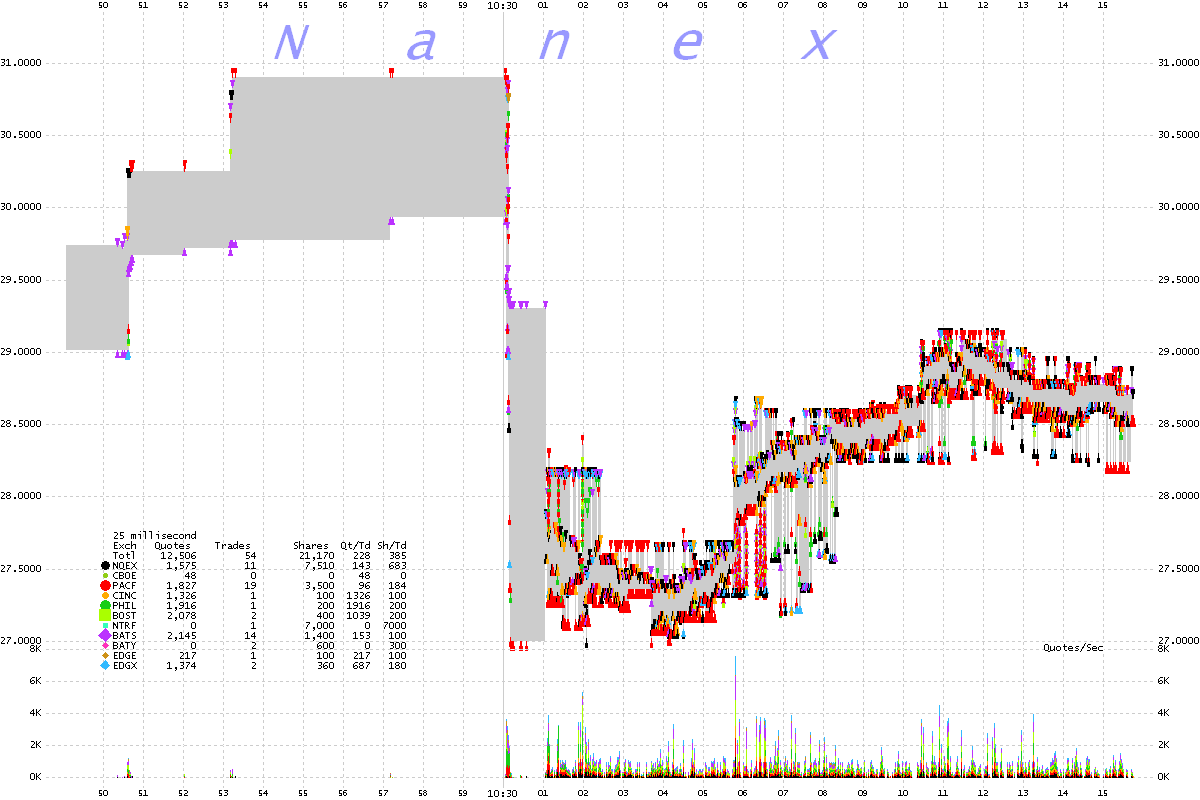
Chart 7. DGAZ 25 millisecond interval showing trades color coded by exchange.
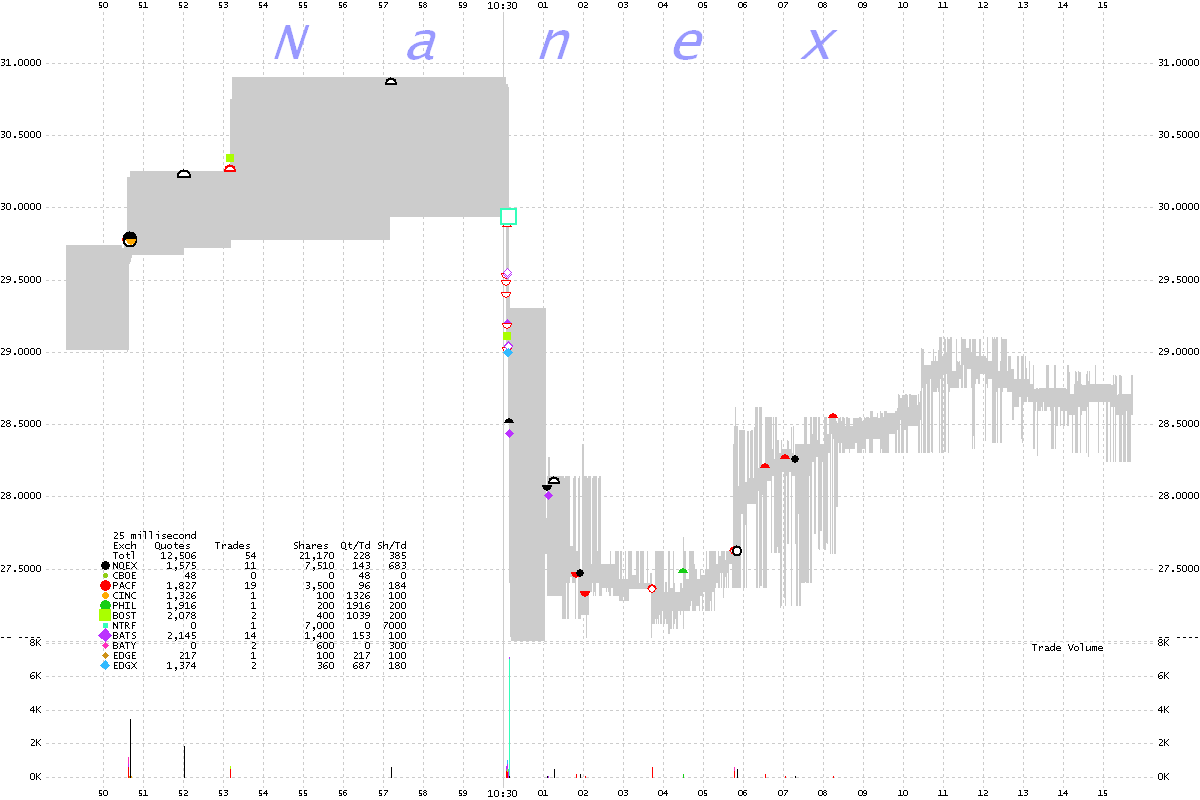
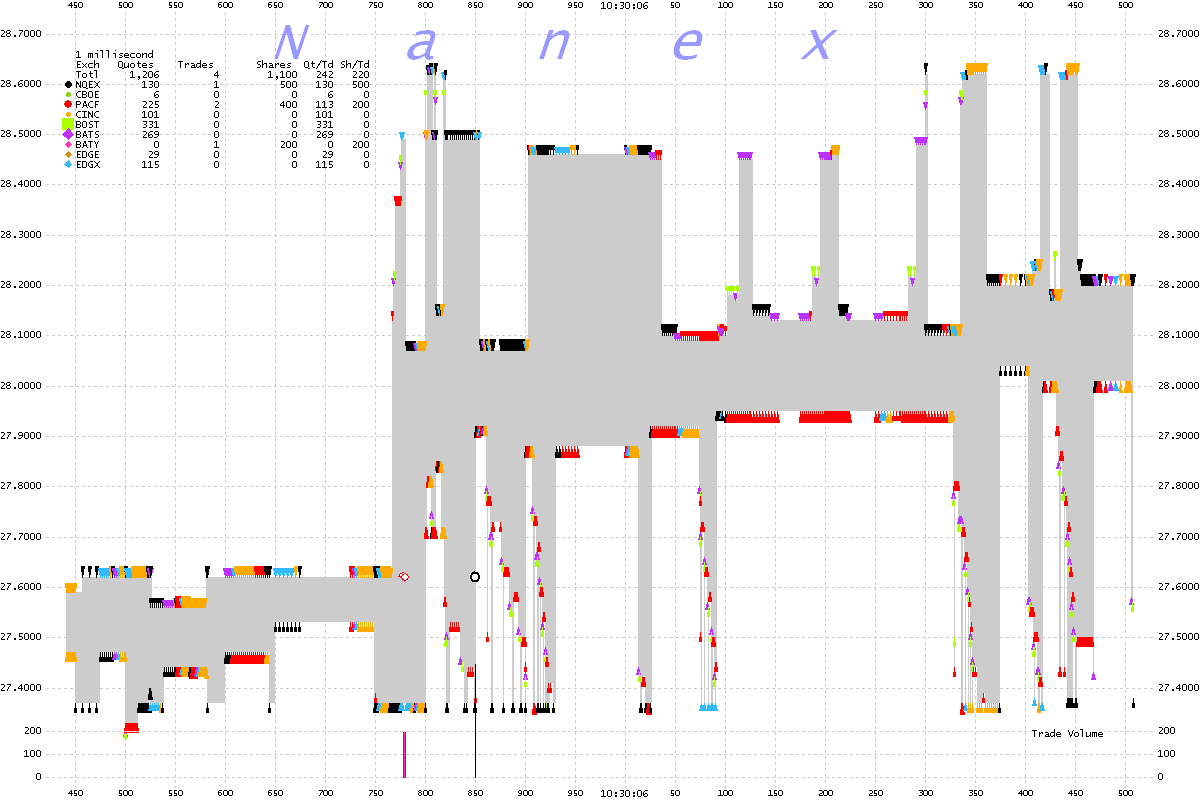
Chart 8. DGAZ 1 millisecond interval showing trades and best bids and offers color coded by exchange. Chart shows 1 second of data.
Nanex Research
Inquiries:pr@nanex.net
