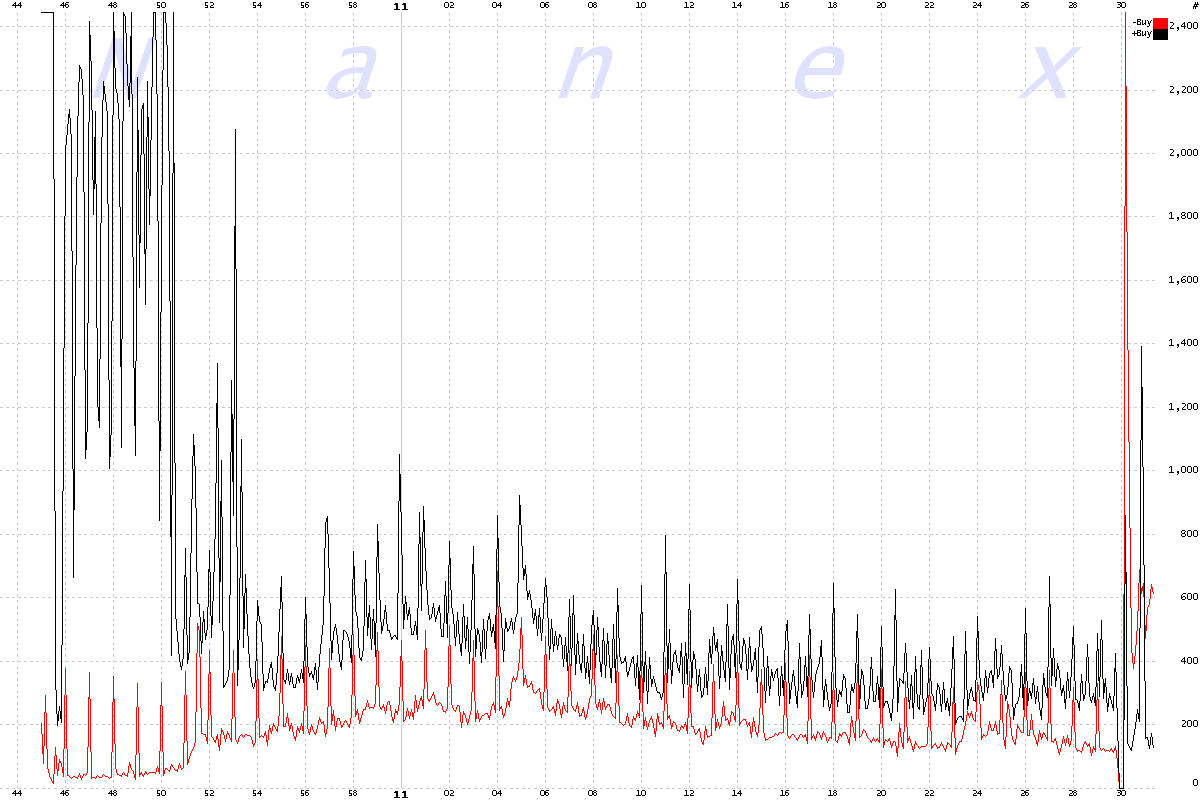
Nanex ~ 20-Aug-2012 ~ Facebook TotalView Buy Orders |
|
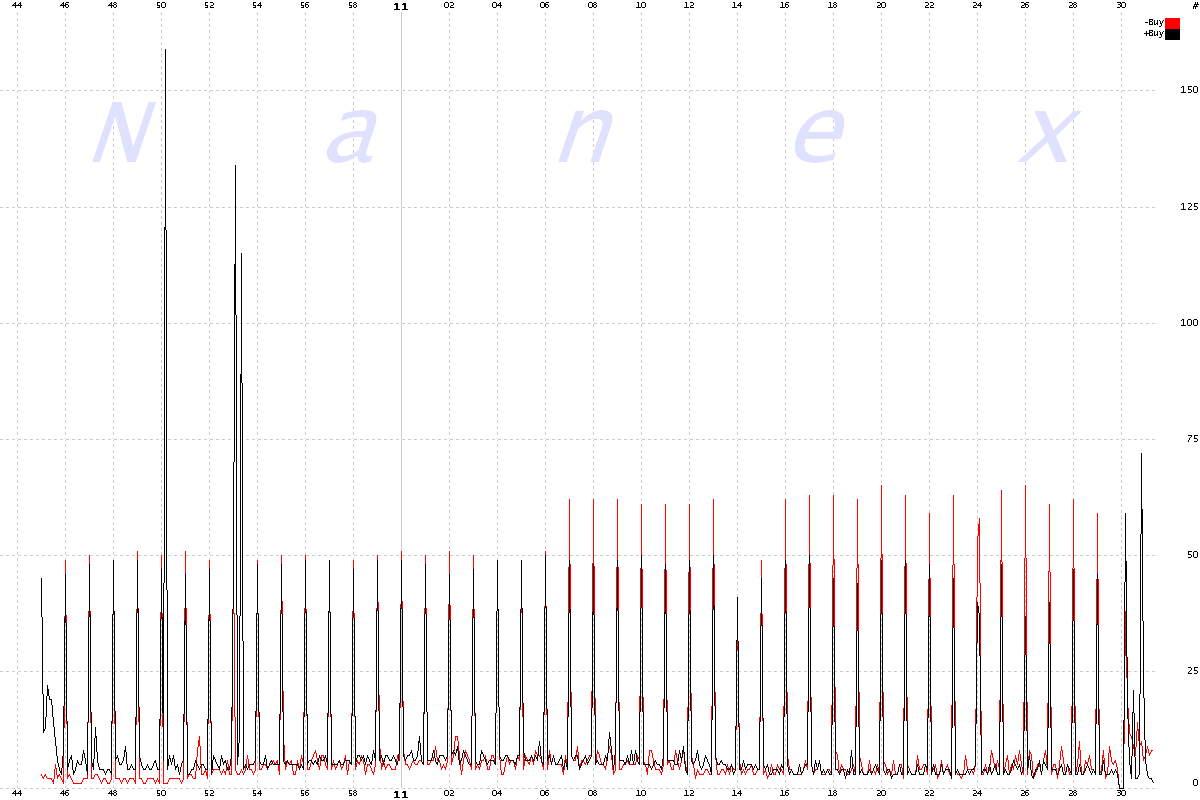
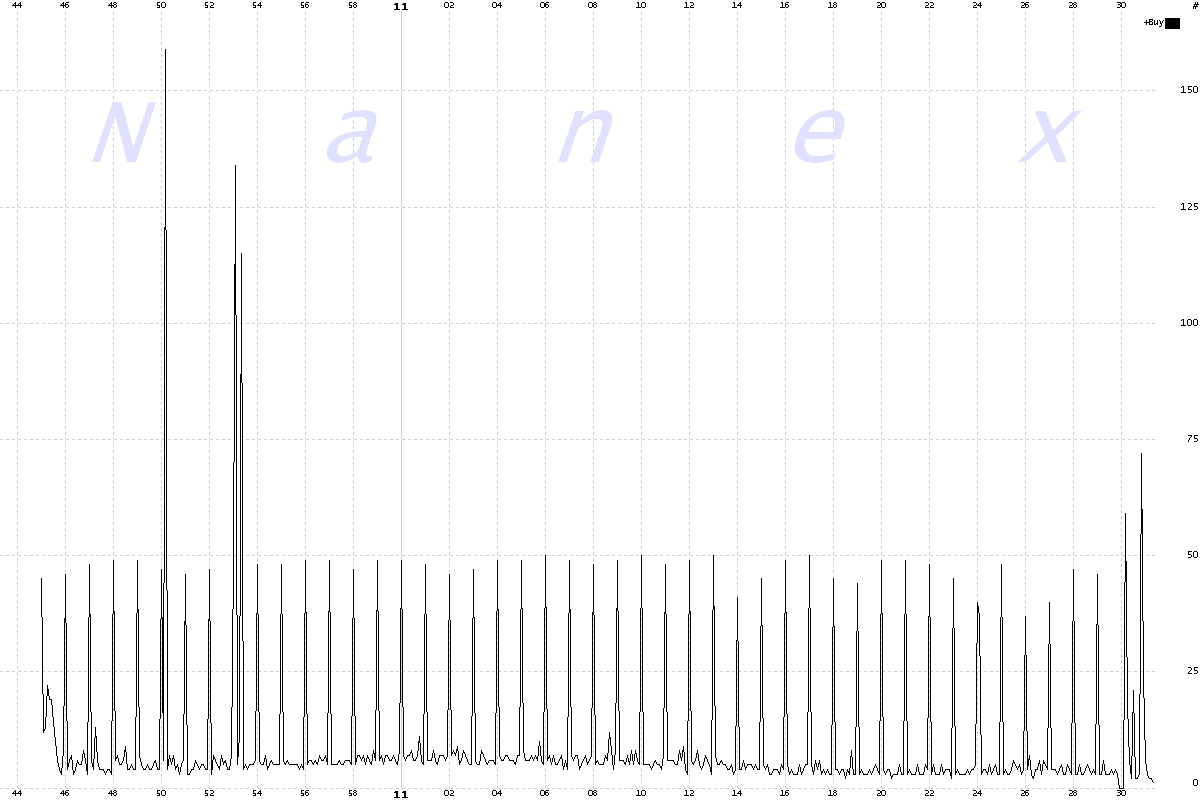
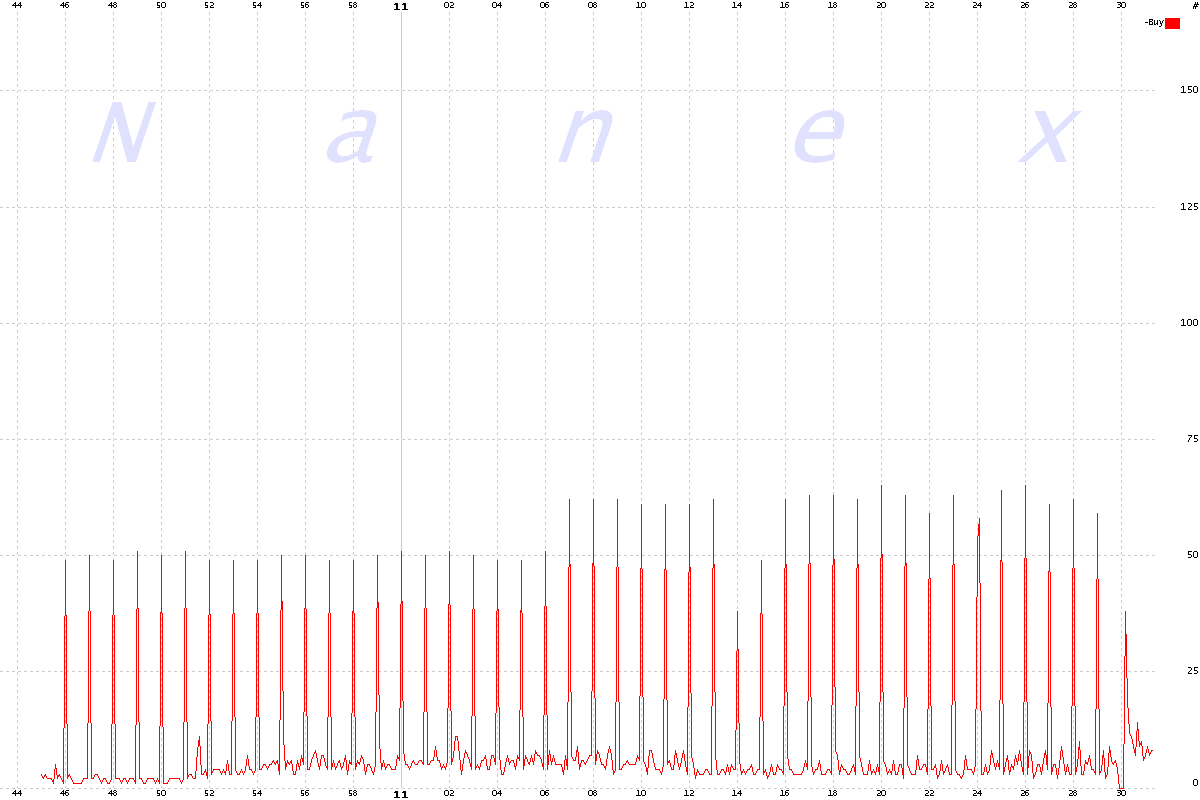
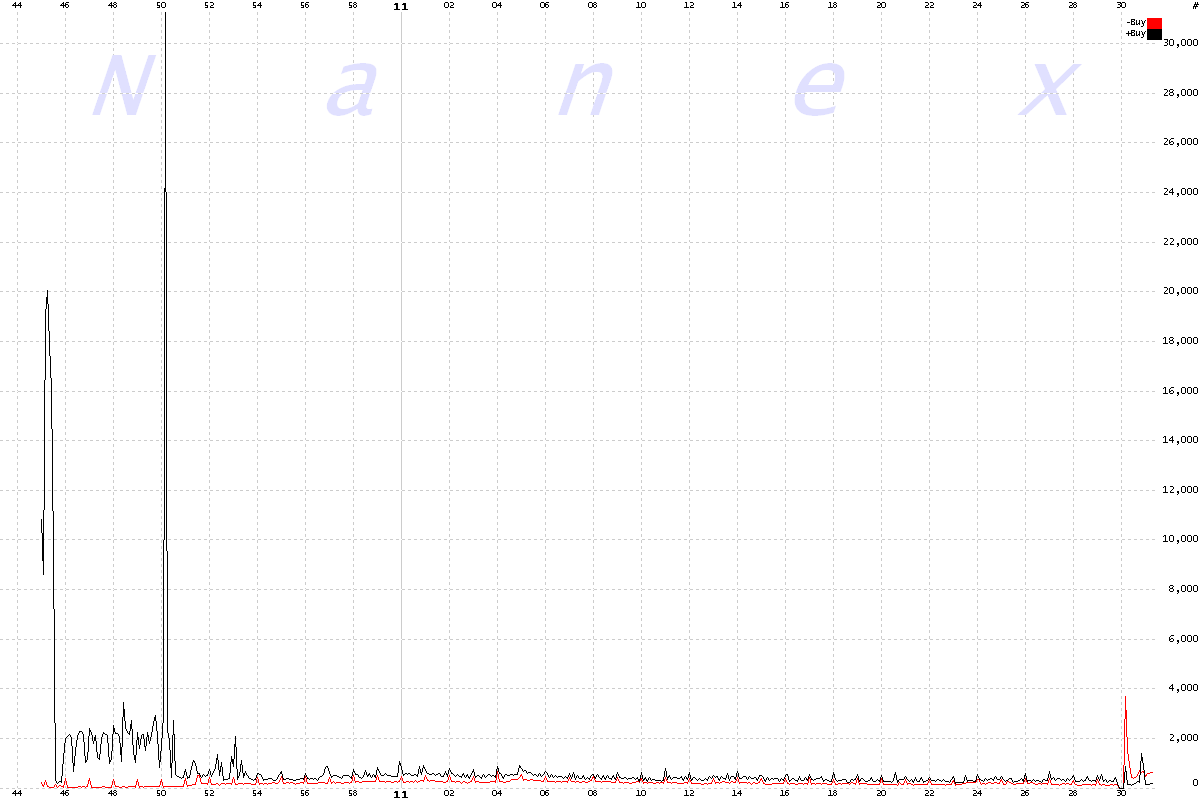
TotalView buy order add and cancel message counts for Facebook between 10:45 and 11:30, right before the IPO. Note the spike that occurs once per minute. This turns out to be a cancelling of a few hundred buy orders, immediately followed by the addition of a few hundred buy orders with the same price (differs from the price of the orders canceled). The relationship between the old and new prices seems random, but all orders being canceled have the same price, and all new orders added have the same, but different price. The prices range from 55.34 to 78.26. Note you can just make out the 17 second radio silence gap at the bottom right of each chart. |
