
Nanex ~ 22-Aug-2012 ~ HFT Madness
On August 22, 2012 at 15:17:43, the stock of KAR Auction Services (KAR) exploded. Over
the next 15 seconds the price gyrated wildly.
Animation of the event. The circles show the best bid (green), best offer (red), or trade (gray) in KAR.
The lines connect individual exchange bid and offers. Yes, they swing that much. (see also).
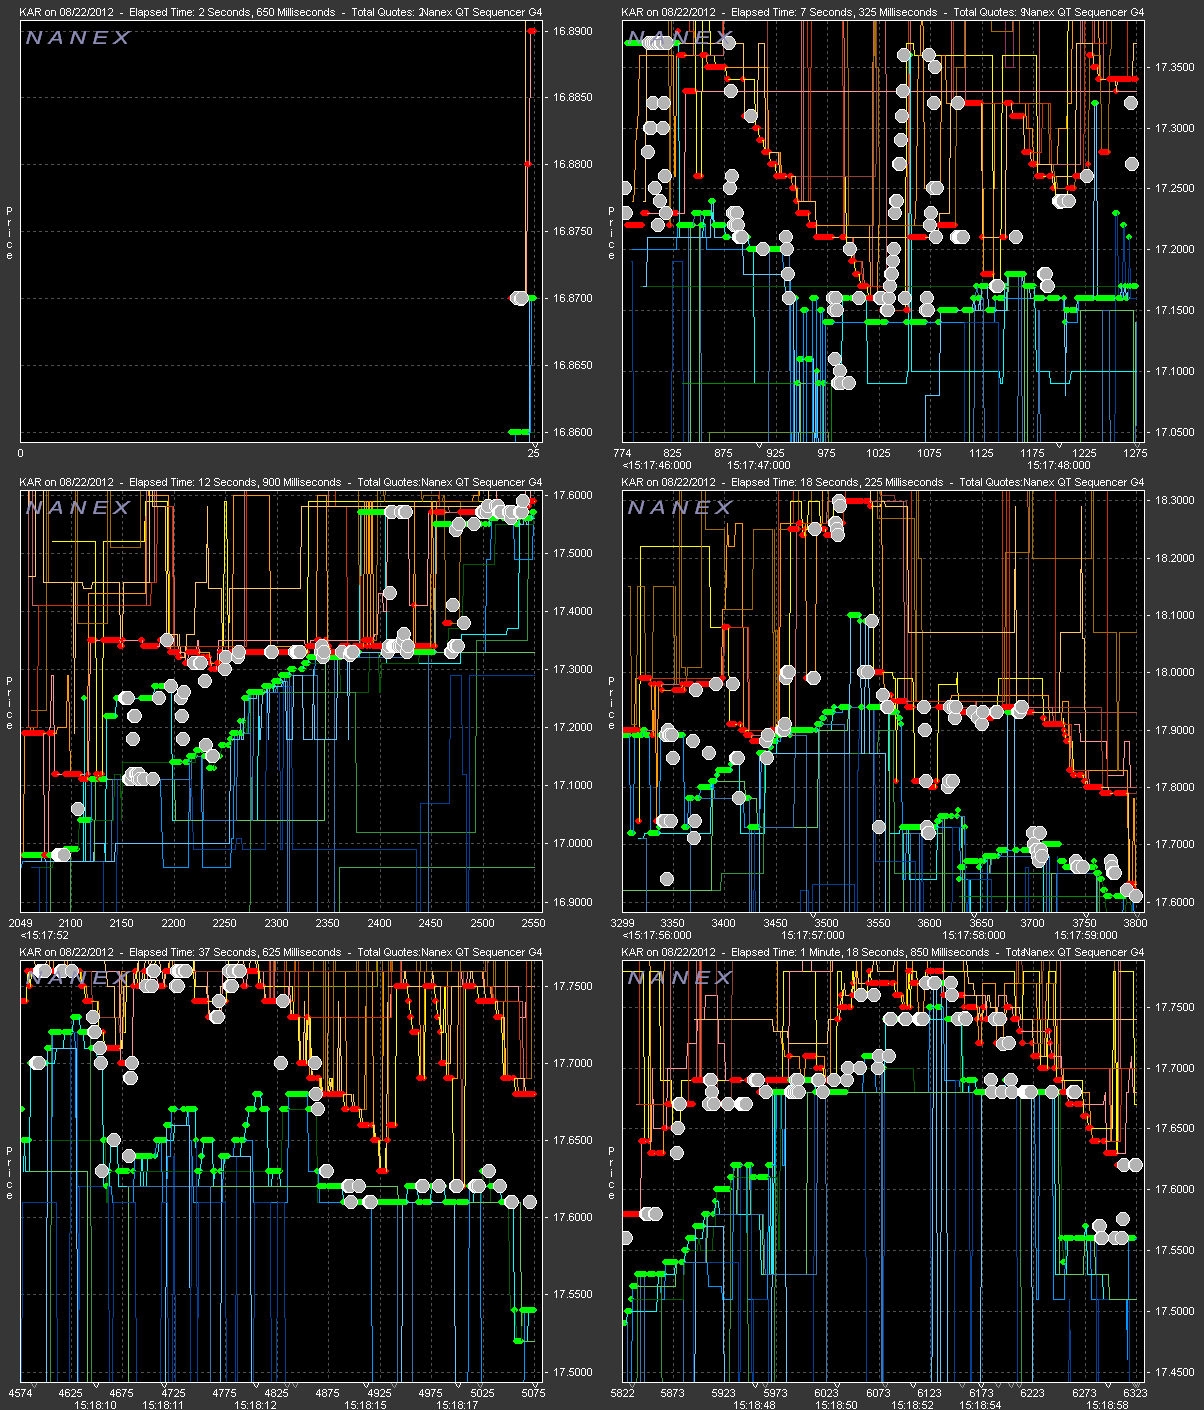
Chart 1. KOR 1 second interval chart showing trades color coded by exchange.
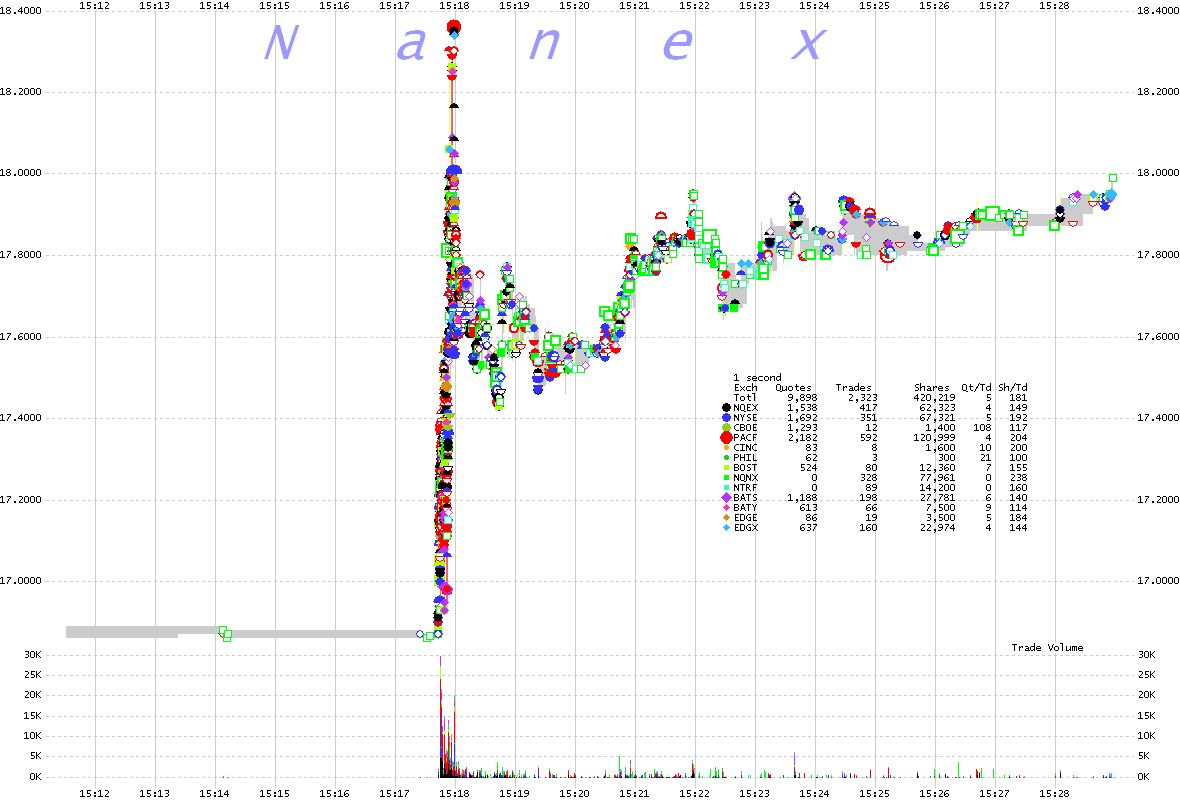
Chart 2. KOR 25 millisecond interval chart showing trades color coded by exchange.
Note the wild price swings.
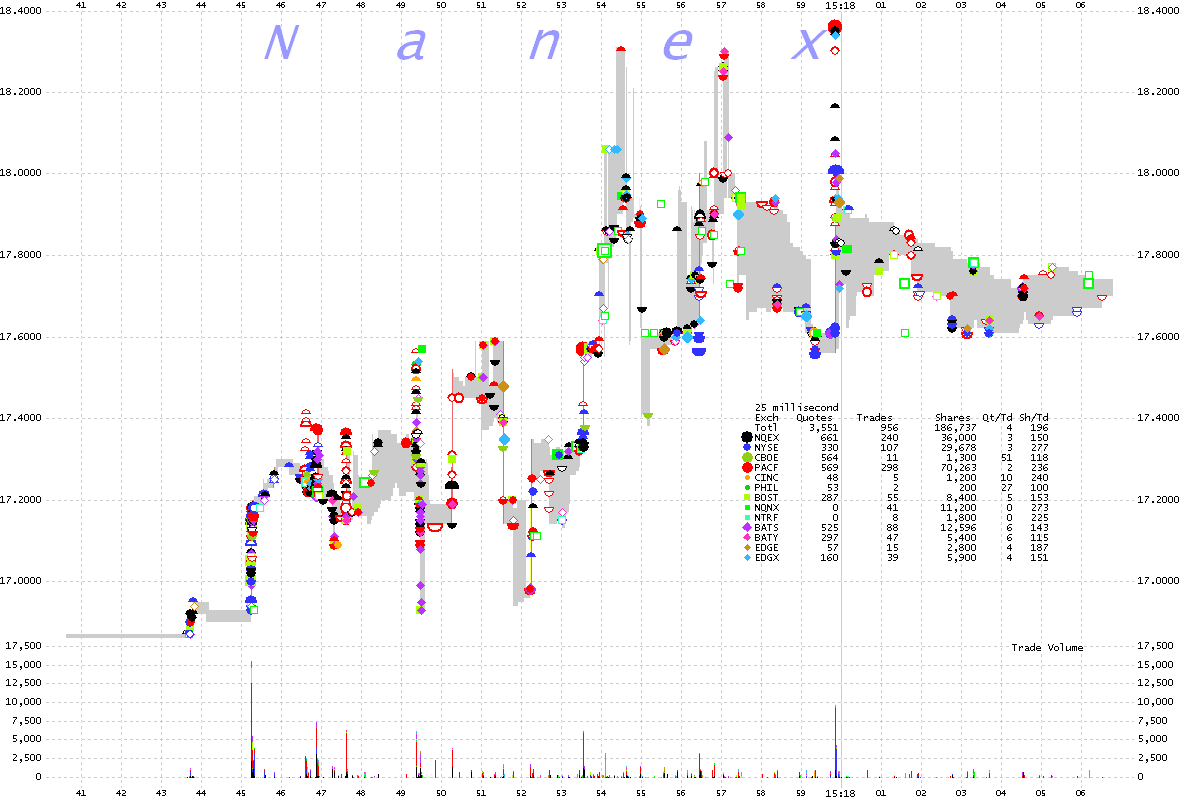
Chart 3. KOR 25 millisecond interval chart showing bids and asks color coded
by exchange. Total chaos.
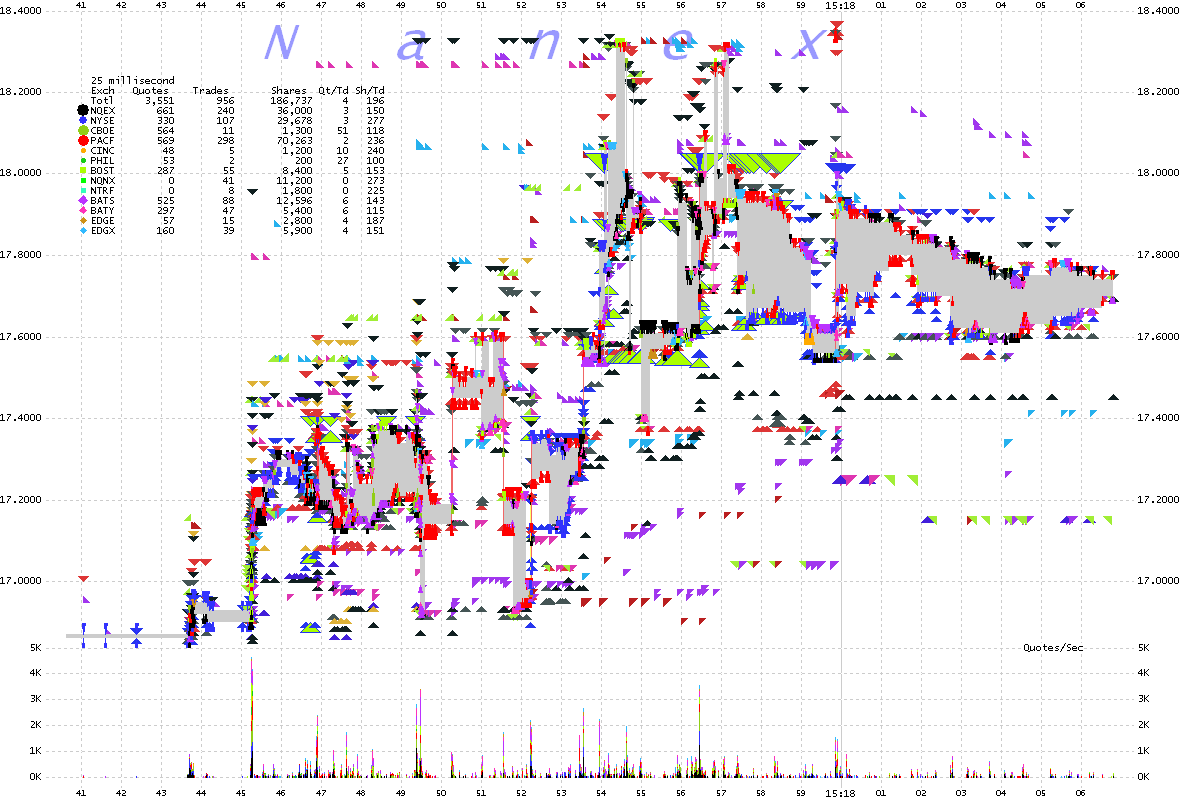
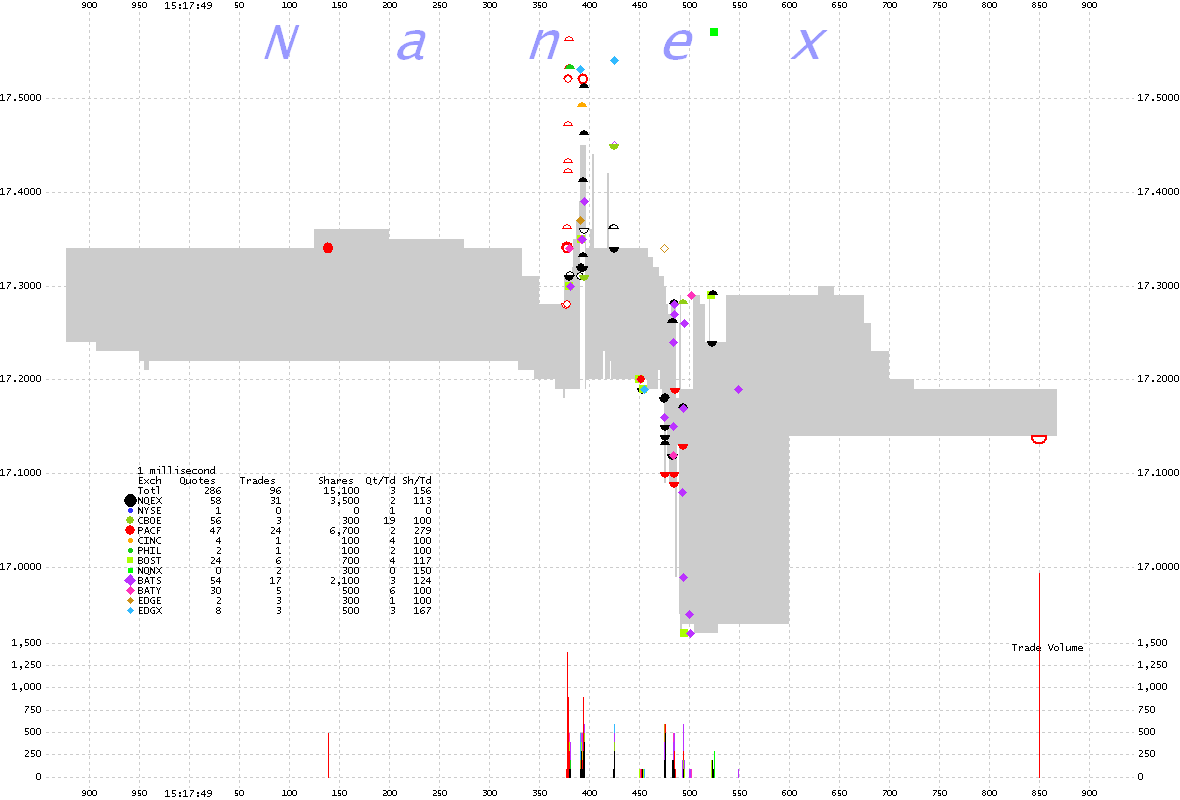
Chart 4. KOR 1 millisecond interval chart showing trades color coded by exchange.
Note the wild price swings that occurred over 1 second.
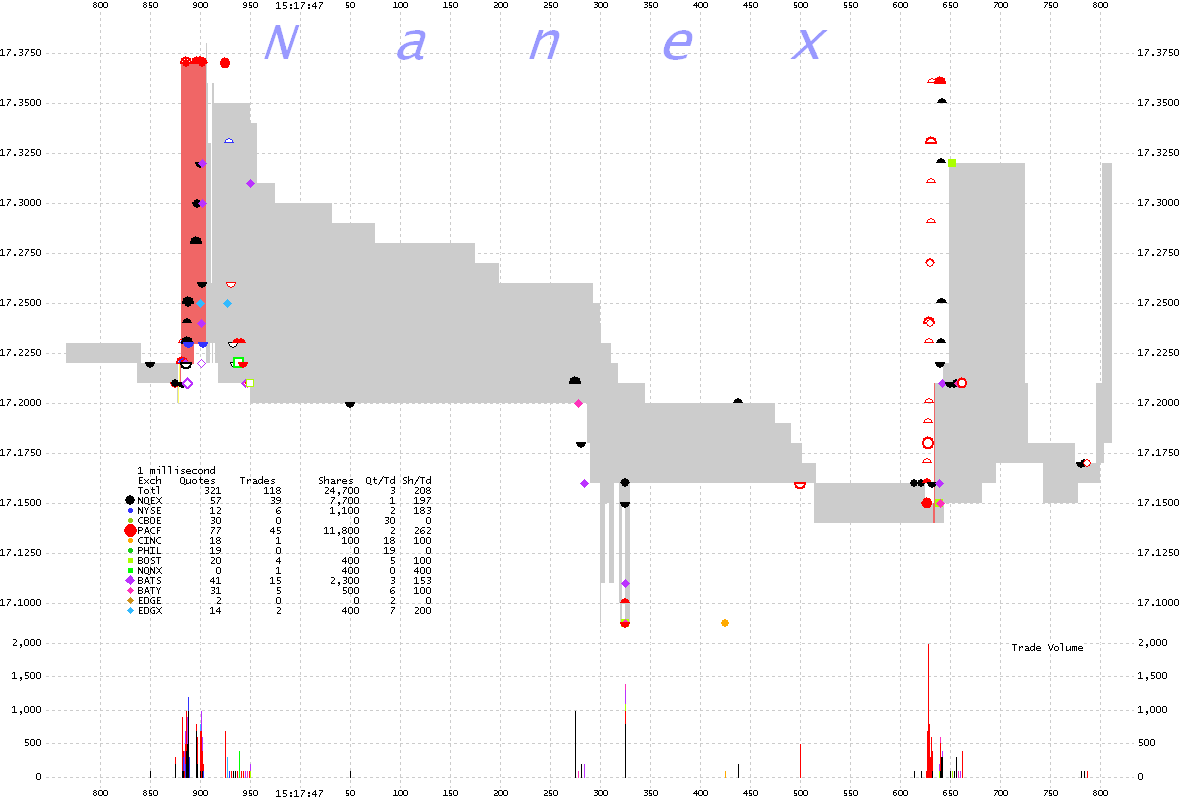
Chart 5. KOR 1 millisecond interval chart showing trades color coded by exchange.
Chart shows 1 second of data. Prices blast up and then 100 ms later, back down.
Nanex Research
Inquiries:pr@nanex.net


