Nanex Research

Nanex ~ 23-Aug-2012 ~ Strike Three
Executive Summary
Analysis of sub-penny trade data doesn't support SEC's conclusions about internalizers
as written in the final flash crash report. There is abundant evidence that
internalizer software was acutely sensitive to the integrity of the consolidated feed
and would switch off internal matching only if and only when the quote was crossed. Furthermore,
short term volatility had little, if any impact on the number of sub-penny trades. About
the only thing our findings have in common with the SEC report on this matter, is that
the date
in question was May 6, 2010.
This revelation, that internalizer software is sensitive to the integrity of the consolidated
quote, means someone could manipulate the consolidated quote in order to cause internalizer
software to reject valuable retail orders and spill them to dark pools or exchanges.
This may explain the common micro-bursts of activity that occur throughout the trading
day and cause a number of stocks to have crossed quotes in the consolidated feed.
Sub-penny Analysis Leads to Flash Crash Discovery
While analyzing sub-penny trades since 2006, we made a few
fascinating observations, one of which reminded us of something
the SEC wrote in their final flash crash report about internalizers (the source of most
sub-penny trades). Internalizers are
stock wholesalers that buy order flow from retail firms such as Schwab and E*Trade. Normally,
they match orders internally and fill trades based on the prices from the SIP (securities
information processor, the consolidated data feed). Most retail orders never reach an
exchange. You can measure the activity of internalizers by analyzing the number of trades
that were executed at sub-penny prices (prices requiring 3 or more decimal places).
Since exchanges forbid orders that are priced below increments of 1 cent, internalizers
are the only regular and consistent source of sub-penny trades.
Back to the flash crash report. The SEC wrote that internalizers stopped matching customer orders
because of the wild price swings. Furthermore, they wrote that a delay in consolidated
quote was unlikely to affect anyone with a direct feed. However, from analyzing a trillion trades since 2006, we found that the occurrence of sub-penny trades has little correlation
with market activity (see this
animation). This is probably because no matter how wild prices are, an internalizer will always have a comfortable margin of time on their side.
This is not to say the flash crash had no effect on sub-penny prices, it did. But not
until about 7 seconds after the bottom was set when the eMini (S&P
futures contract) exited the 5 second halt at 14:45:33.
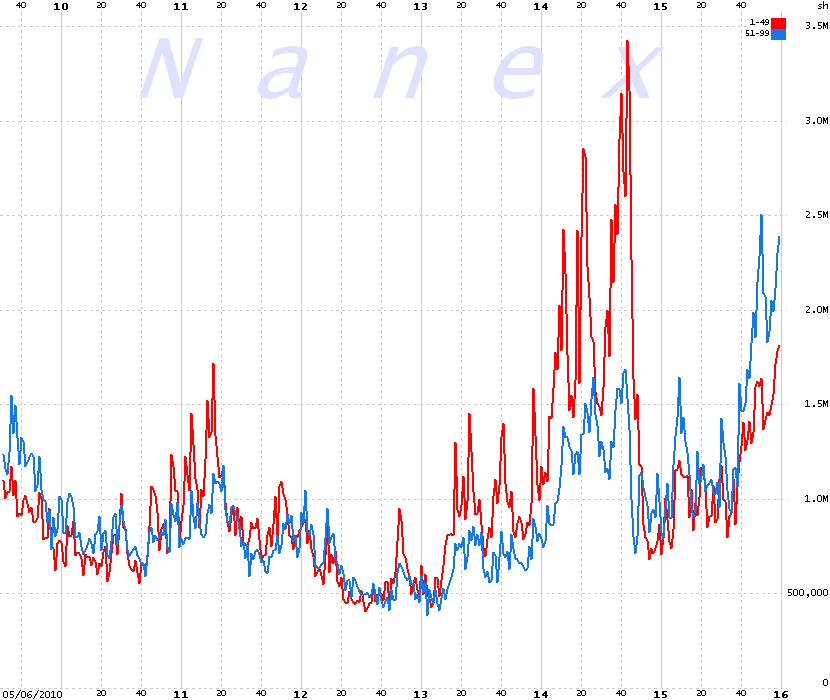
The chart below shows the volume
of shares in U.S. stocks with sub-penny prices on May 6, 2010. The red line shows the
sum of share volumes for trades with prices in fractions of a penny from 1 to 49 (100ths
of a cent). The blue line shows share volumes for fractions of a penny from 51 to
99. Think of the red line as retail sell orders, and the blue line as retail buy orders.
The sudden drop from the peak shown on the chart occurs at approximately 14:45:40. If you didn't notice that internalizer activity was exploding when the market was
crashing, don't feel too bad; the SEC clearly missed it.
Now, we know internalizers did route orders to the exchanges or other venues that day,
because that was the source of many stub quote trades (1 cent for Accenture).
But internalizers (the big ones) didn't just turn off like the SEC would have you believe.
They did turn off, but only for short periods of time (seconds).
And the reason they switched off depended on the one thing the SEC
said didn't matter: the integrity of the consolidated quote.
Beginning about 15 seconds before 14:43 that afternoon, an unusually large delay began
building in the NYSE quote for a certain group of stocks (based on alpha,
see this chart). We think a process at the NYSE which
transmits quotes to the SIP for this group of stocks became overloaded and began queuing
data, which resulted in older NYSE quotes getting mixed in with fresh quotes from
other exchanges. That in turn caused the SIP to transmit crossed (inverted) quotes in
the consolidated feed. A crossed quote has a bid price higher than the ask price. For
stocks that were falling in price (the majority of them), the consolidated feed combined
the slower (and therefore higher priced) bid from the NYSE with the faster (and lower
priced) ask from other exchanges (charts).
Software used by key internalizers would most certainly
be sensitive to prices in the consolidated feed, because those prices are used in executing
customer orders. Therefore when it detected an unusually large crossed quote in a symbol,
it stopped matching orders for that symbol, and instead, routed those orders to an exchange or other venue. At the very time, and in the very symbols experiencing heavy loads.
Therefore, we would expect to see a reduction in sub-penny trade volume in stocks when
there was a crossed quote, and no noticeable reduction in stocks with normal quotes.
Fortunately for our experiment, the NYSE had just upgraded the servers used for about
half of the listed symbols, leaving the other half on older (and slower equipment).
This gives us abundance of data to test our hypothesis.
After looking at dozens of symbols for the time between 14:42 and when the emini was
halted at 14:45:28 for 5 seconds we find that sub-penny prints only stop in a
symbol when that symbol has a crossed quote. As soon at the quote returns to normal,
sub-penny trades immediately return. It has nothing to do with how wild price swings are, as long
as the consolidated quote is not locked or crossed, an internalizer will match it.
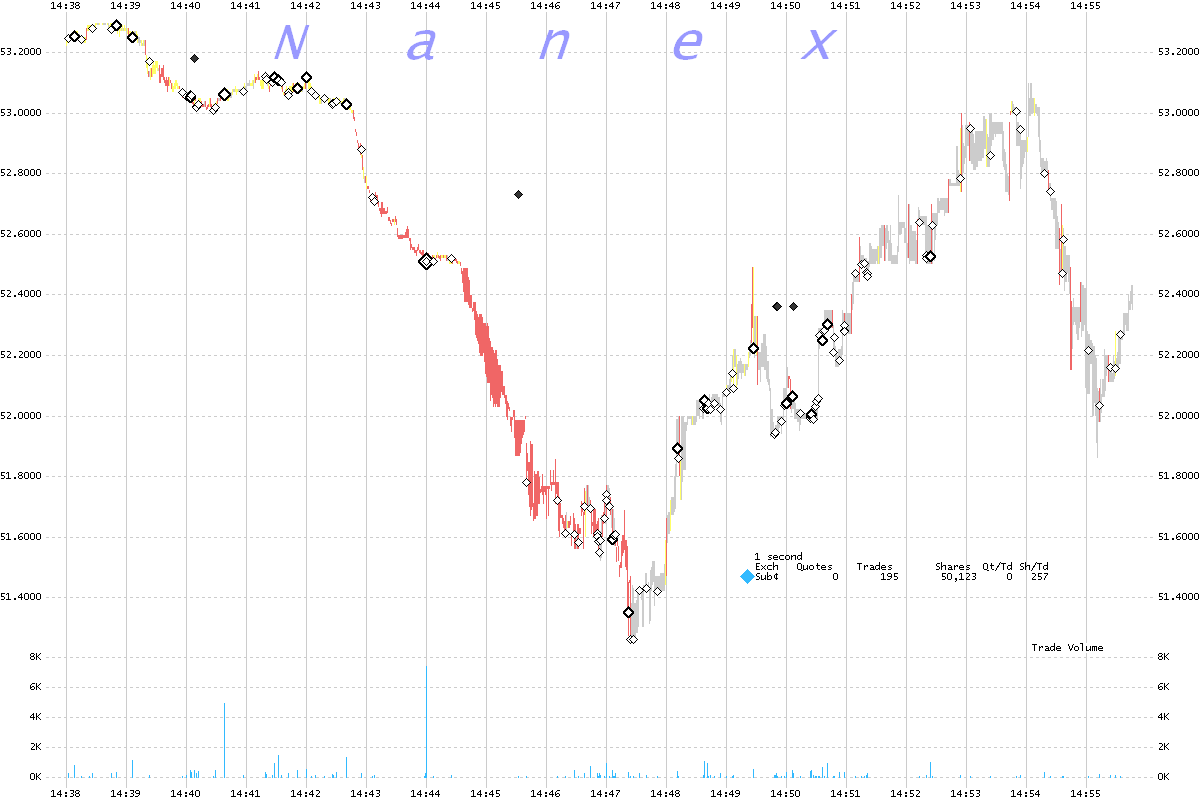
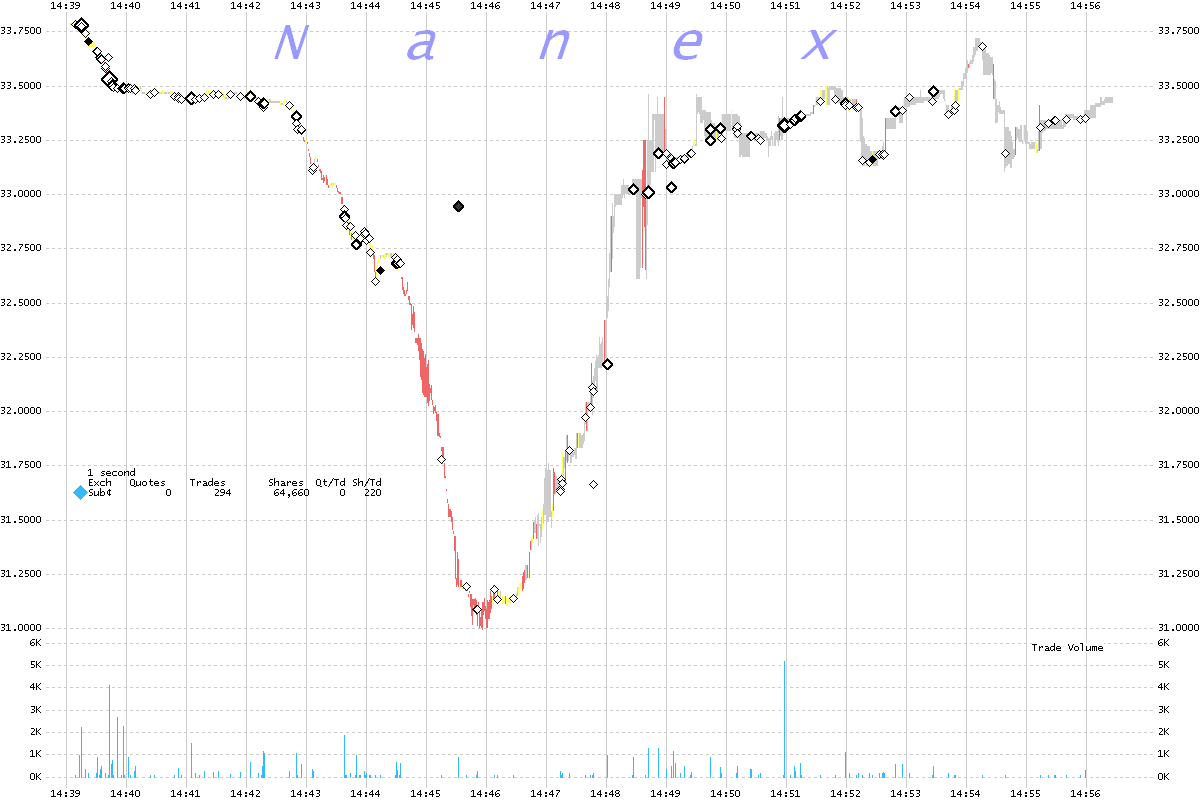
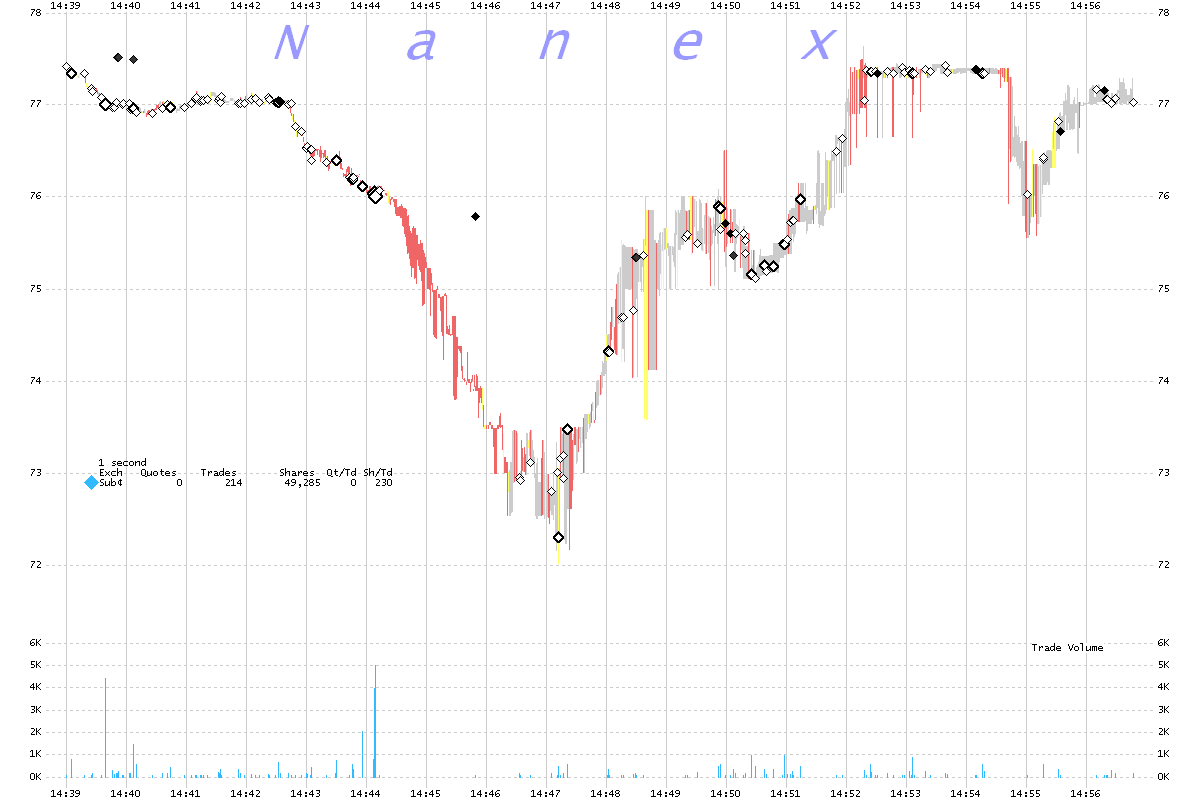
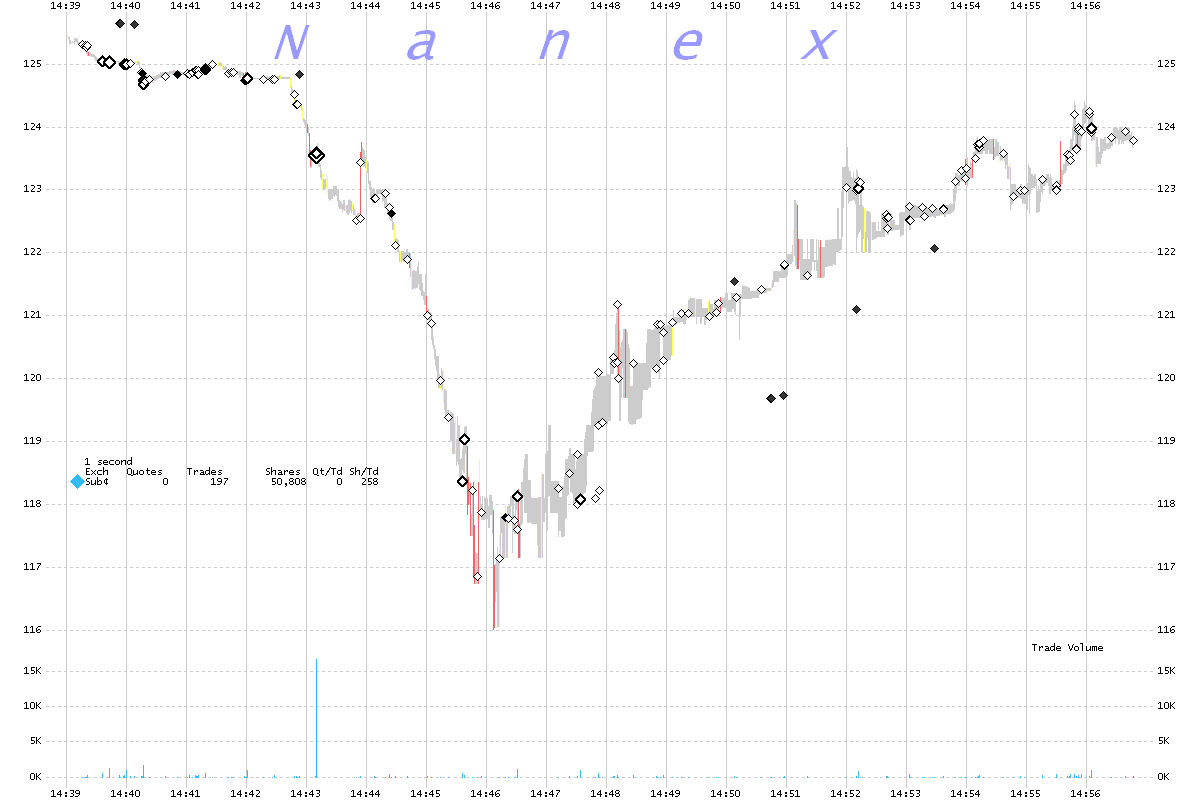
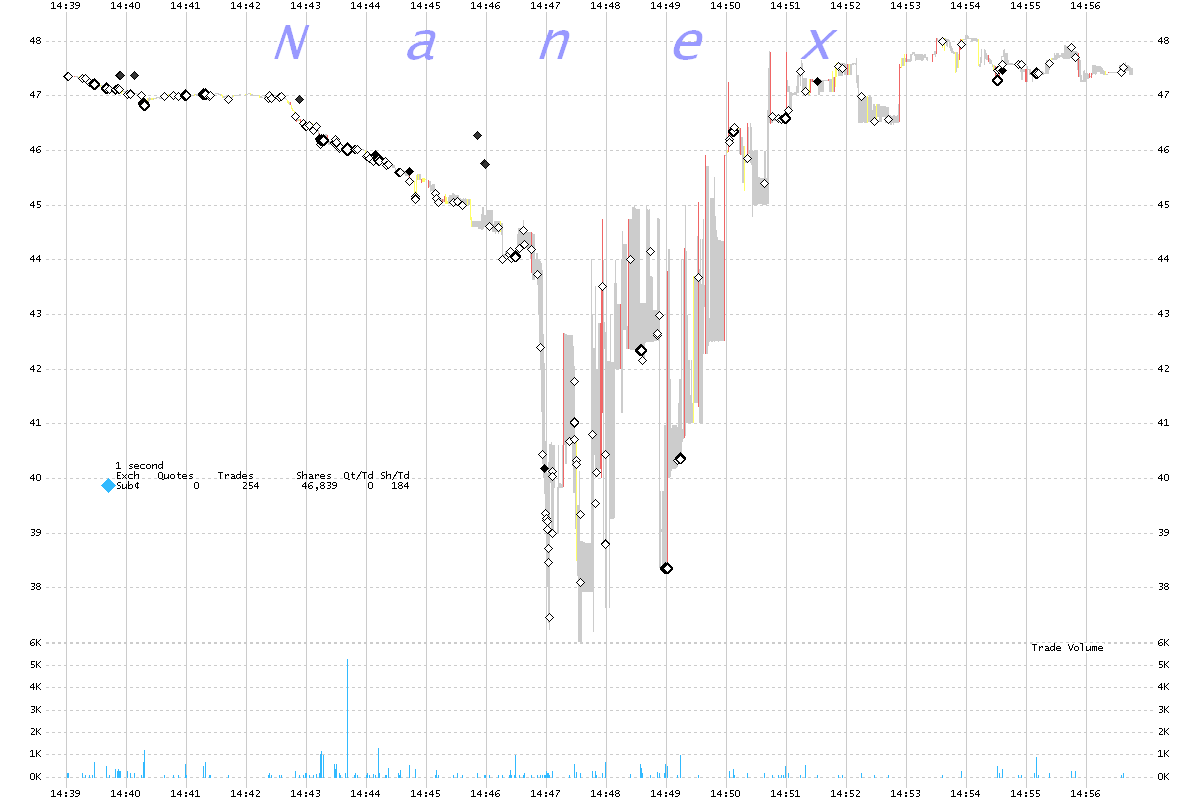
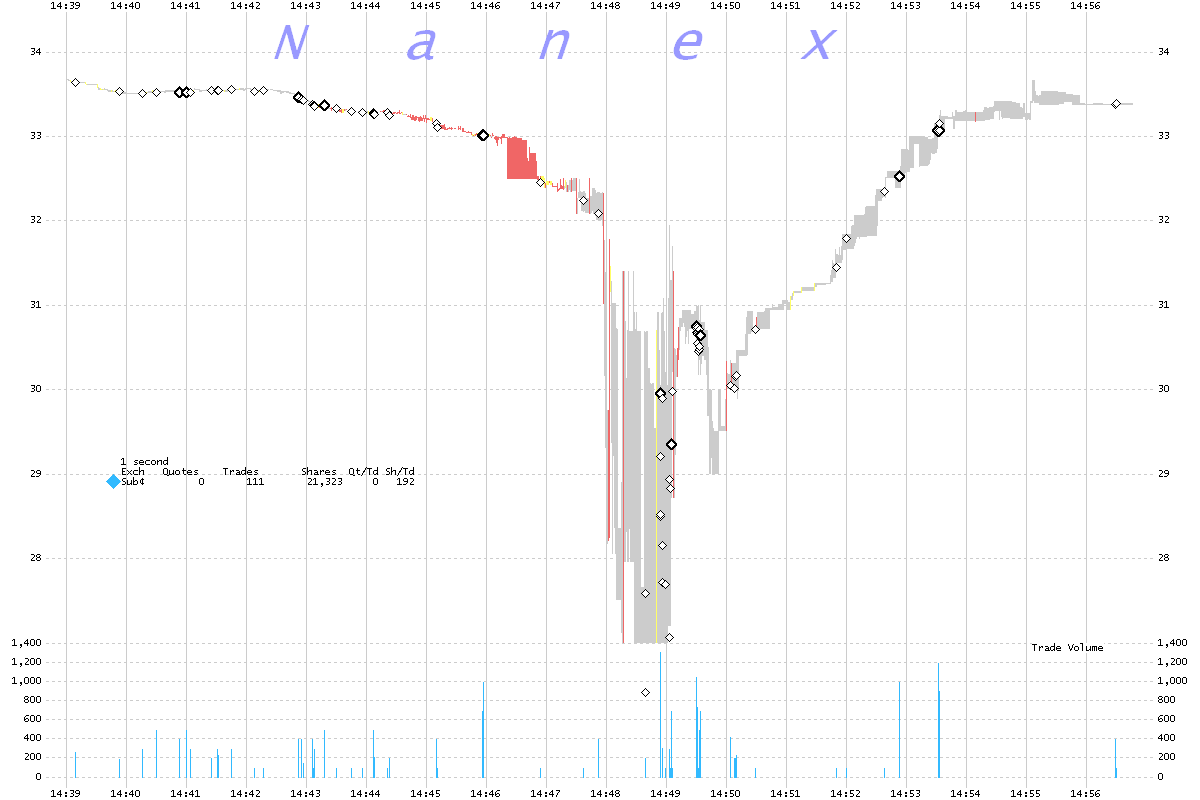
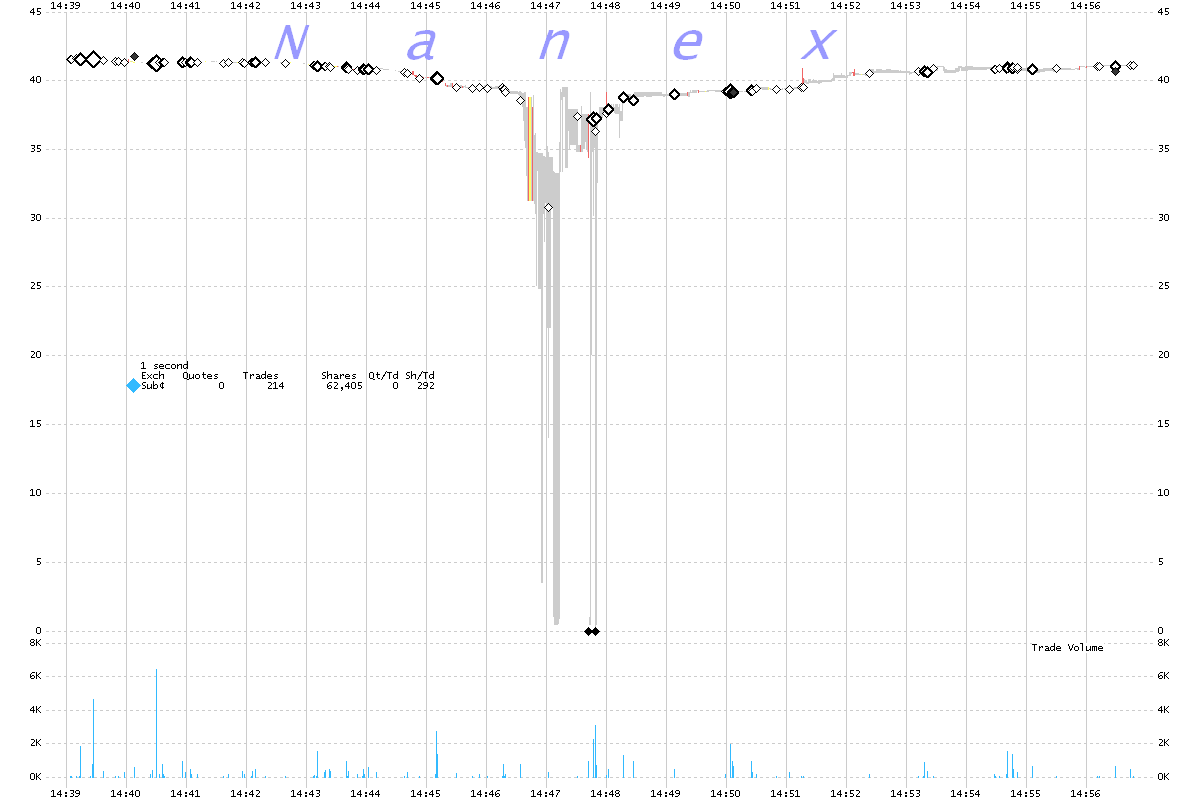
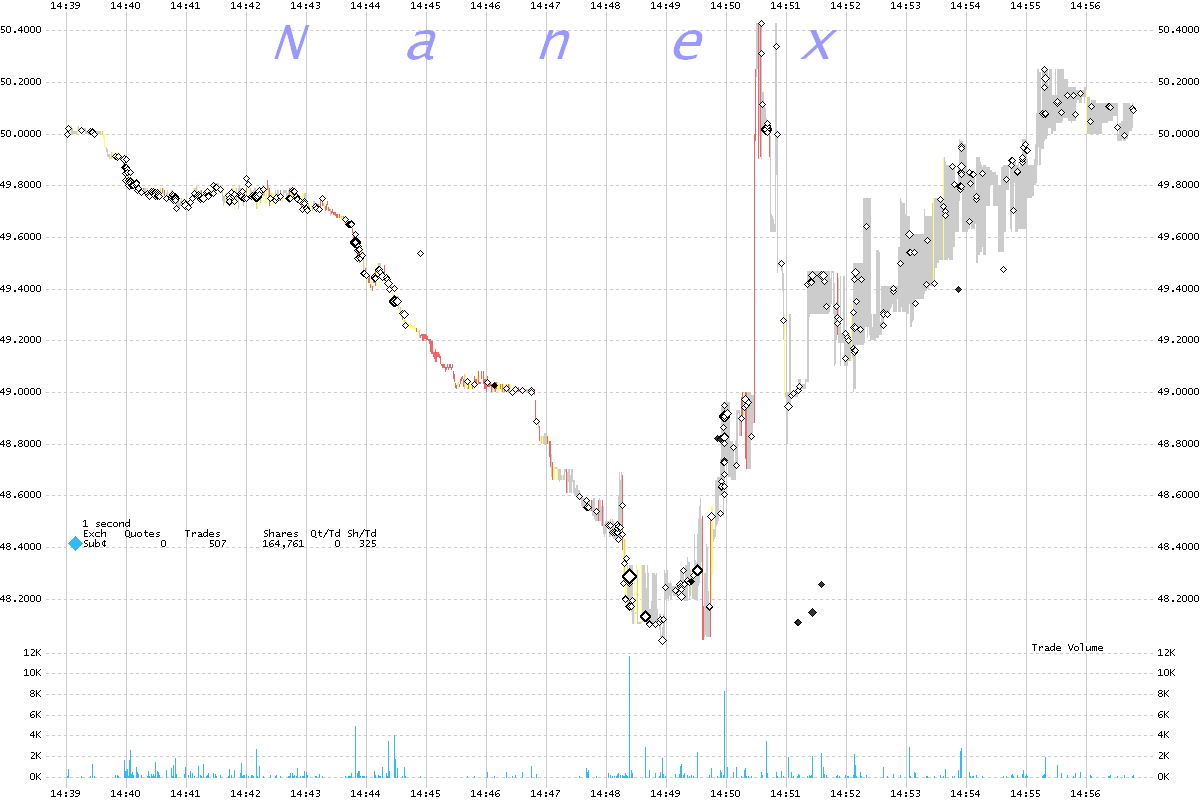
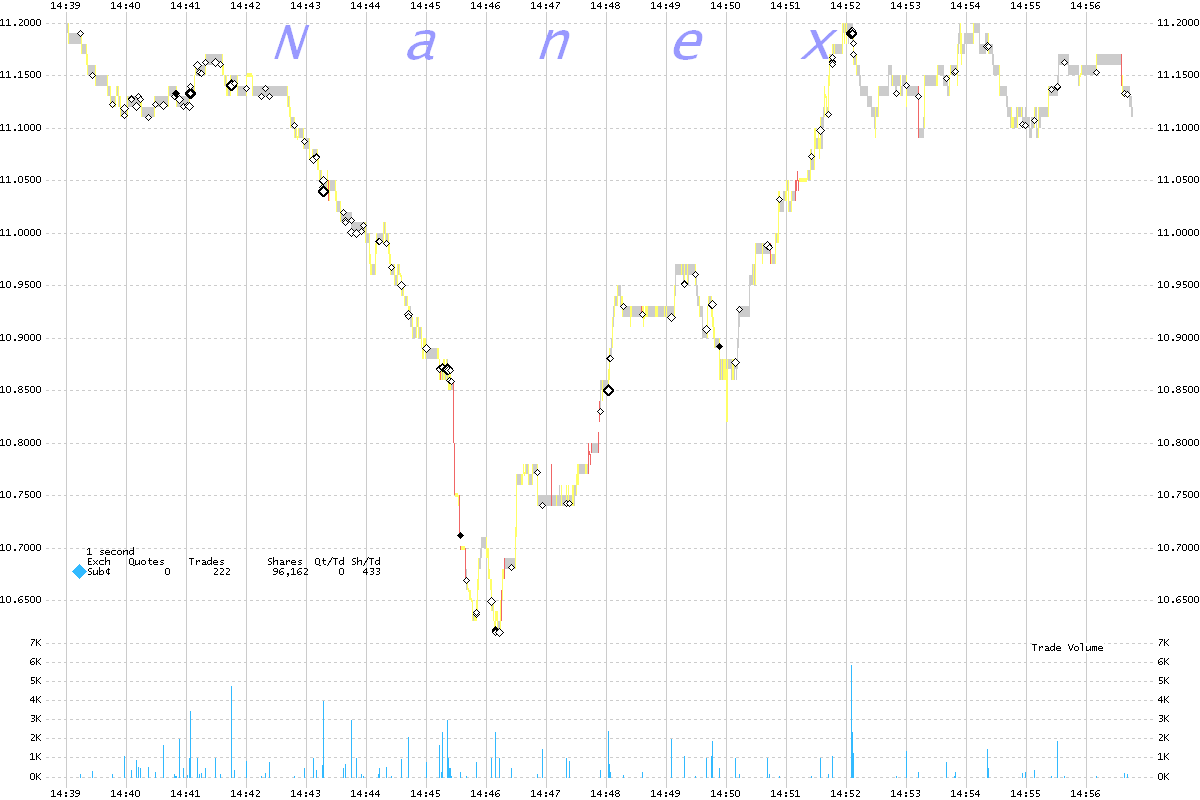
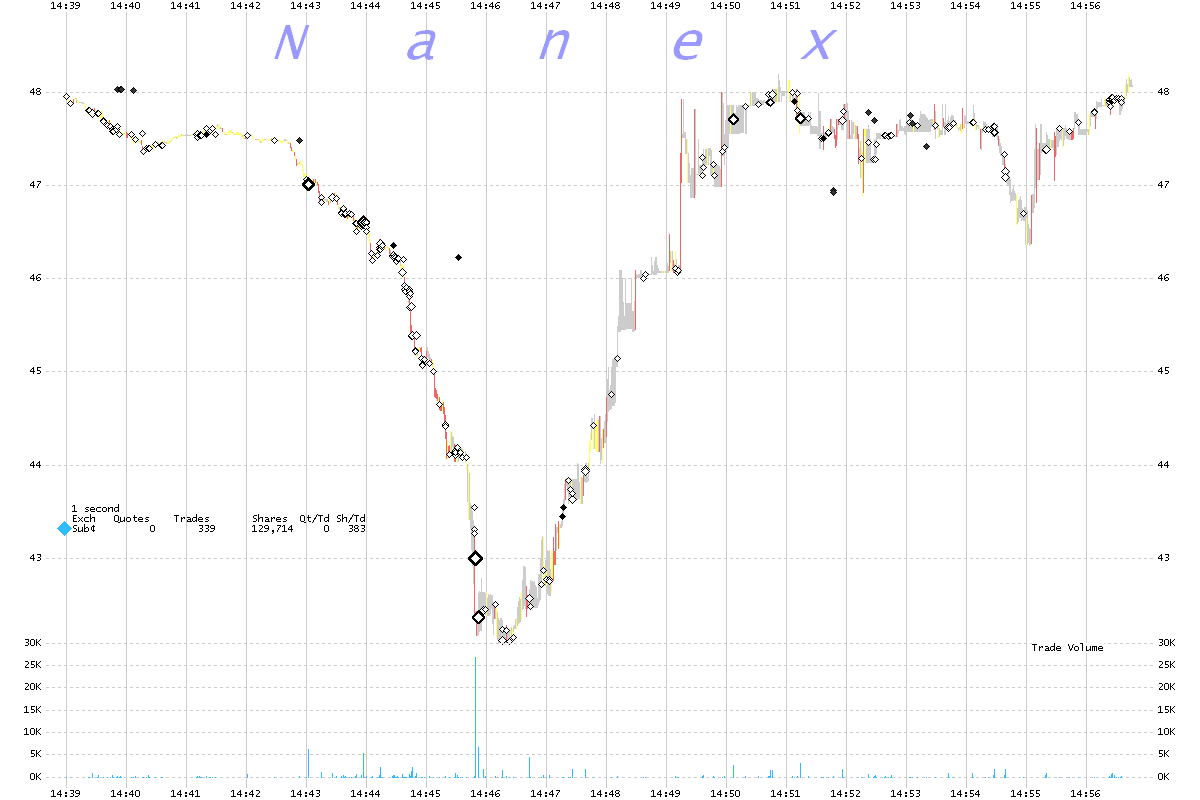
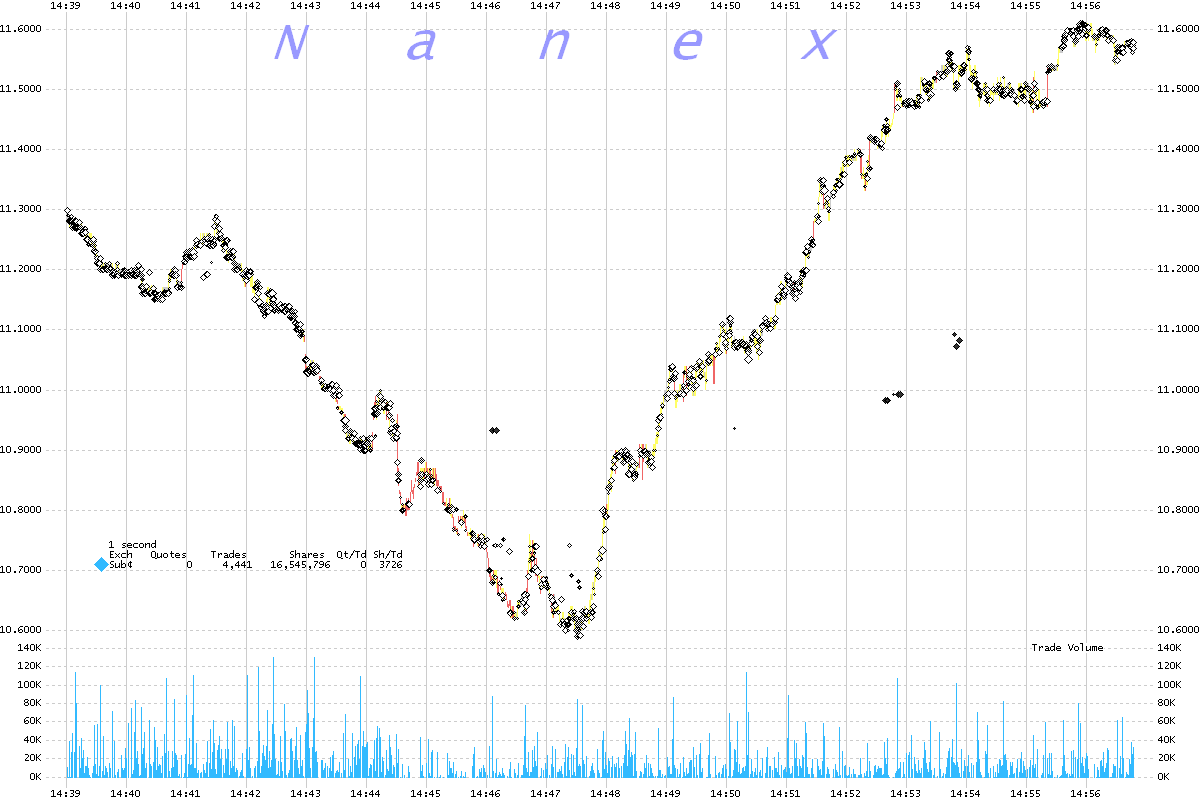
The following 12 charts plot the NBBO and (only) sub-penny trades in one-second intervals during
the flash crash (May 6, 2010).
The shaded area shows the NBBO (National Best Bid and Offer spread) and is colored gray
for normal, yellow for locked (bid = ask), or red for crossed
(bid > ask). The volume shown in the lower panel of each chart
is the number of shares traded at sub-penny prices during that second.
1. GE - General Electric.
The red shading is where the NBBO was severely crossed caused by NYSE's quotes getting
delayed by over 35 seconds.
Note there are substantially fewer sub-penny trades in the red-shading (where the NBBO
is crossed). Of the few that do appear in the red shading, closer inspection shows the
NBBO is normal for a brief period of time. Internalizer
software recognized the crossed quote and rejected/routed those orders.

2. KO Coca-Cola
Coca-cola, like GE was processed by older (slower machines) and has the same characteristics we saw in GE (chart 2). As with GE, there are no sub-penny trades when the NBBO is crossed (a close up of most of those appearing in the red shows the quote
is normal for a brief period around that execution) The internalizer software detected
the crossed quote (bad input), and kicked orders out. If the feed wasn't delayed, the orders wouldn't have been routed to exchanges, causing stub-penny executions and leading to further market structure breakdown and panic.
3. DIS - Disney
Disney was also processed on slower machines and like GE and IBM, had severe delays. Again, Coca-cola, as with GE and PM, there are no sub-penny trades when the NBBO is crossed. The delay in the datafeed essentially caused the Market maker's (internalizer) software to stop matching orders internally and route them to the exchanges. That caused a flood of orders being routed to exchanges at the very time they were already under heavy load.
4. CVX - Chevron
Chevron was also processed on slower machines.
5. IBM - International Business Machines
IBM was also processed by the upgraded machines. Note there is no interruption of sub-penny
trade executions during the drop. Again, internalizer software continued processing.
6. PM Philip Morris
Phillip Morris was processed by a different group of machines at the NYSE that were
recently upgraded and therefore could better handle the pounding load. There were still
crosses in the NBBO, but nowhere as severe as we saw in GE (and other stocks in GE's
group). Note that there is no interruption of sub-penny trades during the drop as there
was in GE. That means internalizer software didn't switch off because of a severe drop
in price.
Here is a chart showing which symbols were processed by upgraded
(faster) machines.
7. CTL - CenturyLink
CenturyLink was also processed on slower machines. Note the significant number of sub-penny
trades during the wild price swings, which had normal quotes. It wasn't the price swings
that switched the internalizer off, it was the crossed NBBO quote.
8. EXC - Exelon Corporation
Notice the pattern now?
9. BP
10. NOK - Nokia
11. HPQ - Hewlett Packard
12. F - Ford
Nanex Research
Inquiries: pr@nanex.net


