Nanex Research

Nanex ~ 24-Aug-2012 ~ Facebook Sub-penny Trades
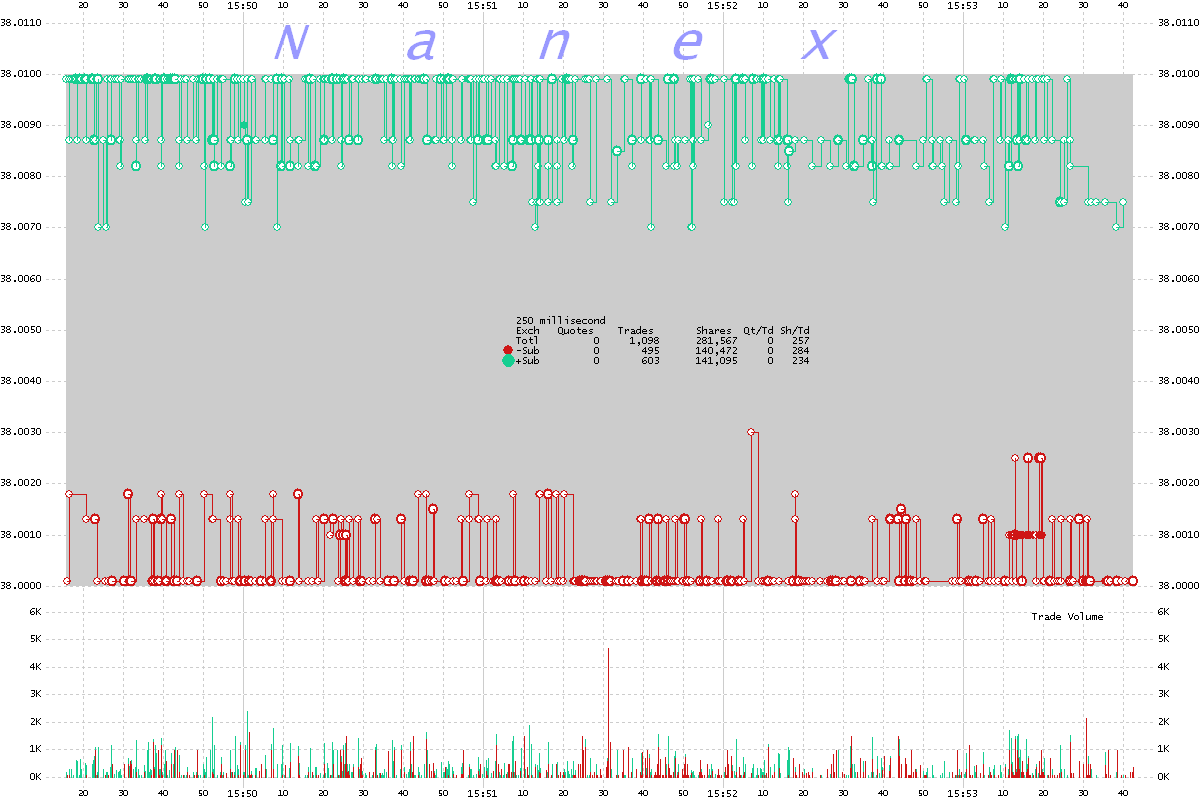
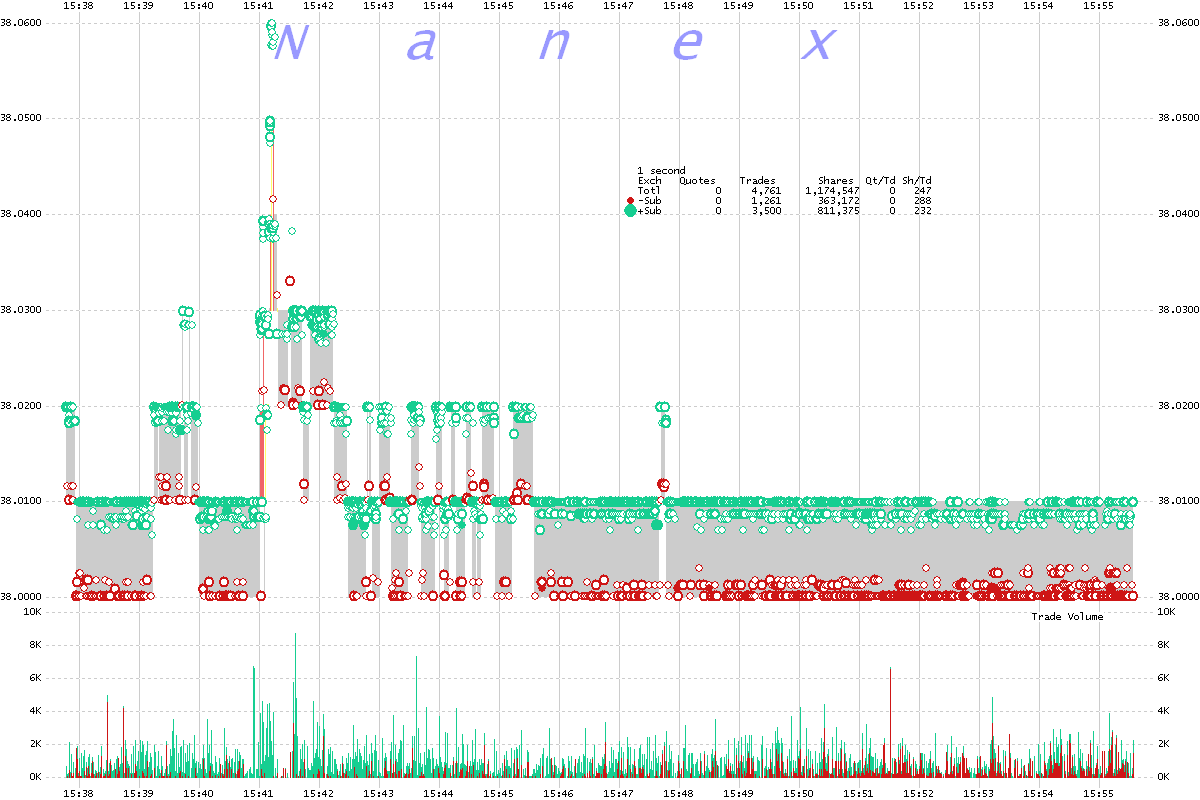
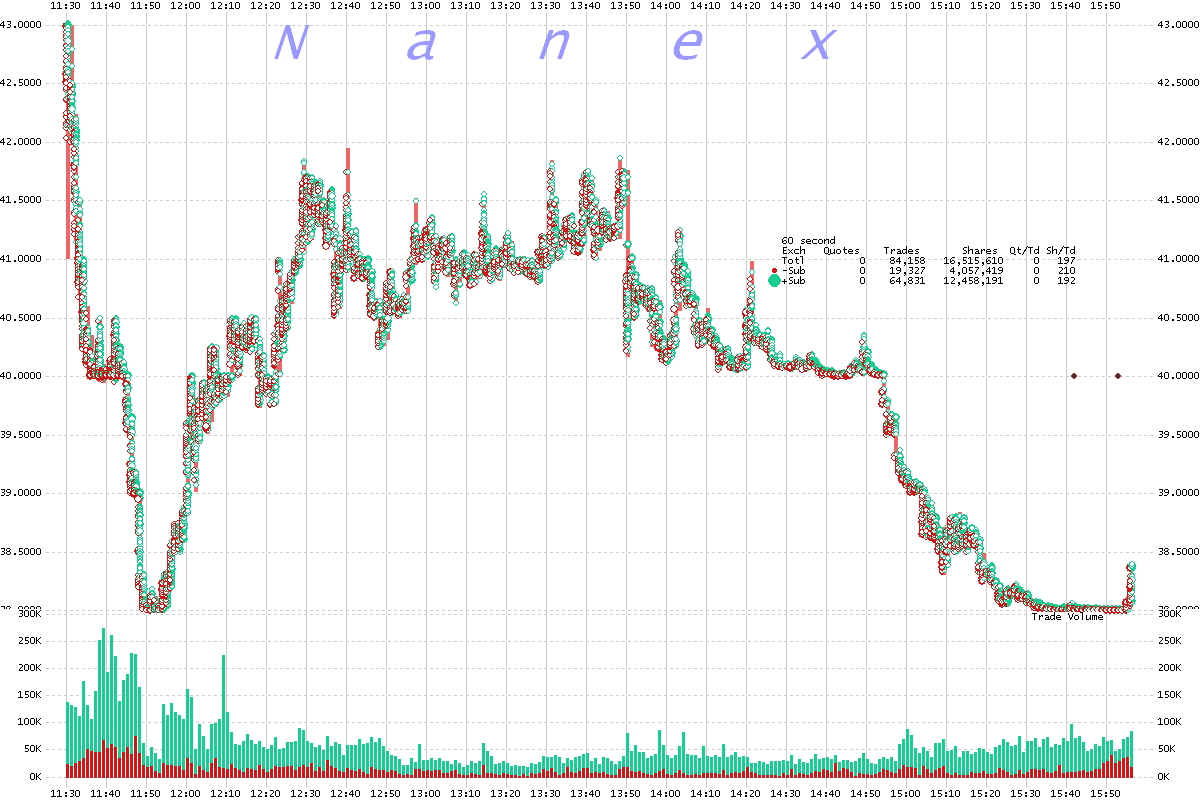
The charts below show sub-penny trades in Facebook on May 18, 2012, the day of their IPO. Trades priced in sub-penny fractions between 51 and 99 are colored light green, and those priced in fractions between 1 and 49 are colored in red.
1. FB - 250 millisecond interval chart showing 4 1/2 minutes of trading about
10 minutes before the close.
The bid-ask spread on this chart is just 1 cent!
Note how well balanced the volume of shares is between retail buying (141,095
shares) and retail selling (140,472 shares). Also note how the majority are
priced a mere 1/100th of a cent in the investor's favor (more on that
here).

2. FB - 1 second interval chart zooming out from the chart above.

3. FB - 1 minute interval chart showing the entire day.
Note the imbalance between retail buying (12,458,191 shares) and retail
selling (4,057,419 shares). Across all stocks in total, imbalances in sub-pennies
are rare. See
this animation.

Nanex Research
Inquiries: pr@nanex.net


