Nanex ~ 27-Aug-2012 ~ Citigroup Micro-Crash
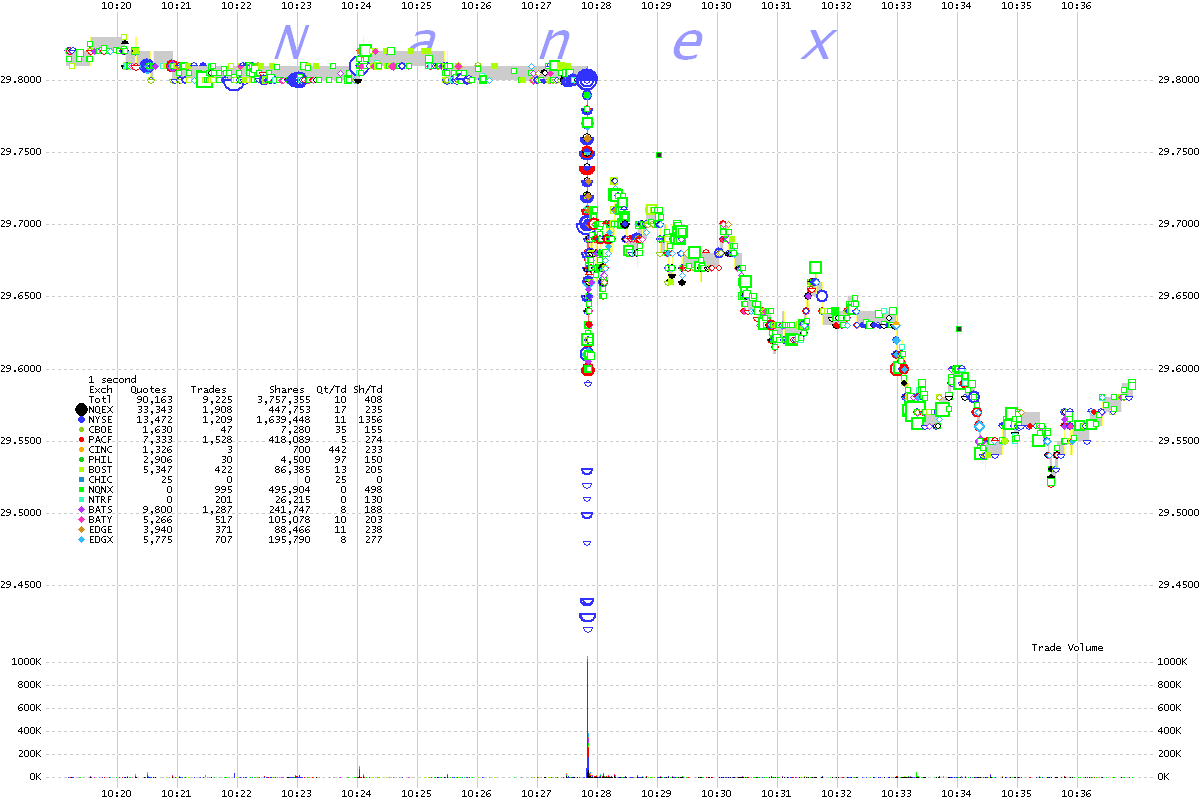
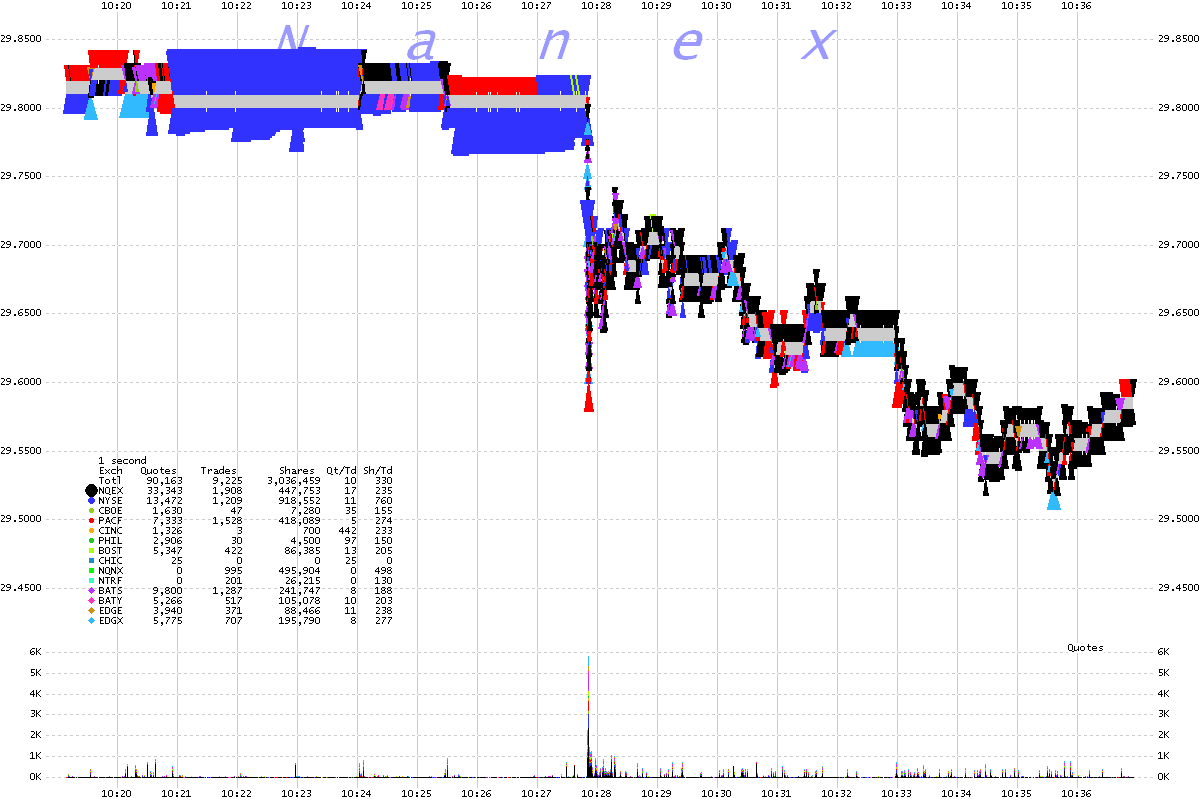
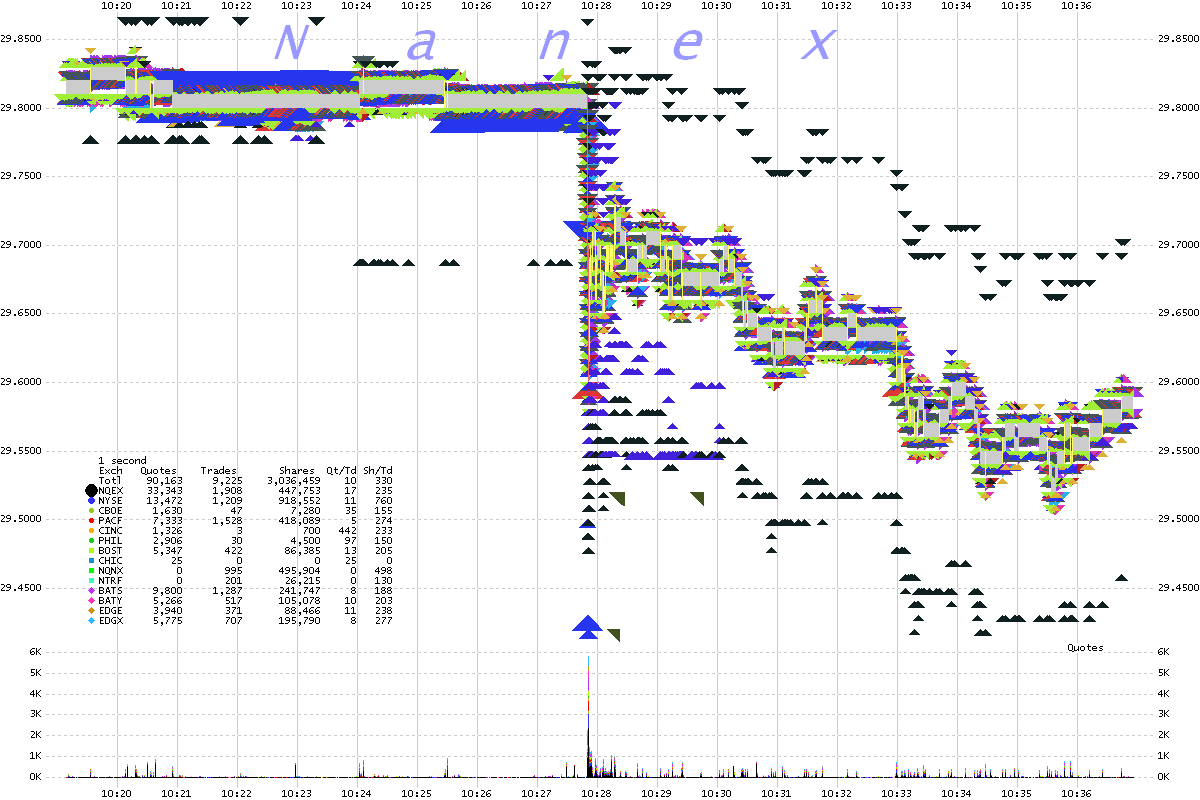
August 27, 2012 at 10:27:50.900 Citigroup (symbol C) dropped 1.3% (from 29.80 to 29.42)
in about 100 milliseconds.
1. One second interval chart showing trades color coded by exchange.

2. One second interval chart showing best bids and offers color coded by exchange.

3. One second interval chart showing all bids and offers color coded by exchange.

The following set of 18 charts shows trades and bid/ask spreads for one or more reporting
exchanges. Some charts show just ISO trades or non-ISO trades, or both as indicated
in the legend. ISO trades are color filled, while all other trade conditions are empty
(white). Note in the first chart, trades from NY-ARCA (red) began dropping about 20ms
before NYSE (blue) where the price fell apart.
Nanex Research
Inquiries:pr@nanex.net


