 Nanex Research
Nanex ~ 30-Aug-2012 ~ Mindless Chatter
The SEC has stated on more than one occasion that it isn't worth the effort to look
at data in resolutions under one second, because it's just noise. Follow us "down the
rabbit hole" as we drill down from 1 second to 1/1000th of a second and see what we
find. Note: this is a continuation from
this page.
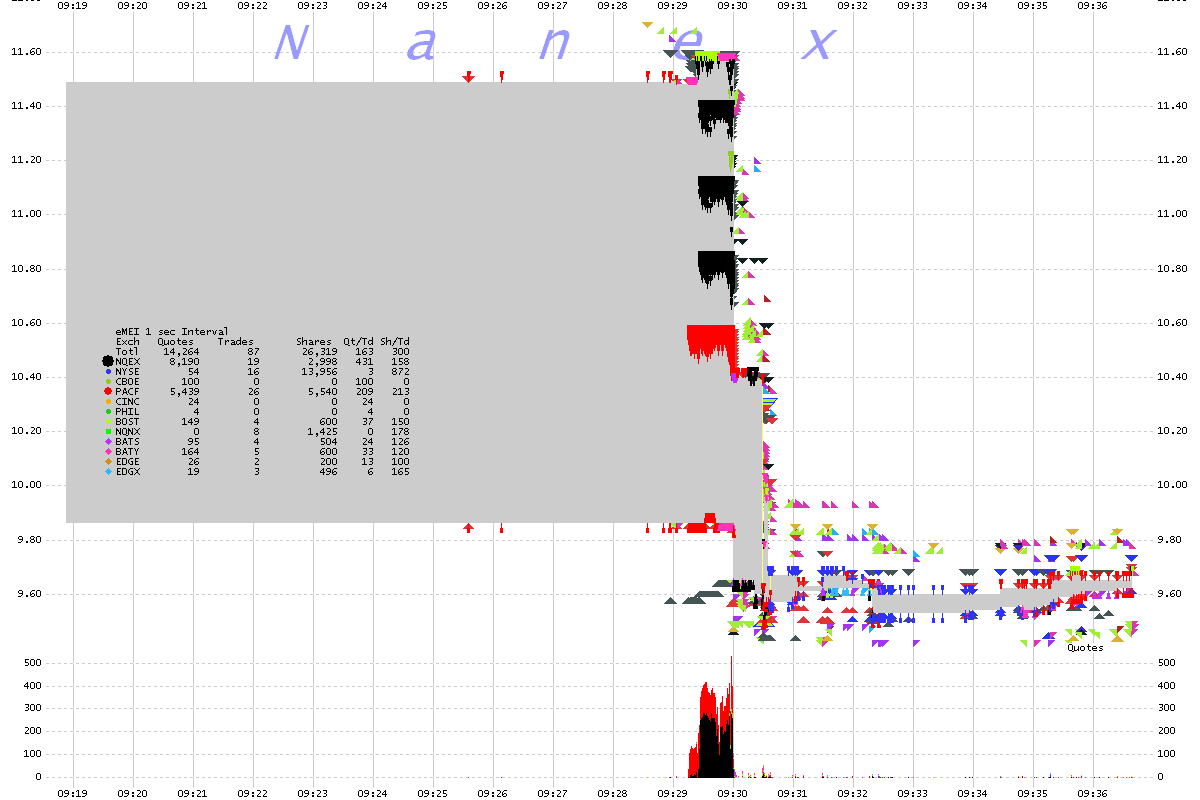
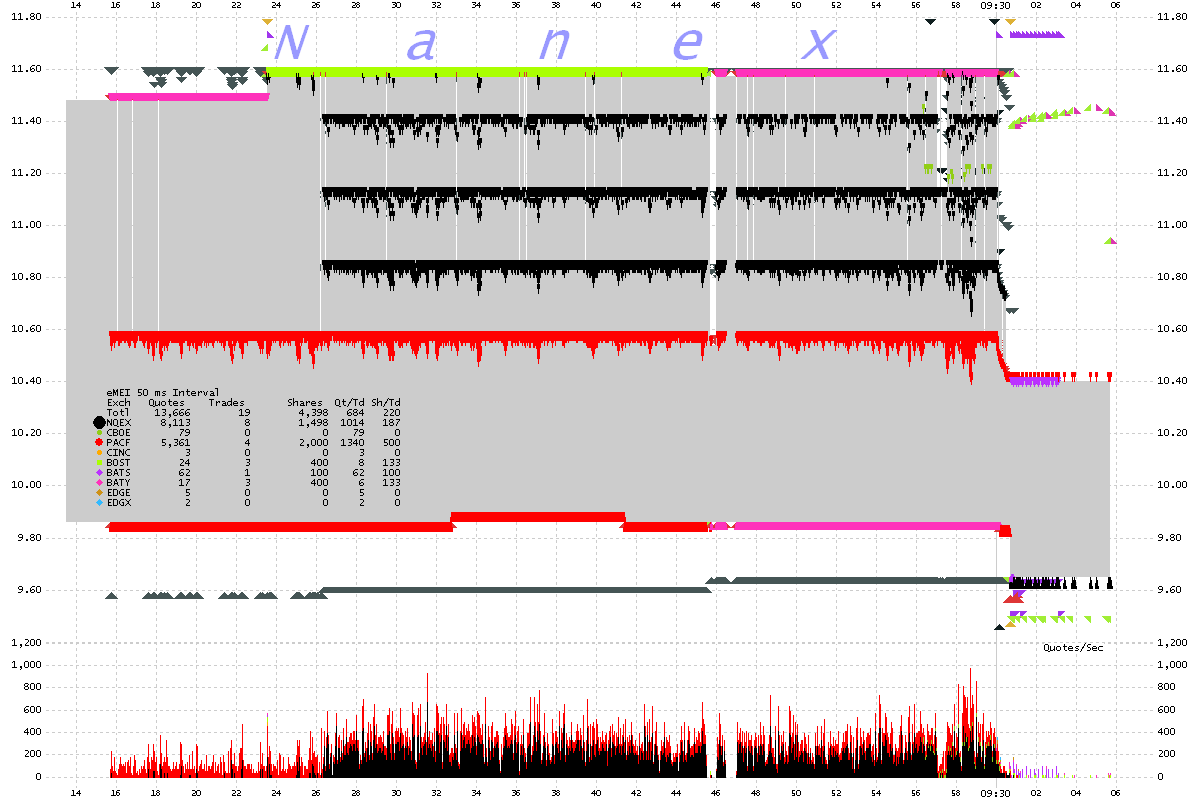
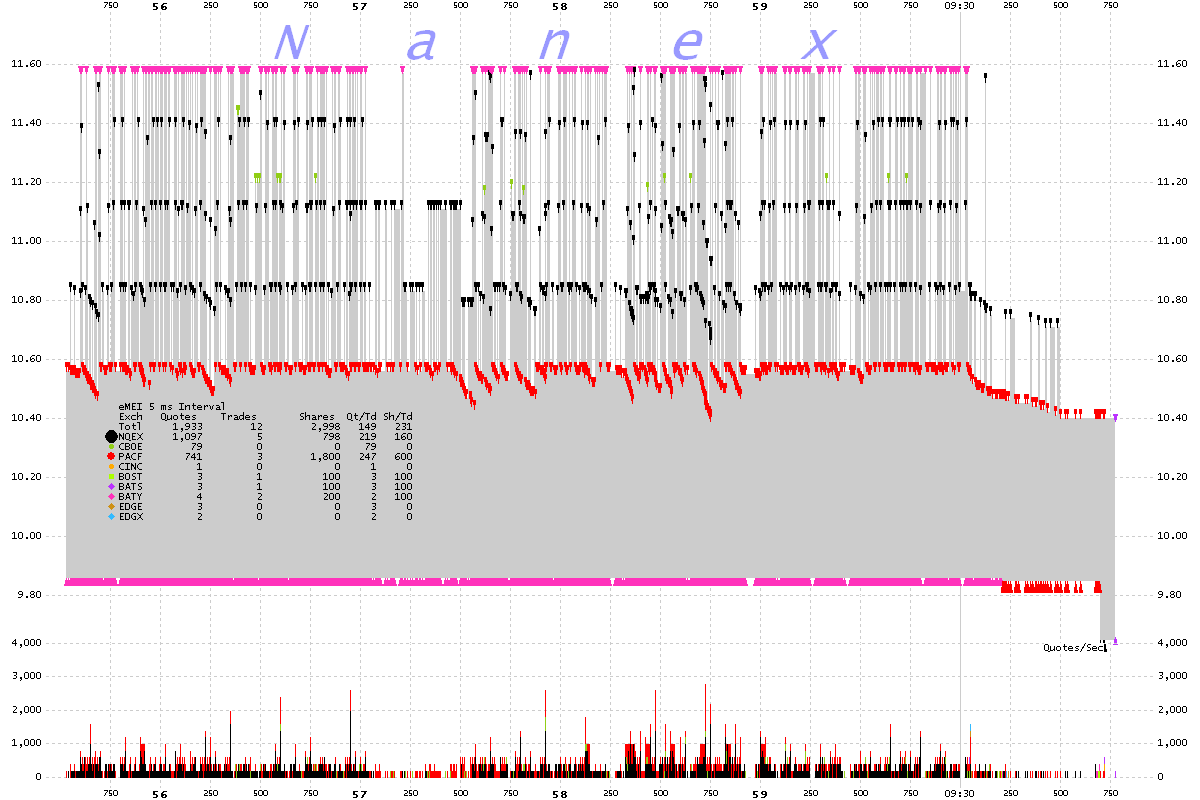
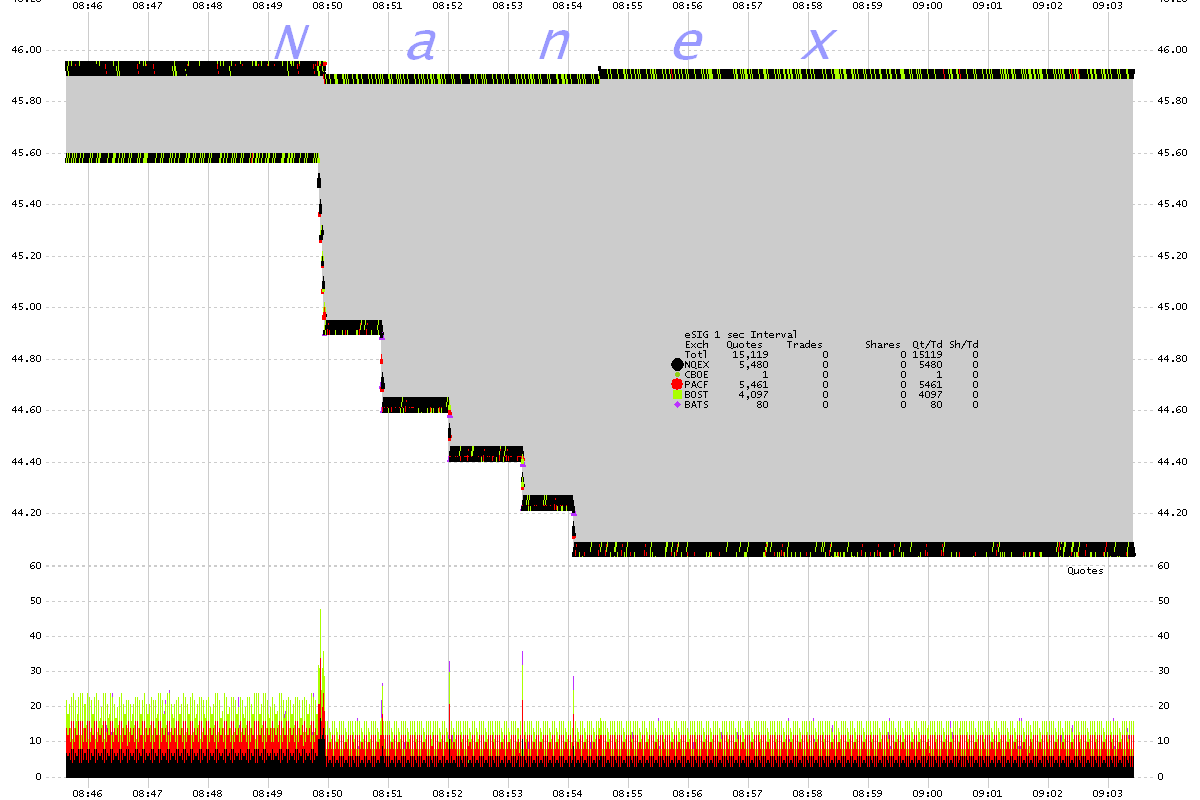
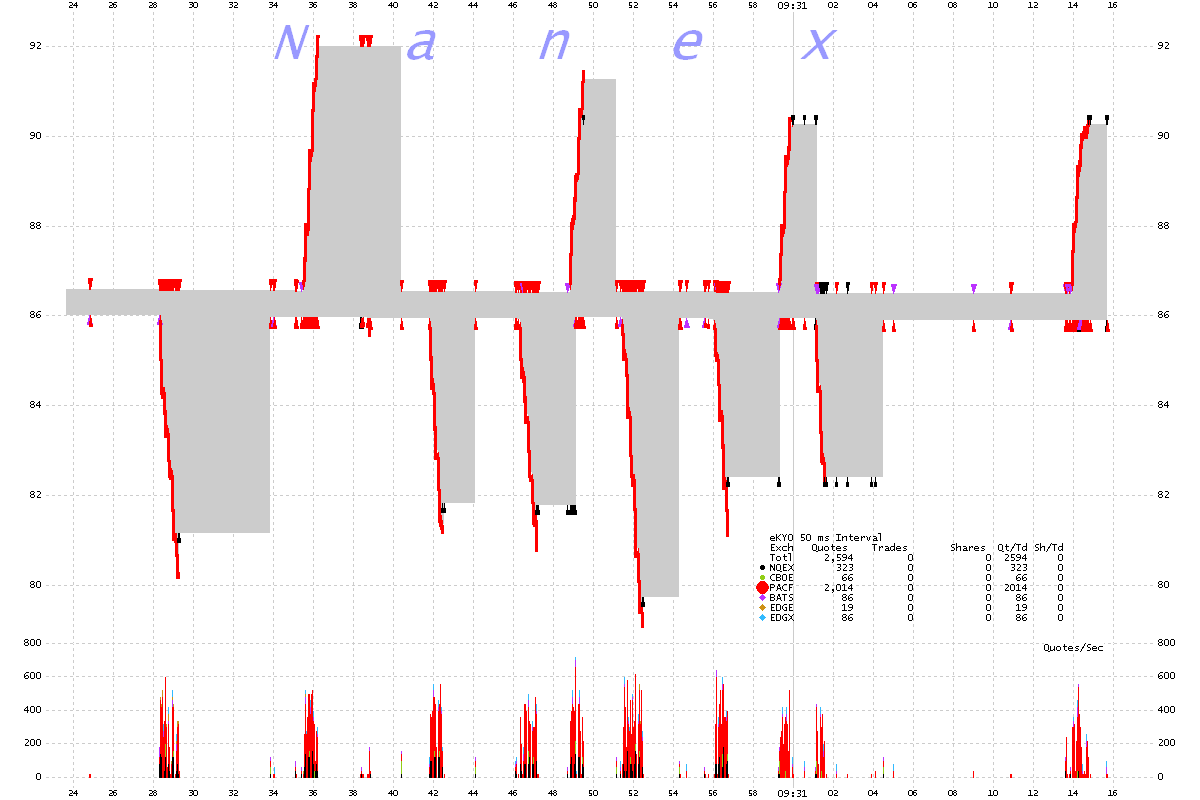
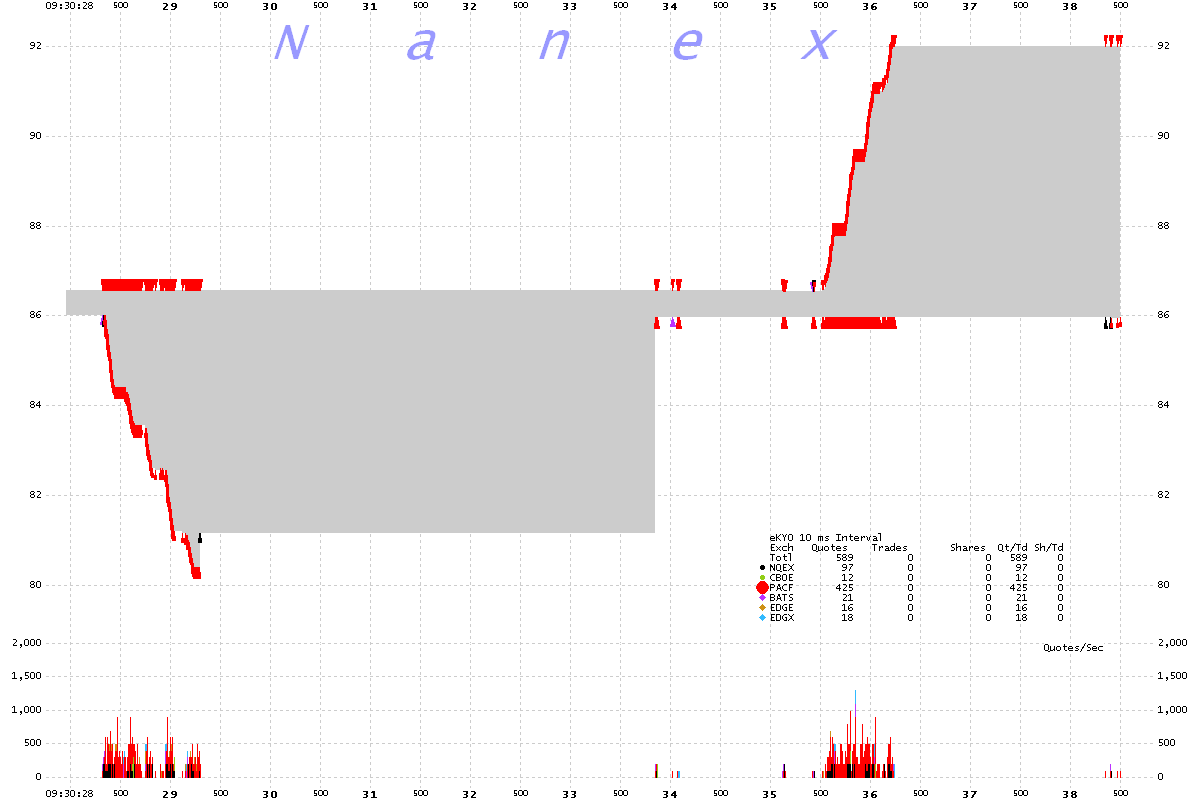
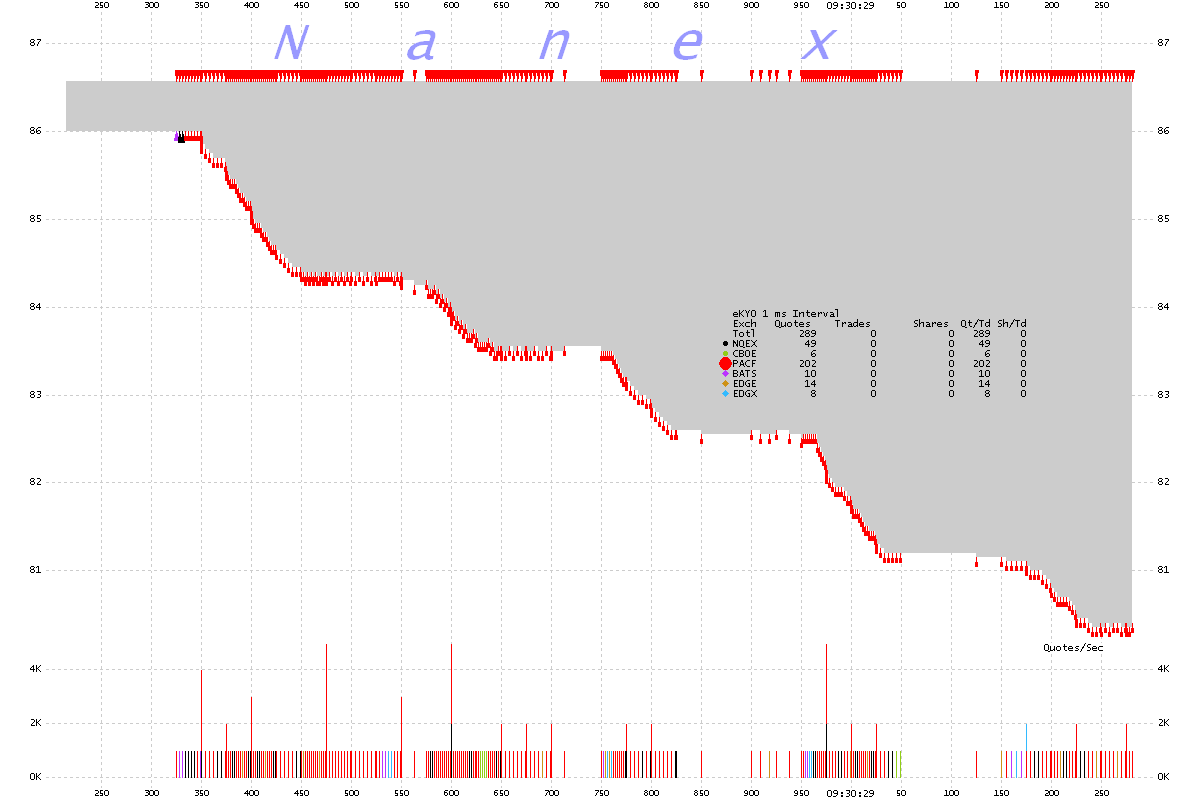
Each chart shows the National Best Bid/Offer spread (NBBO) as gray shading. The top
of the shading is the best ask, and the bottom is the best bid. Bids and offers
are shown as triangles color coded by exchange. Triangles pointing up represent
bids, triangles pointing down represent offers.
1. MEI 1 second interval
2. MEI 50 millisecond interval
3. MEI 5 millisecond interval
4. SIG 1 second interval
5. SIG 1 second interval
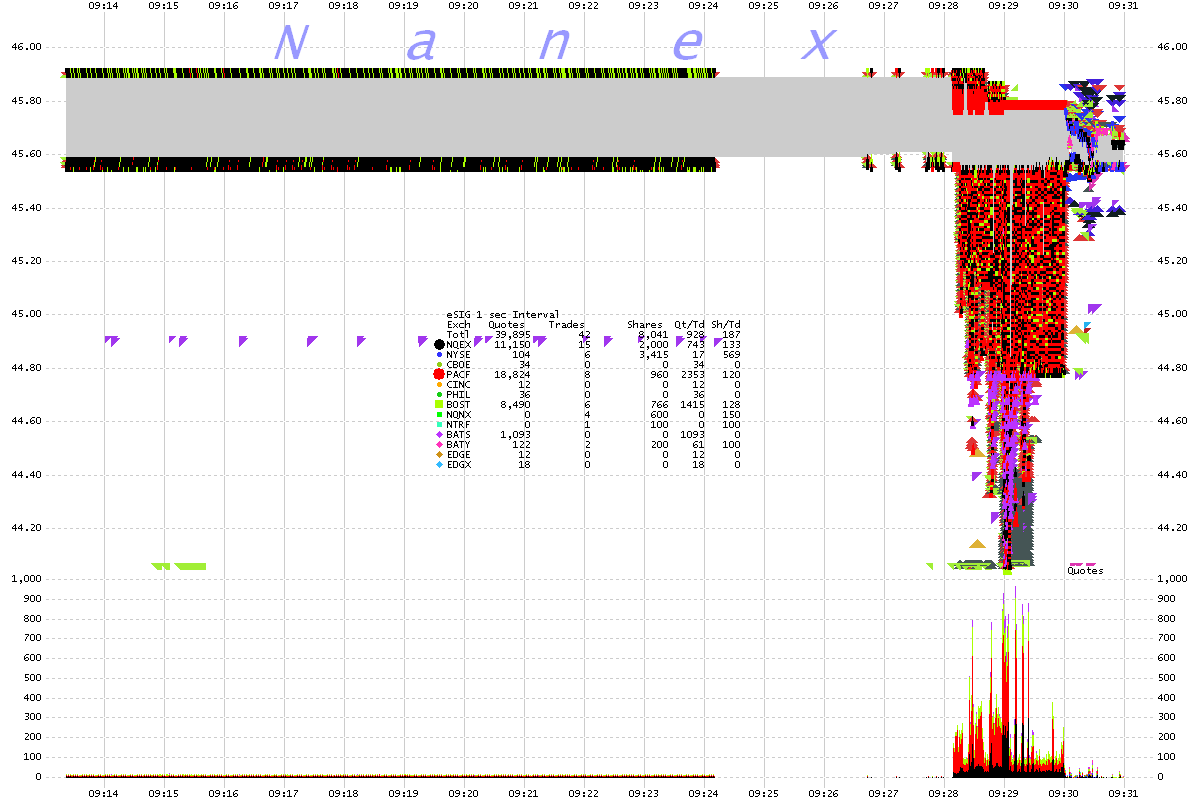
6. SIG 100 millisecond interval
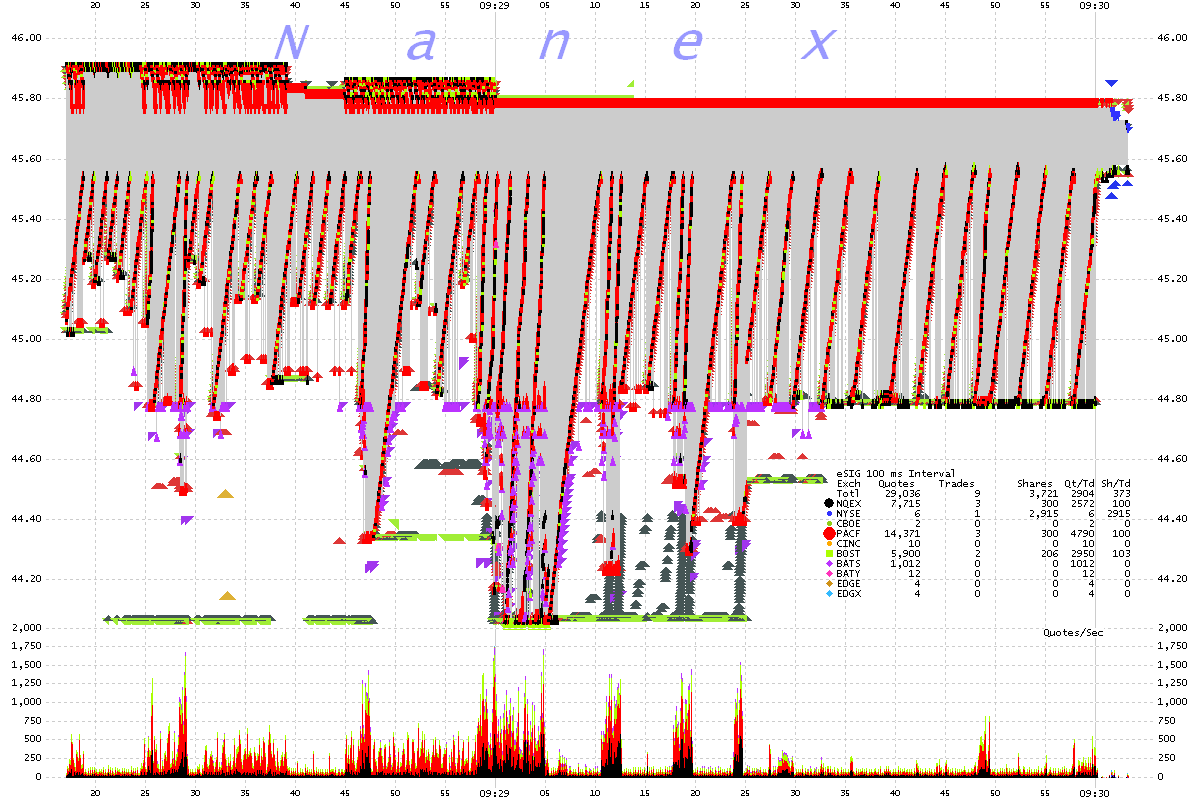
7. SIG 25 millisecond interval
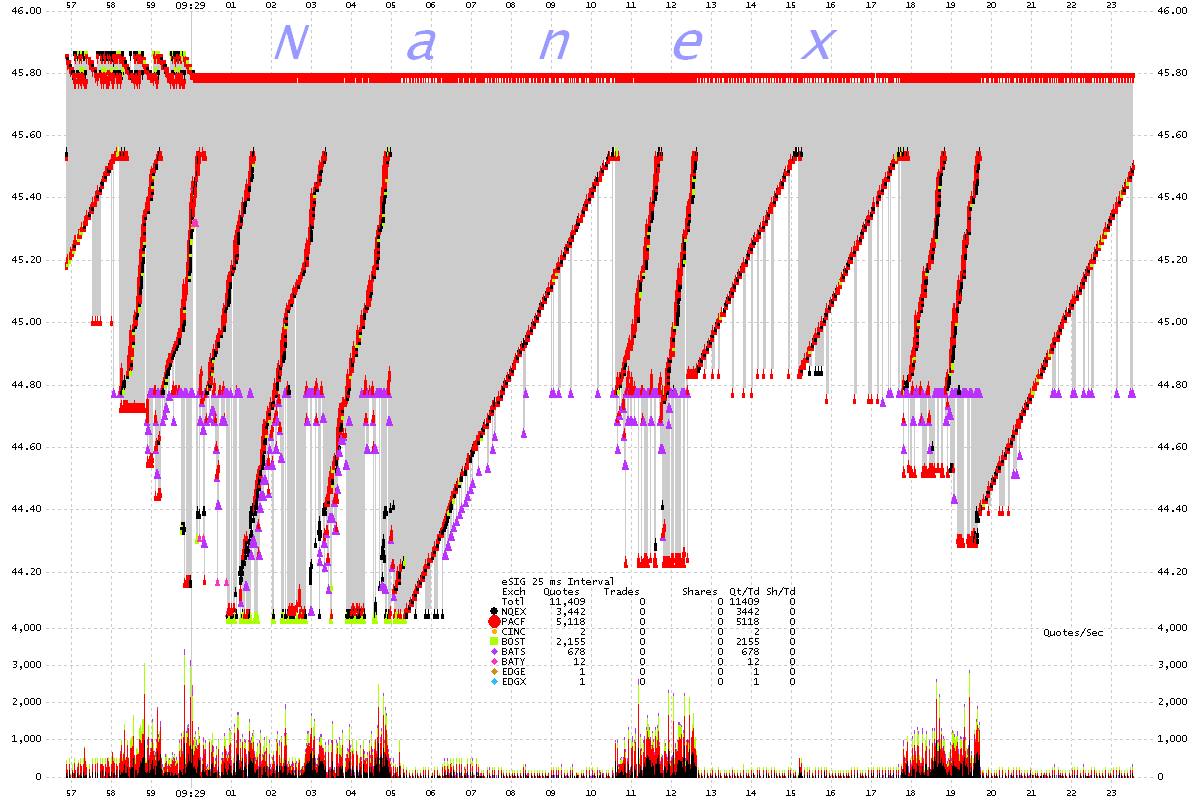
8. HSH 1 second interval
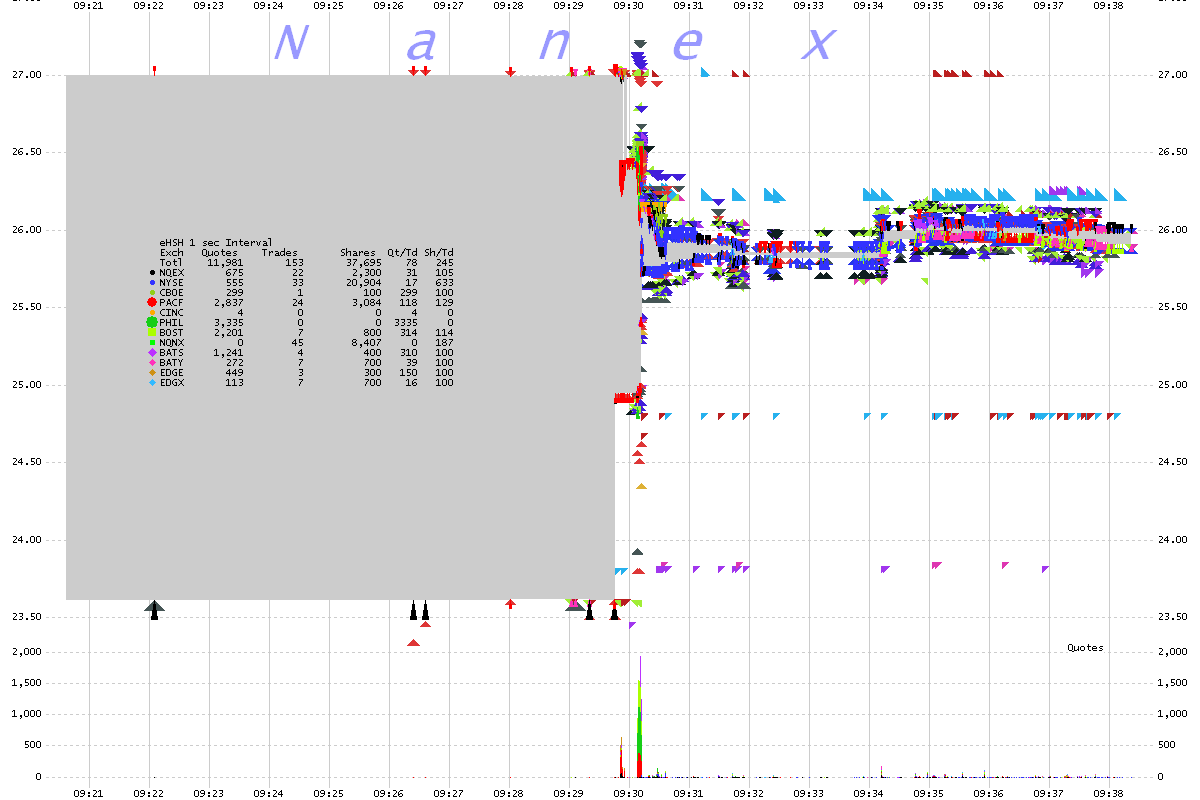
9. HSH 100 millisecond interval
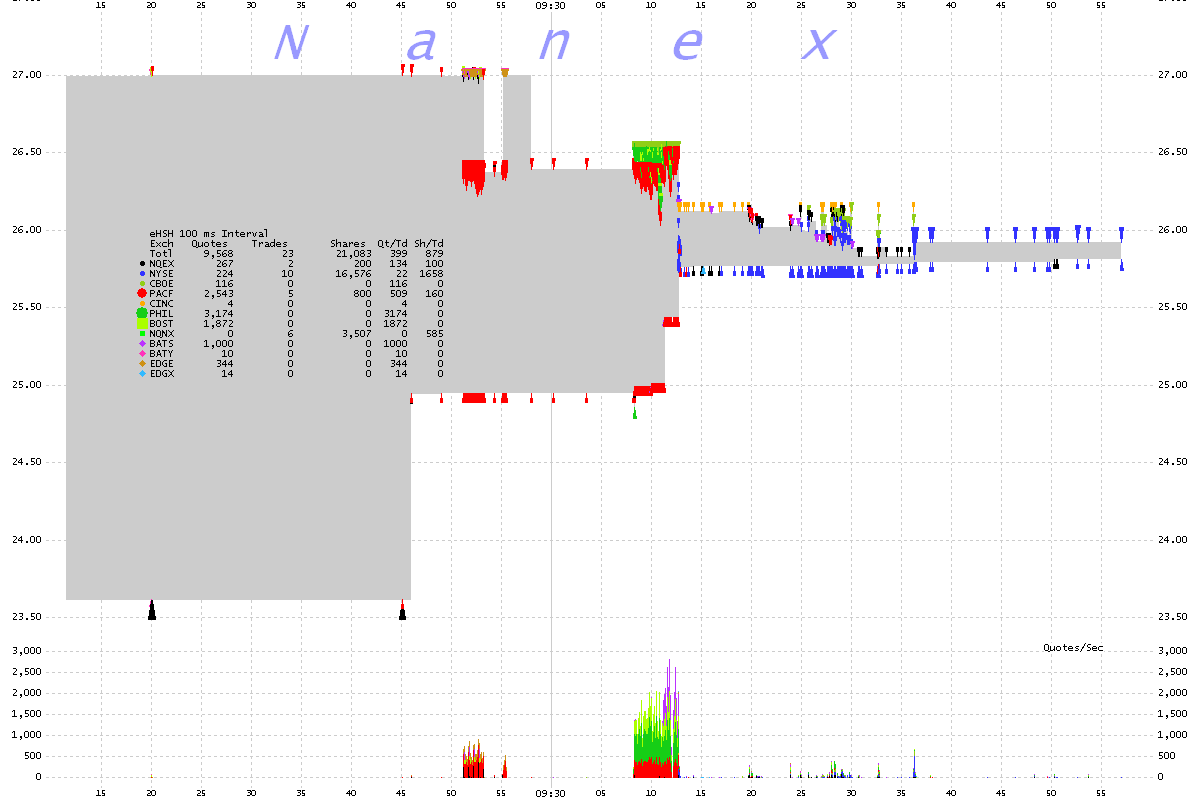
10. HSH 25 millisecond interval
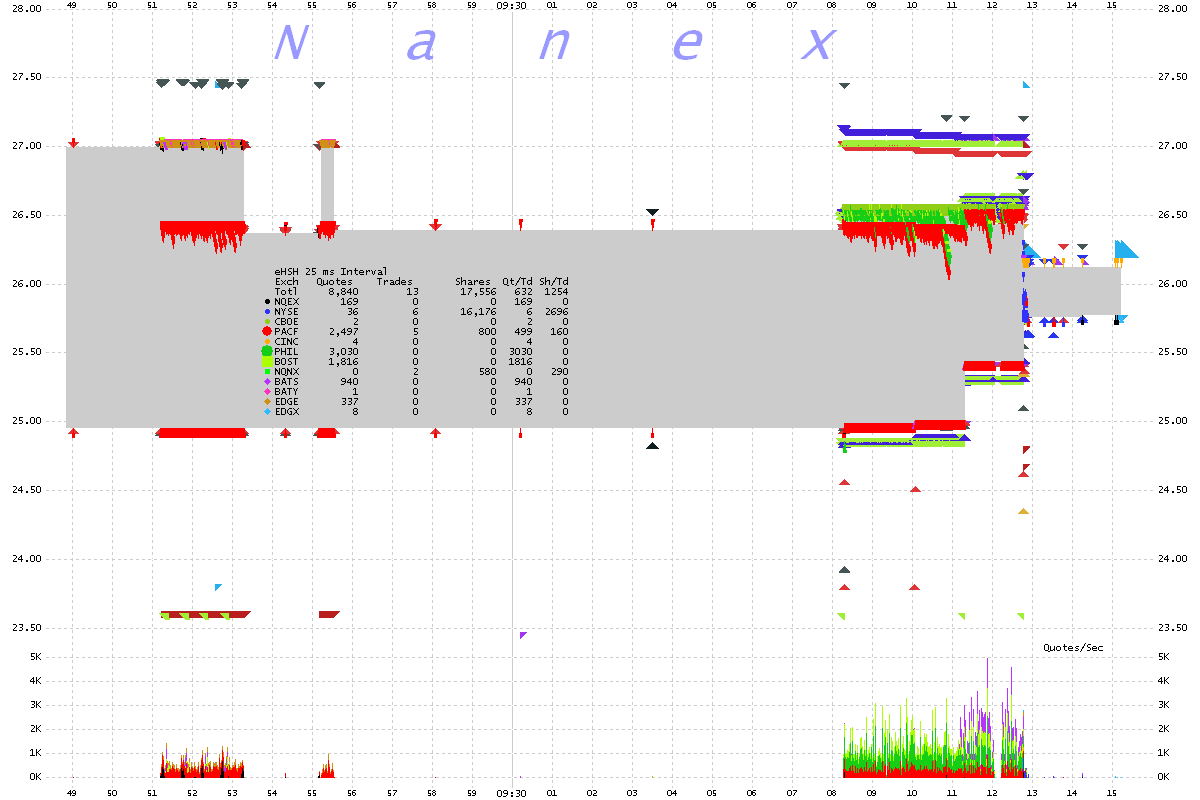
11. HSH 1 millisecond interval
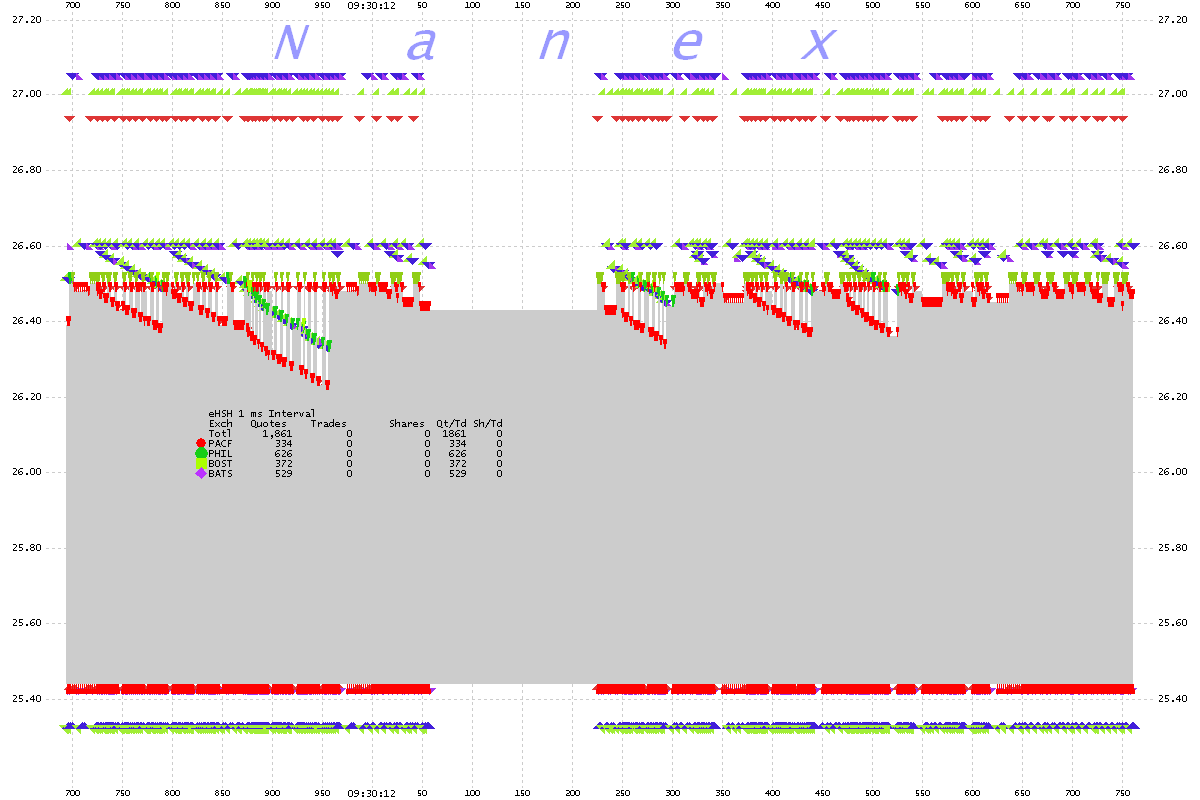
12. KYO 1 second interval
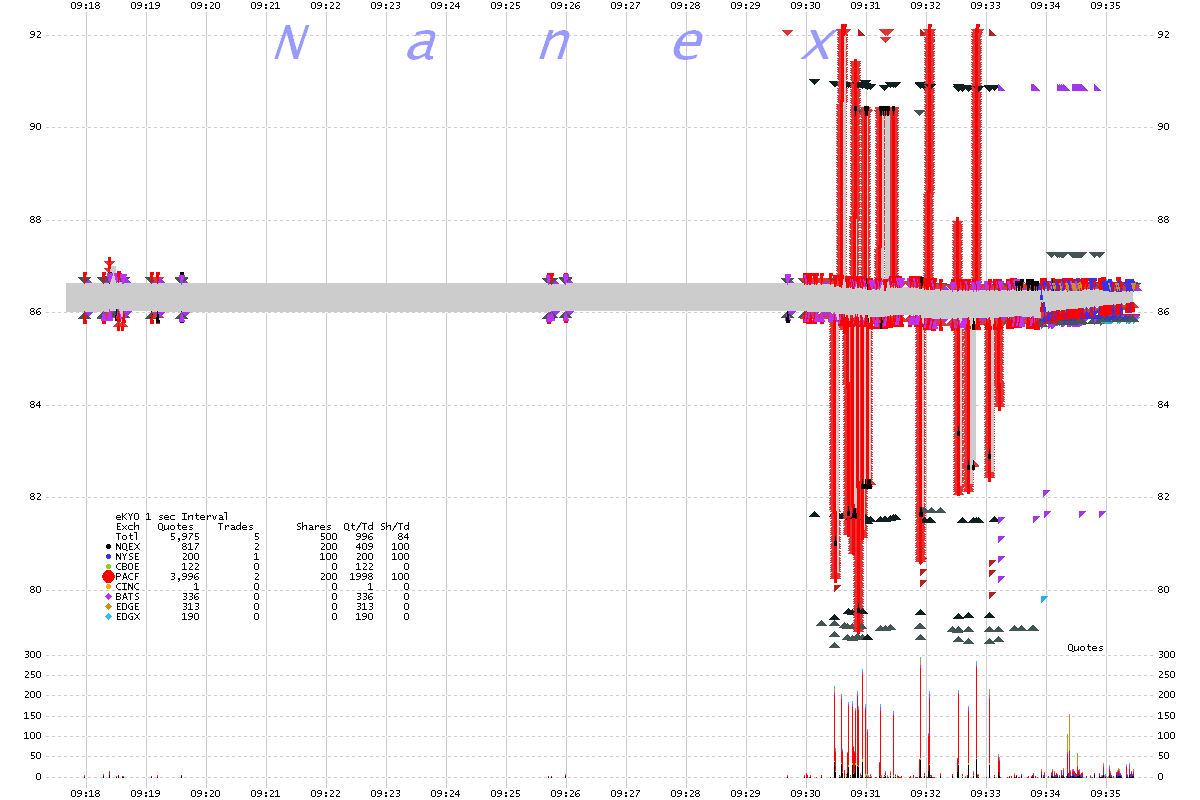
13. KYO 50 millisecond interval
14. KYO 10 millisecond interval
15. KYO 1 millisecond interval
Nanex Research
Inquiries: pr@nanex.net
 Nanex Research


