 Nanex Research
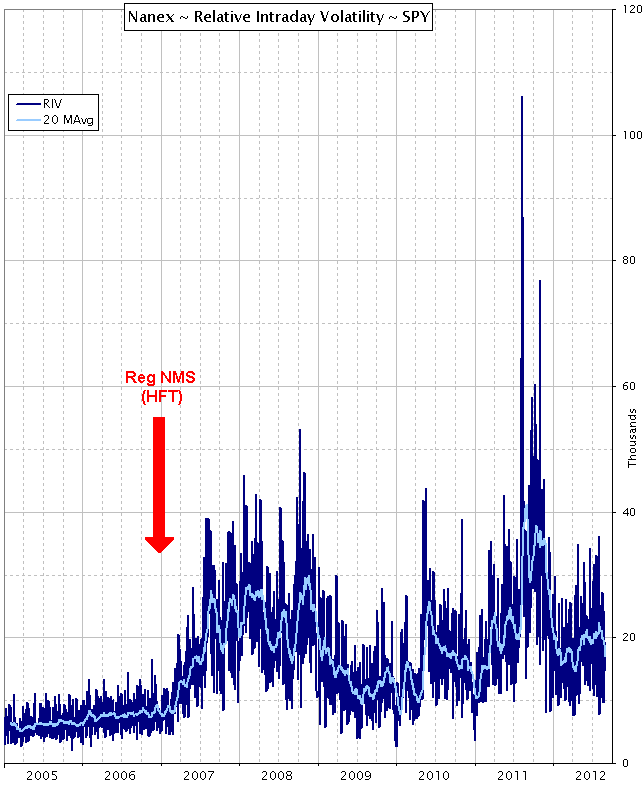
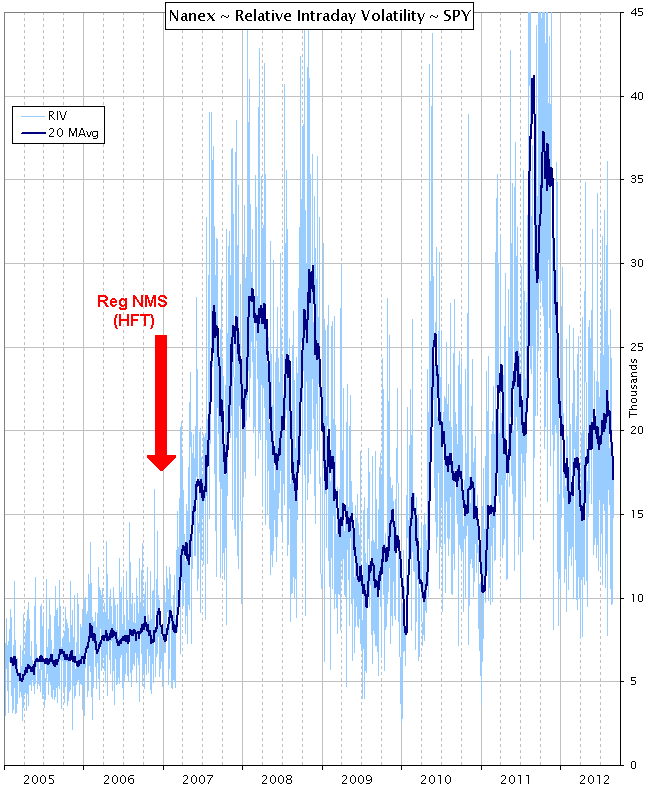
| 1. SPY Relative Intraday Volatility from January 2005 through August 30, 2012. | 2. Same as Chart 1, but scaled to the 20 period moving average to show detail. |
|
|
|
|
3. Apple (AAPL). Similar to SPY, volatility explodes after 2007. 
4. IBM. Similar to SPY, volatility explodes after 2007. 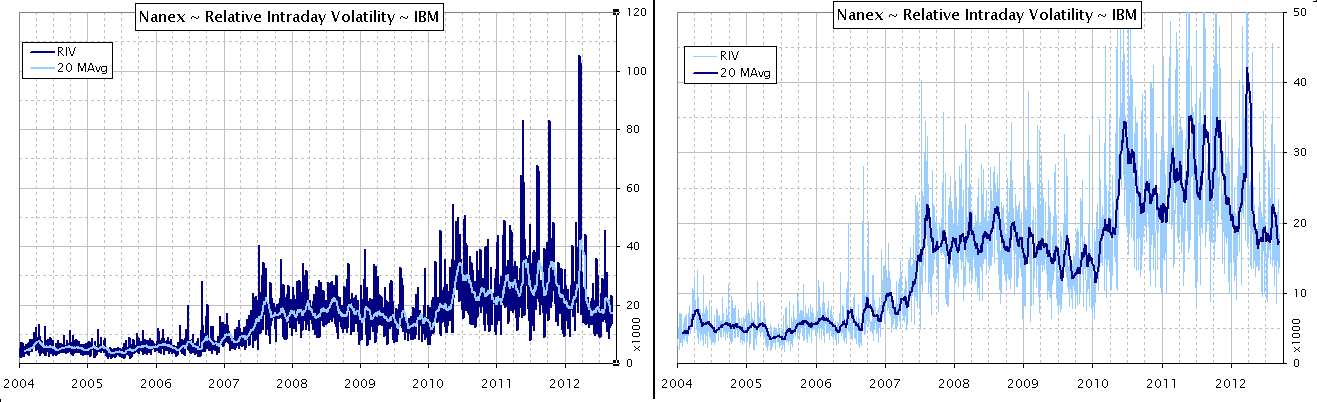
5. Berkshire Class A (BRK.A). Surpisingly, Berkshire Hathaway, an extremely high priced stock, experiences significantly higher intraday volatility.. 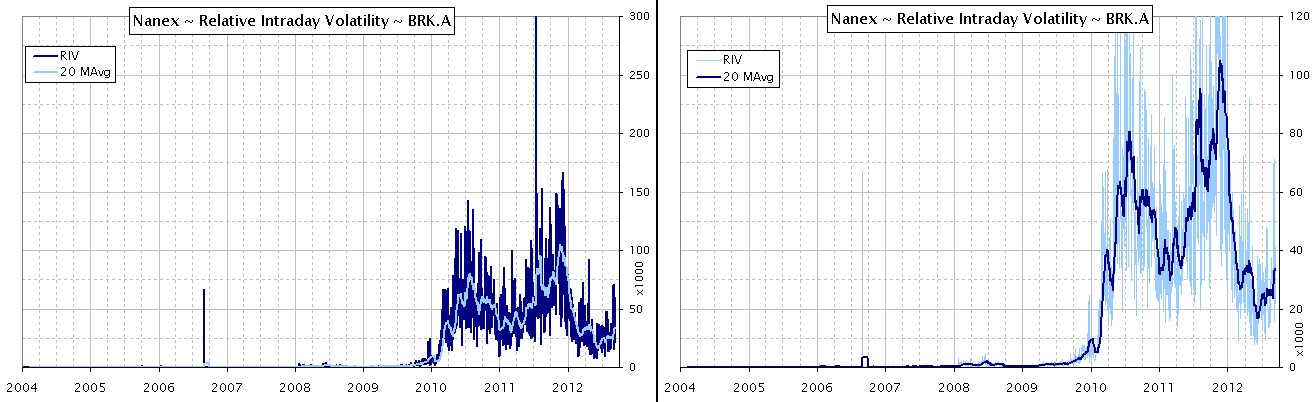
6. Berkshire Class B (BRK.B). Somewhat similar to Berkshire Class A but with a lower peak in 2010. Note that BRK.B split 50 for 1 in early 2010, which didn't seem to make a difference. 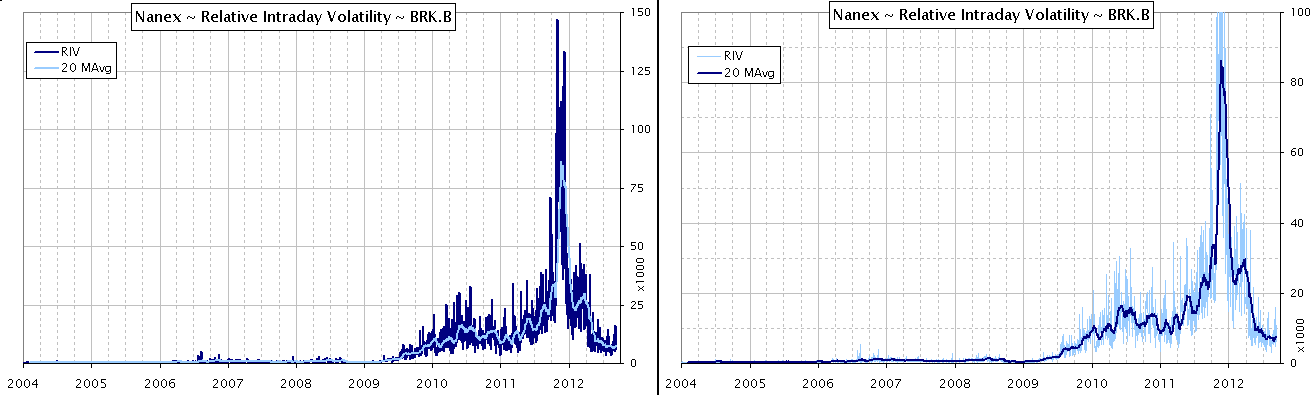
7. Microsoft (MSFT). Curiously, the stock of Microsoft does not follow the same pattern of higher volatility as the stocks shown above. 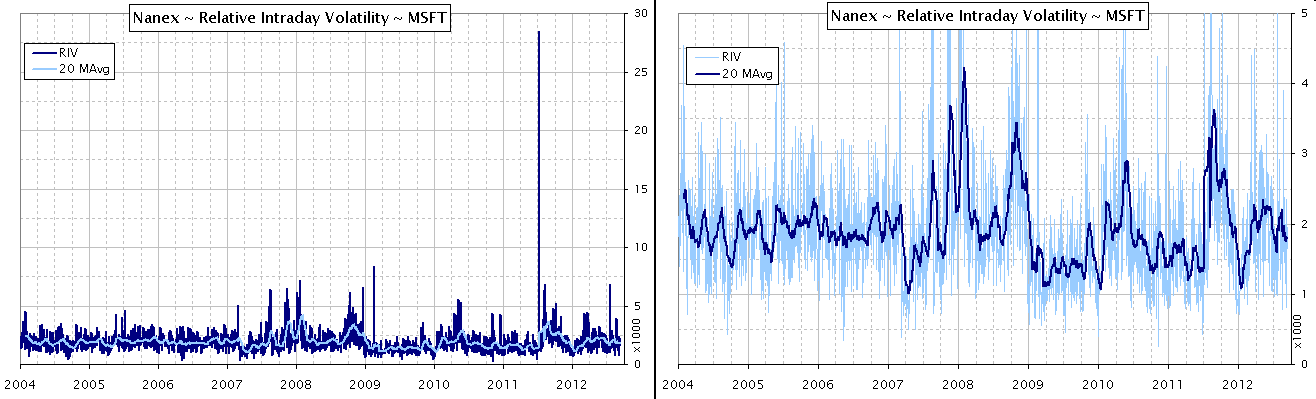
|