 Nanex Research
Nanex ~ 31-Aug-2012 ~ Whac-A-Mole in SPY
Whac-a-mole
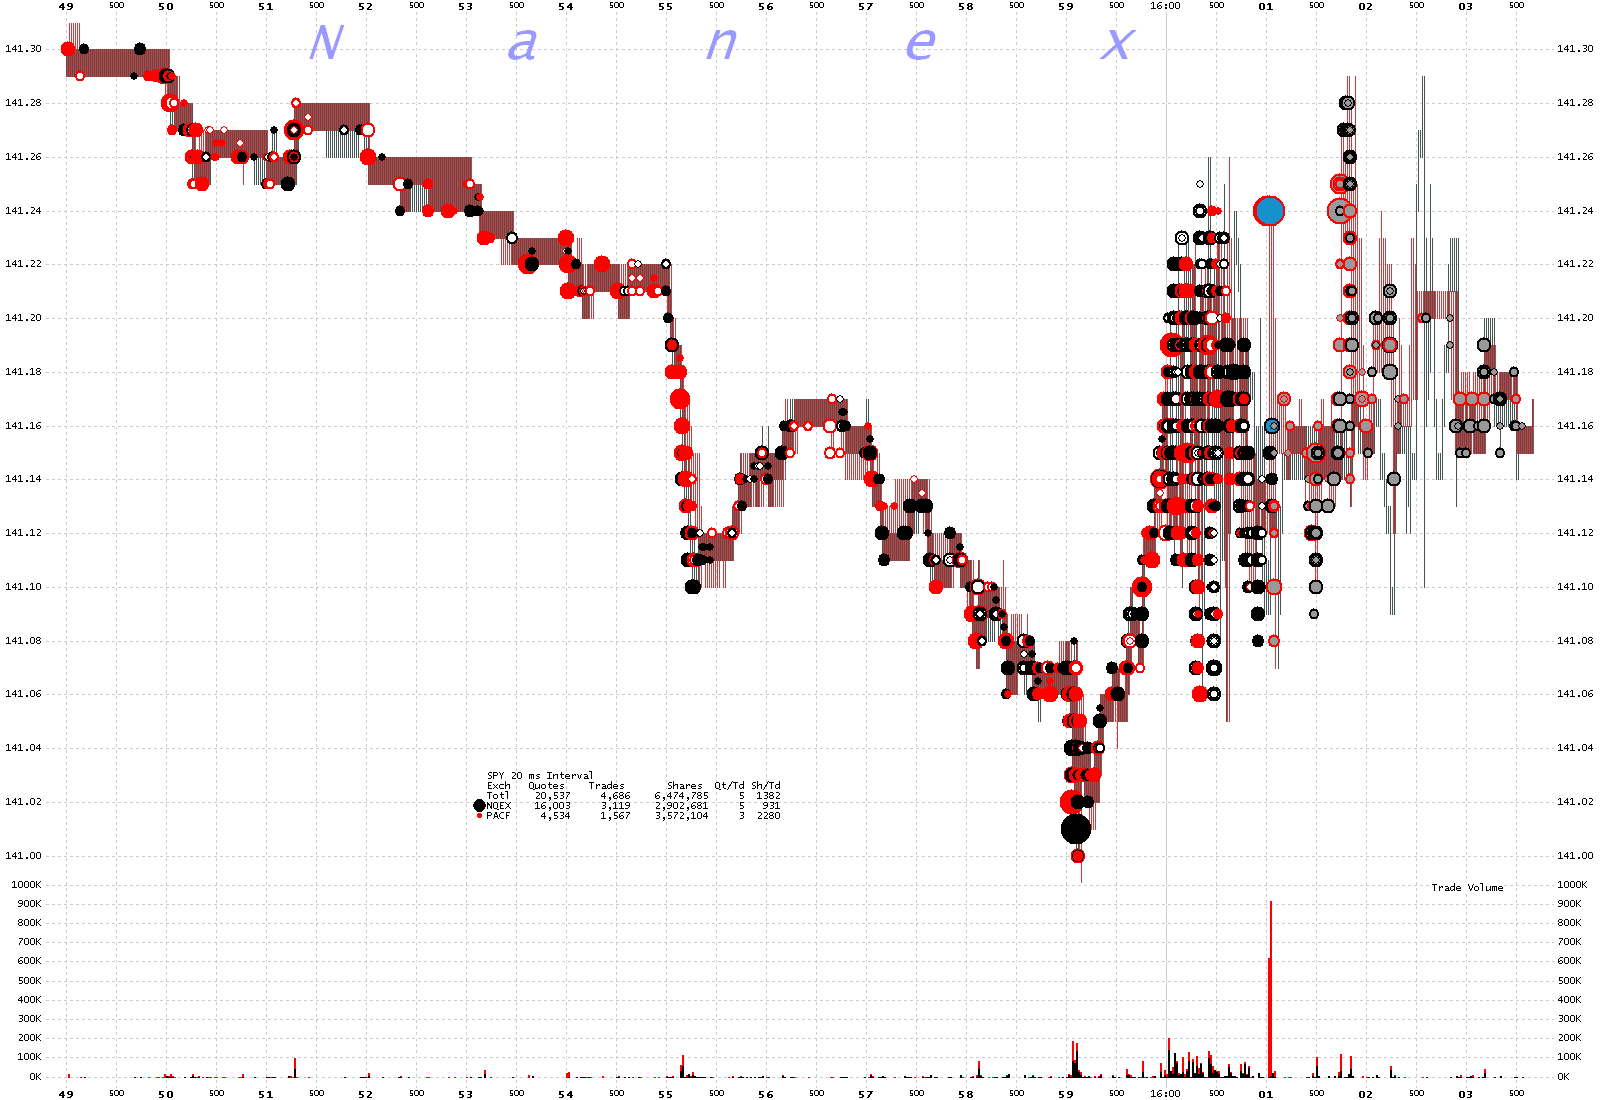
in SPY at the close on August 31, 2012. About as much trading data (quotes and trades)
that would fit in 2 seconds of pipe, was blasted through the exchange networks in the
last millisecond of the day. We estimate about $1 billion of SPY and 75,000 eMini contracts
traded. The wild oscillations that
are shown on the chart between 16:00:00 and 16:00:02
actually happened in the last millisecond of the trading session. Why the trades oscillate
like that, we'll never know, but it has the strong odor of manipulation. And this event
has happened before.
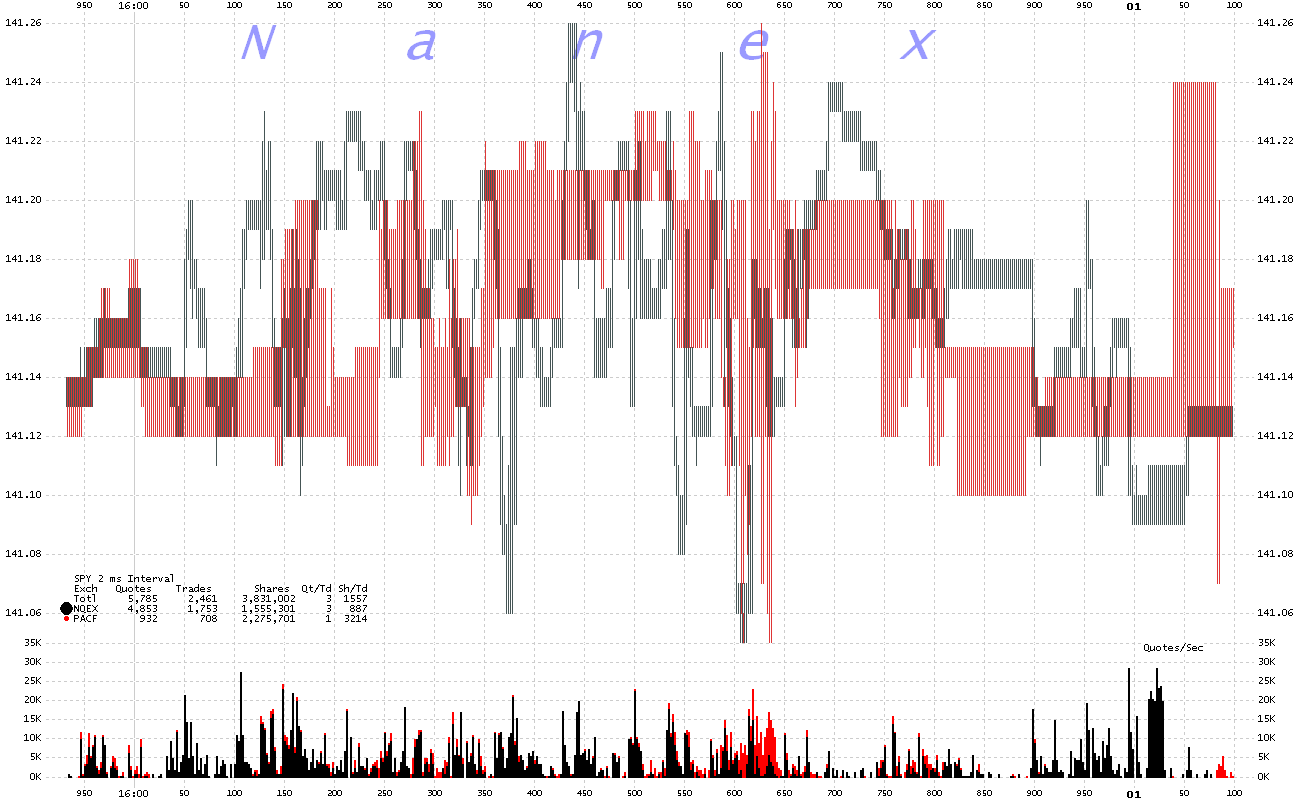
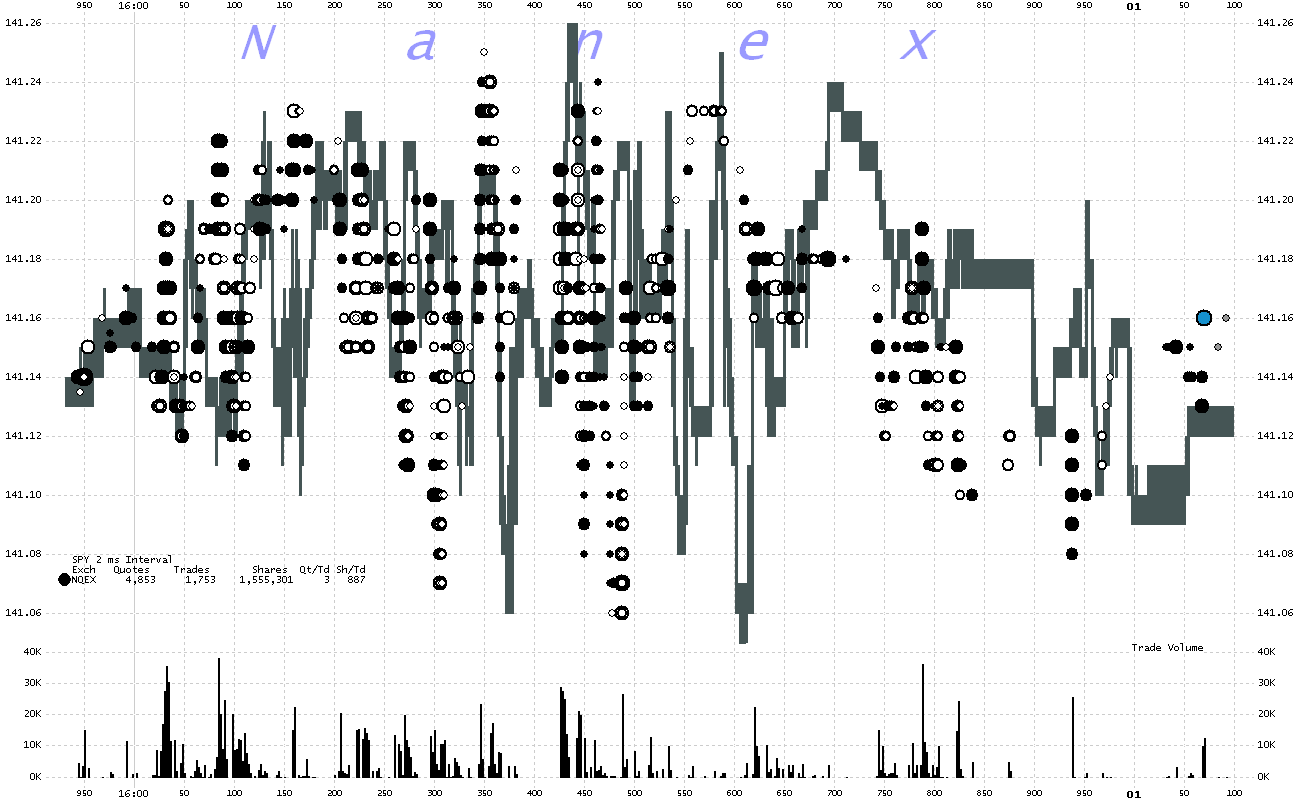
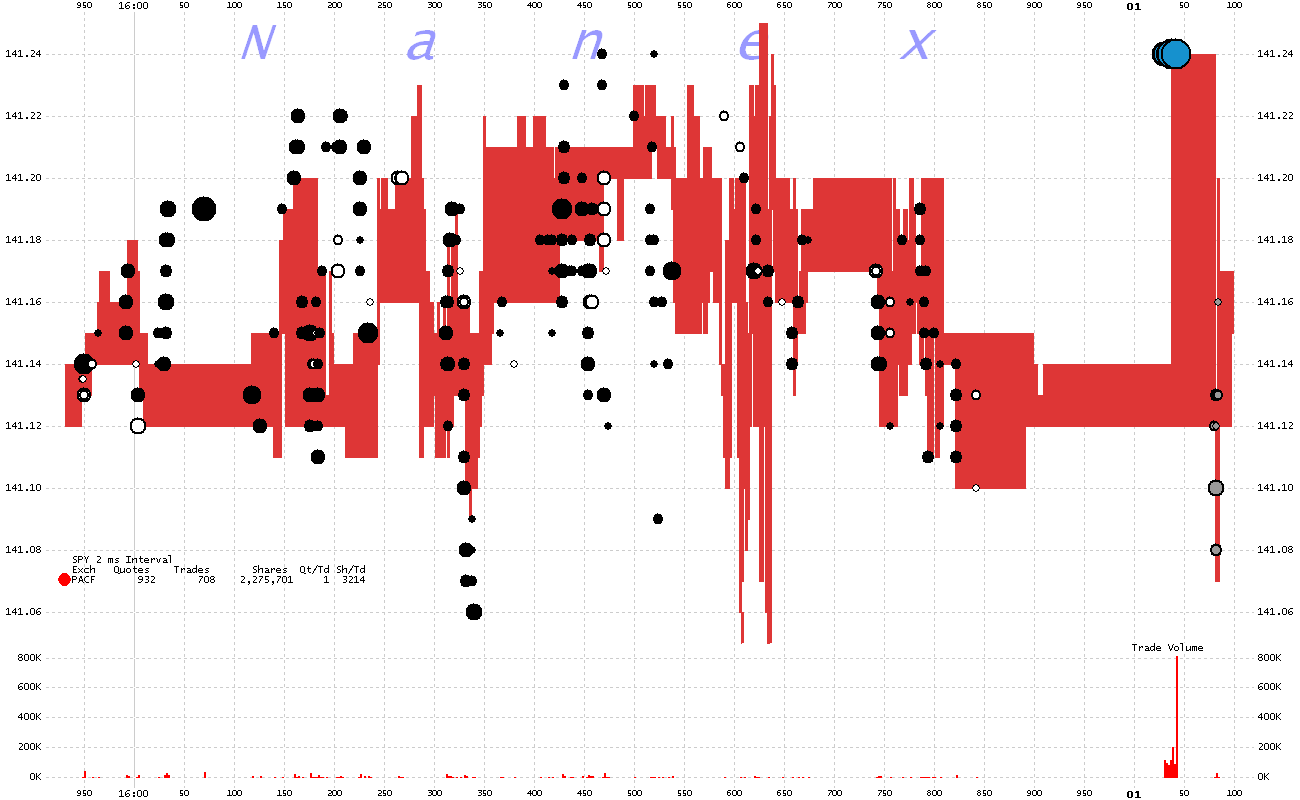
Charts below show the bid/ask spread (shaded) and trades (dots) color coded by exchange.
For clarity, not all charts show all exchanges.
1. Dear

2. SEC

3. Please

4. do

5. your

6. job

7. so

8. we

9. don't

10. have

11. to

12.

13.

18. Here you can see the stellar progress being made on
past events by our dear leader.

Nanex Research
Inquiries: pr@nanex.net
 Nanex Research


