Nanex Research

Nanex ~ 07-Sep-2012 ~ HFT Art in EME


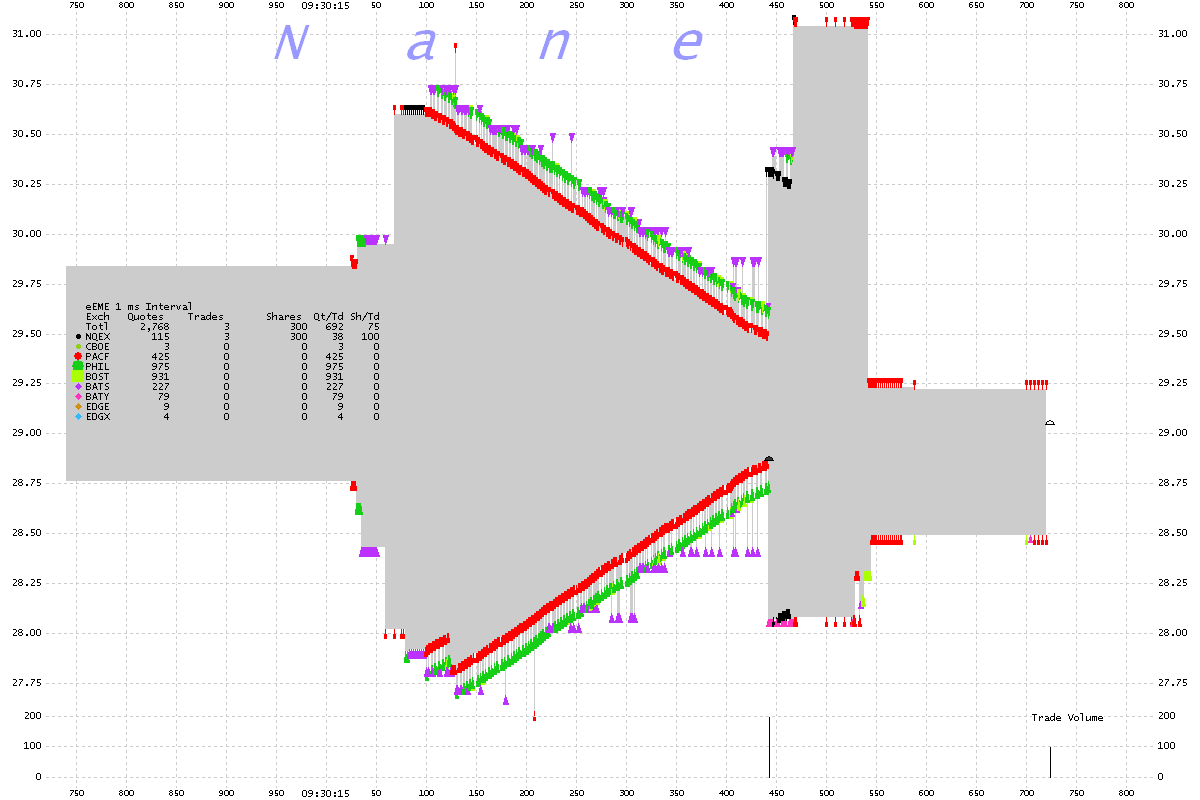
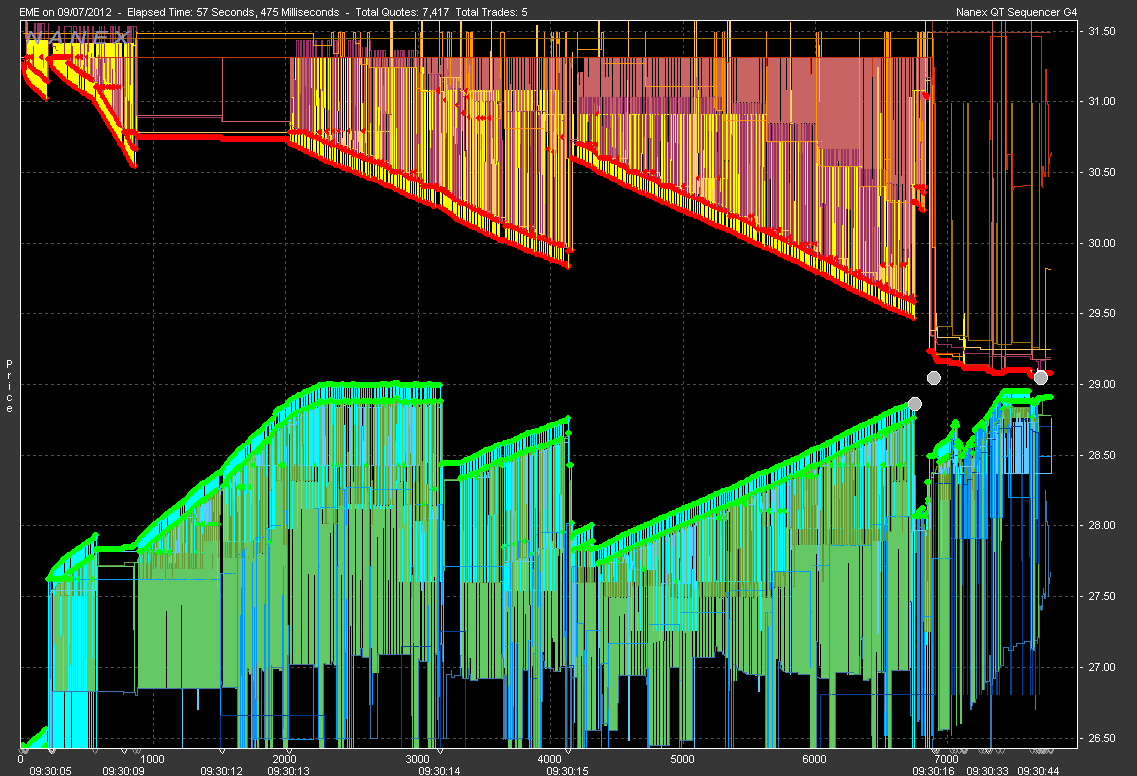
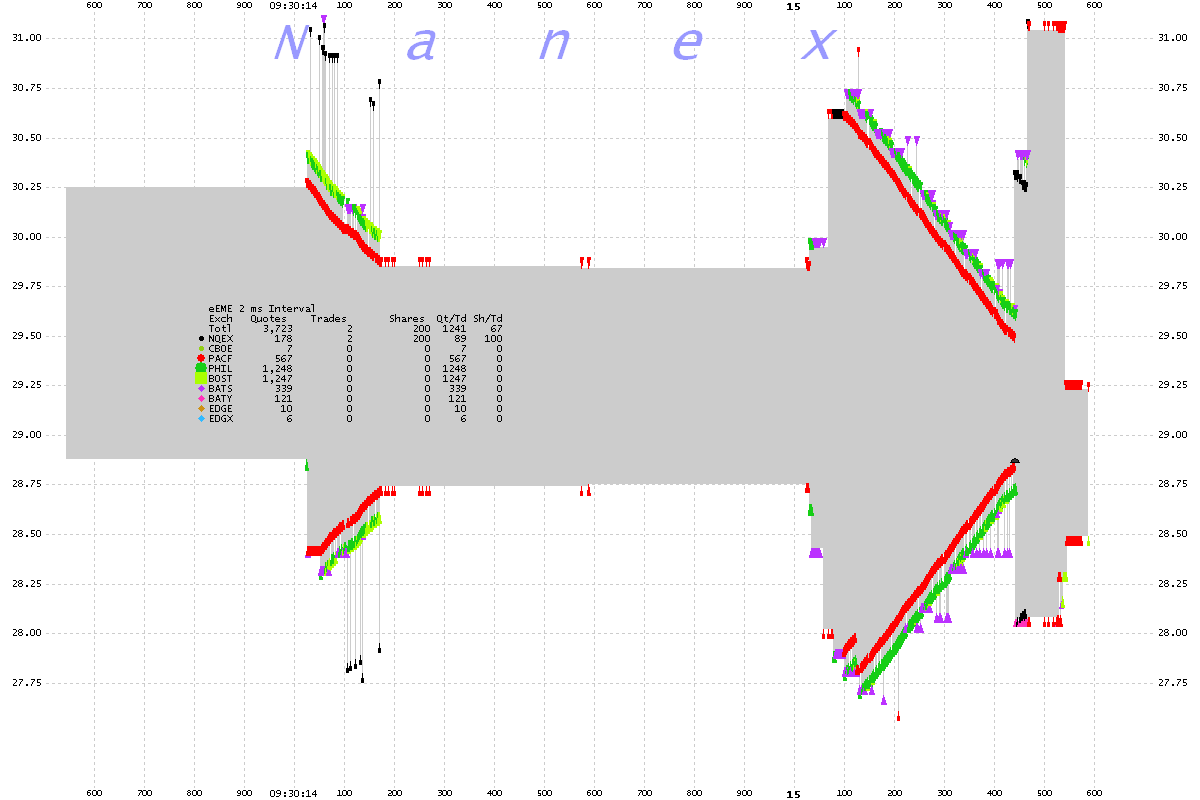
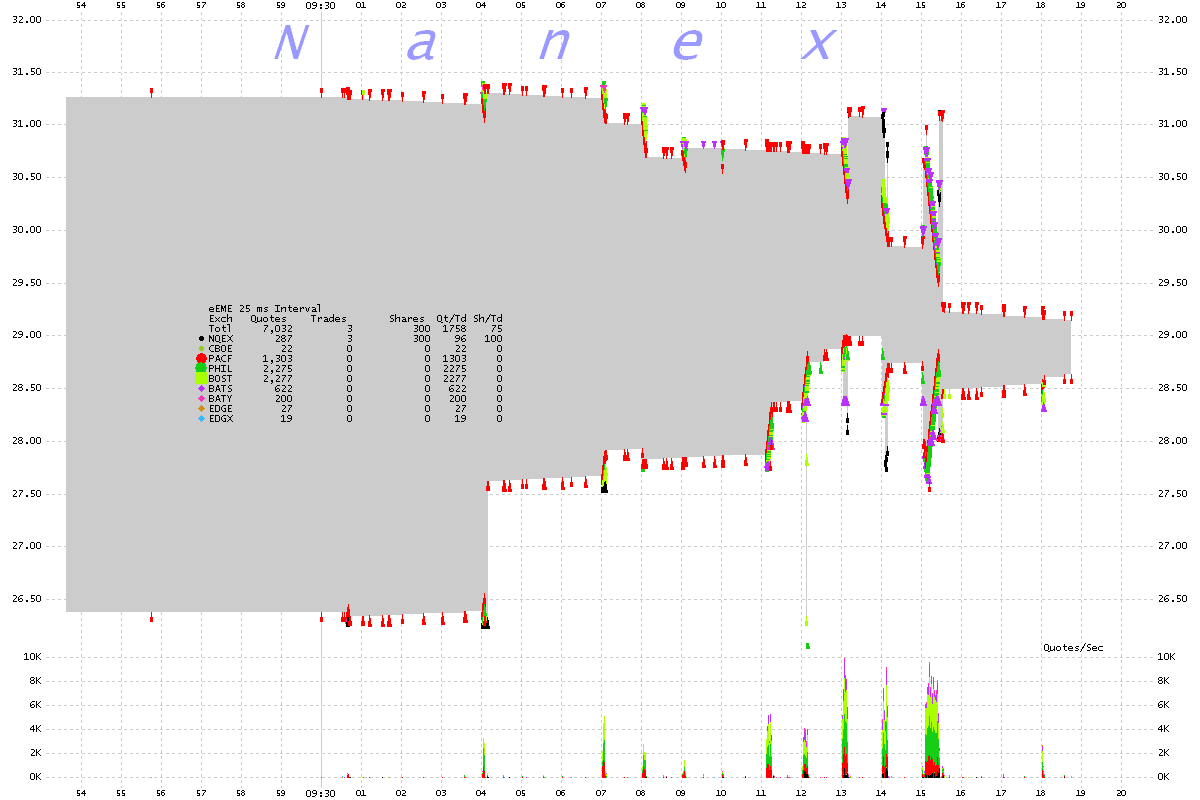
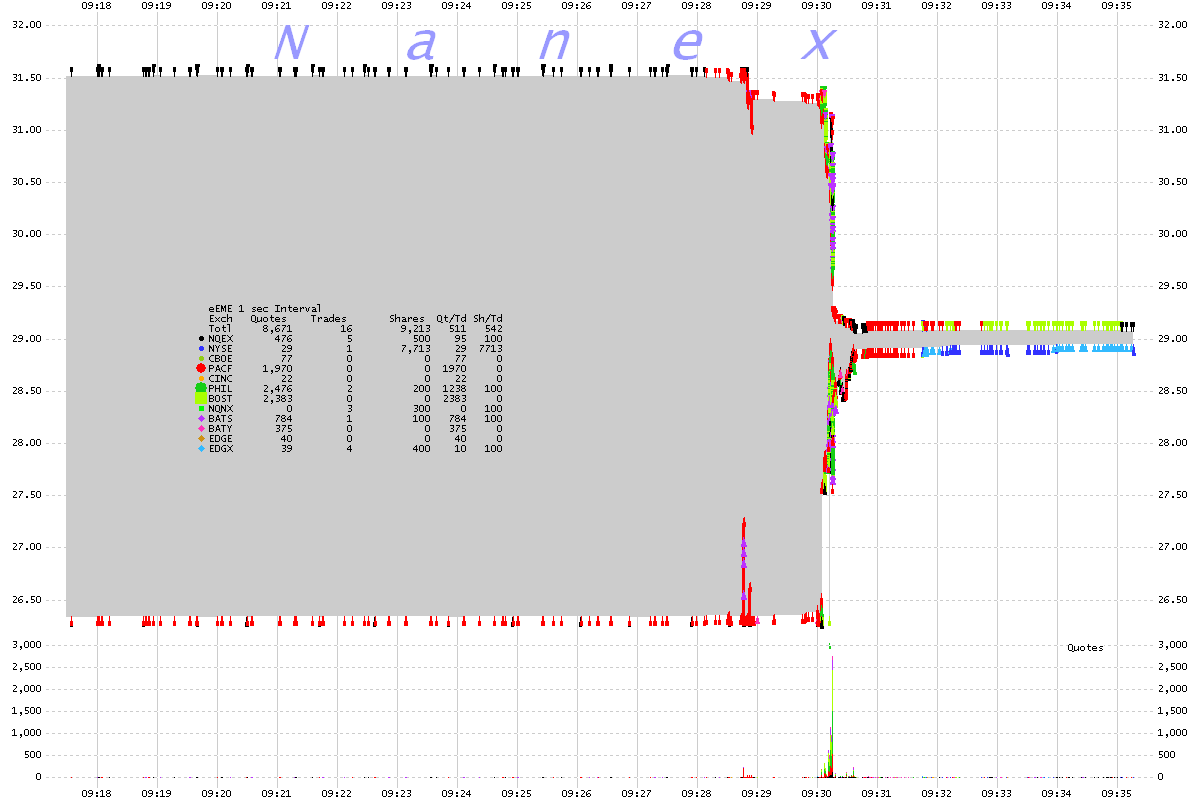
The following charts are of the stock EMCOR Group (symbol EME) right after market open on September 7, 2012. Best bids and asks are triangles color coded by exchange. The gray shaded area is the National Best Bid/Offer (NBBO).

We also mapped these quotes to piano notes and created a song:


And this is how it sounds in real-time:


1. EME 1 millisecond interval chart showing 1 second of data. 
Suggested names:


2. EME Tick Chart


3. EME 2 millisecond interval chart showing 2 seconds of data
Double Arrow

4. EME 25 millisecond interval chart showing 27 seconds of data
Notes the quote message spikes. 

5. EME 1 second interval chart
On a 1 second resolution chart, all you can see is a blur. The regulators looked mostly at 1 minute snap-shot data when analyzing the flash crash, which would be 17 samples (out of 8,687) from this chart.


Nanex Research

Inquiries: pr@nanex.net