Nanex Research

Nanex ~ 13-Sep-2012 ~ Natural Gas Front Run

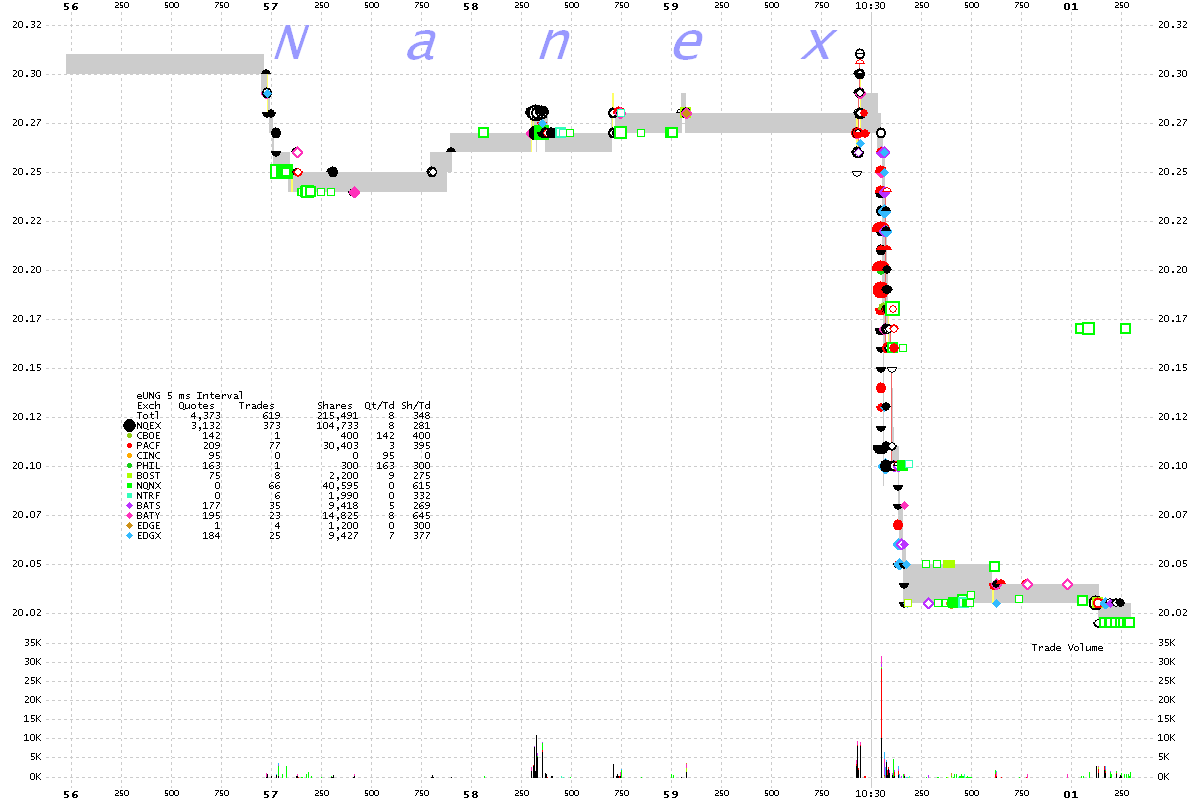
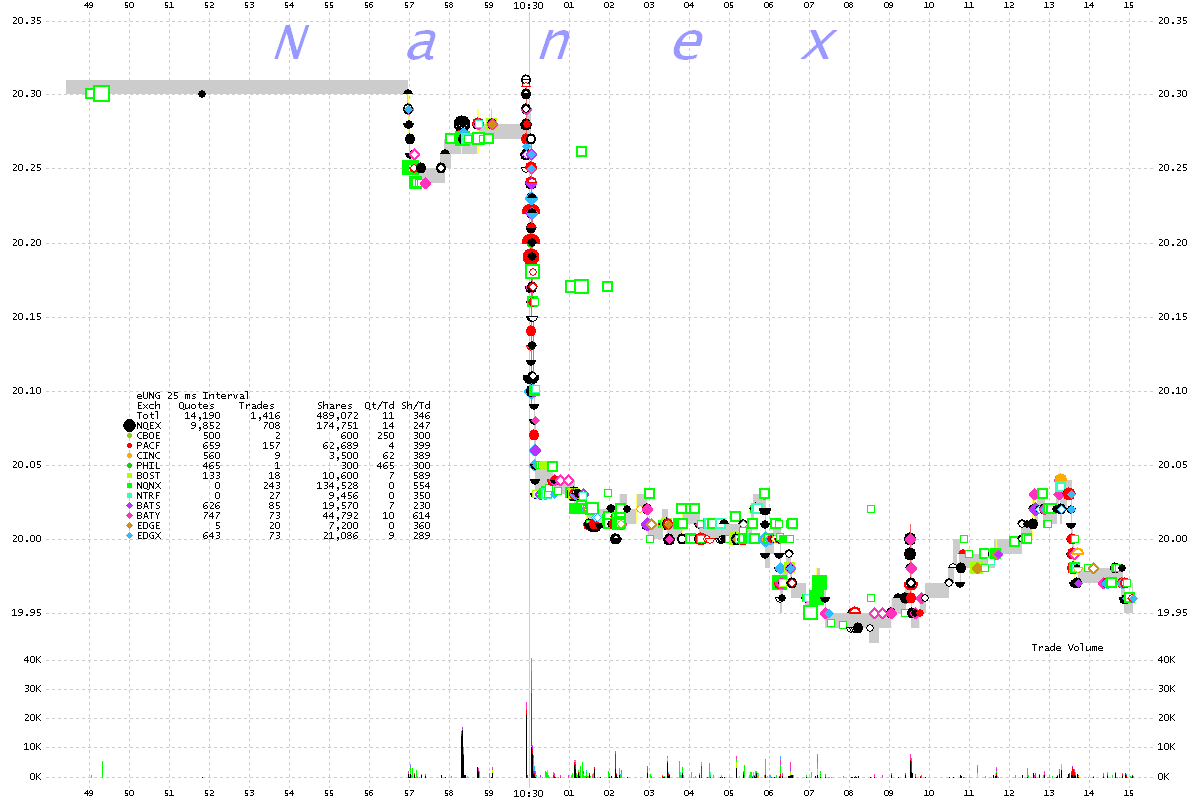
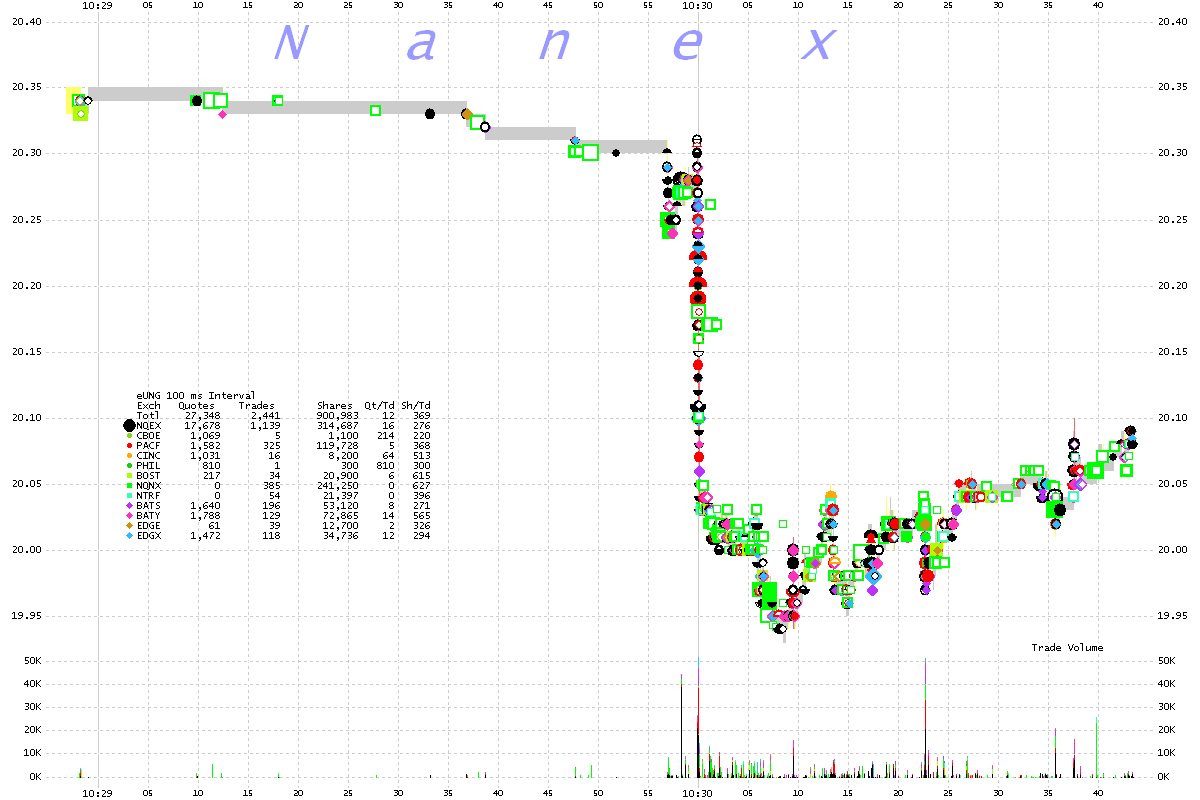
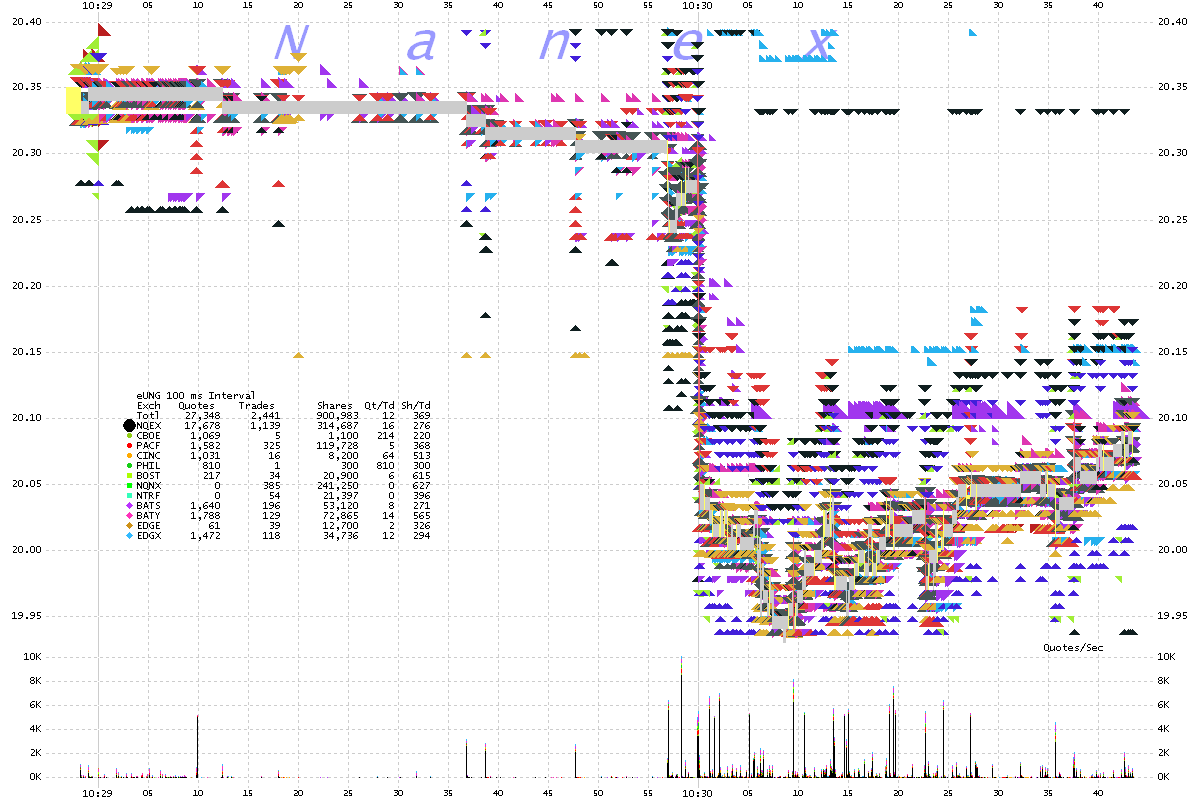
On September 13, 2012 about 3 seconds before the EIA Natural Gas Report released at 10:30, prices of UNG dropped on about 50 trades totaling 18,000 shares. Prices of other ETFs and Natural Gas futures also dropped.

1. UNG ~ 5 millisecond interval chart showing trades color coded by reporting exchange and the NBBO (gray shade).
280,905 quotes and 0 trades. 

2. UNG ~ 25 millisecond interval chart showing trades color coded by reporting exchange and the NBBO (gray shade).


3. UNG ~ 100 millisecond interval chart showing trades color coded by reporting exchange and the NBBO (gray shade).


4. UNG ~ 100 millisecond interval chart showing bids and asks color coded by reporting exchange.


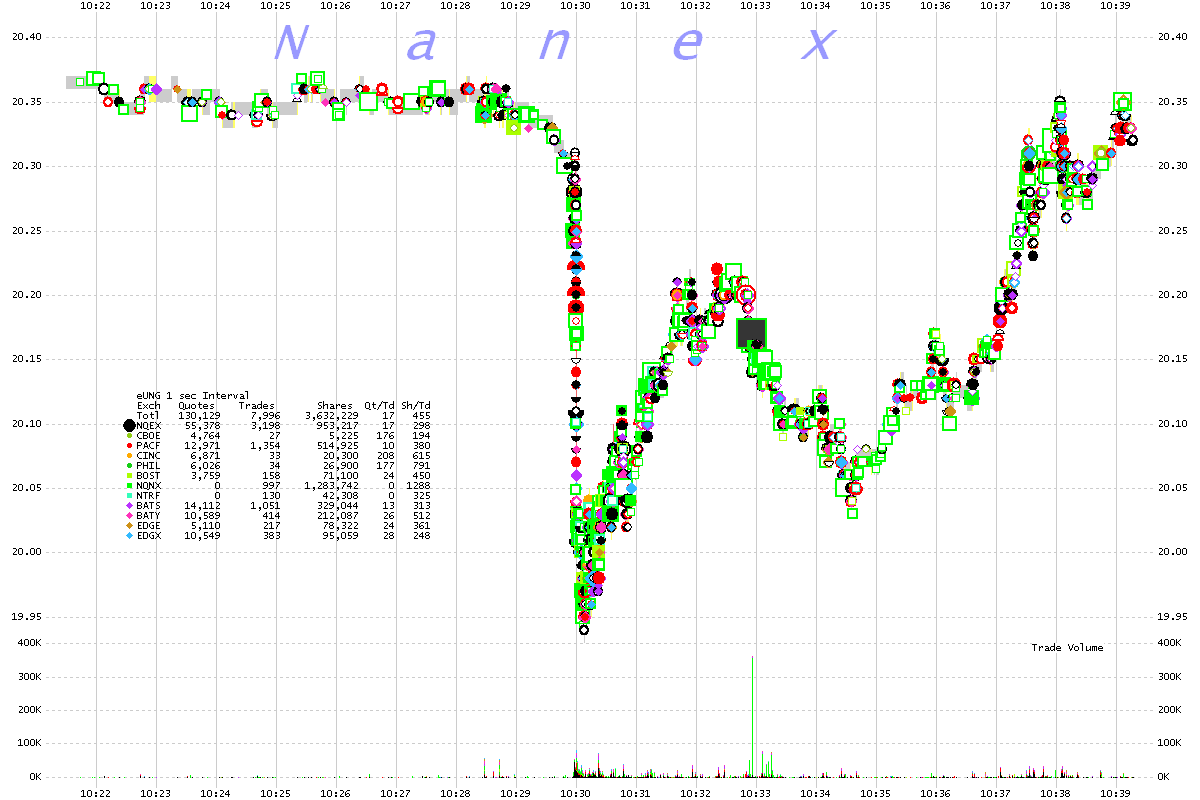
5. UNG ~ 1 second interval chart showing trades color coded by reporting exchange and the NBBO (gray shade).


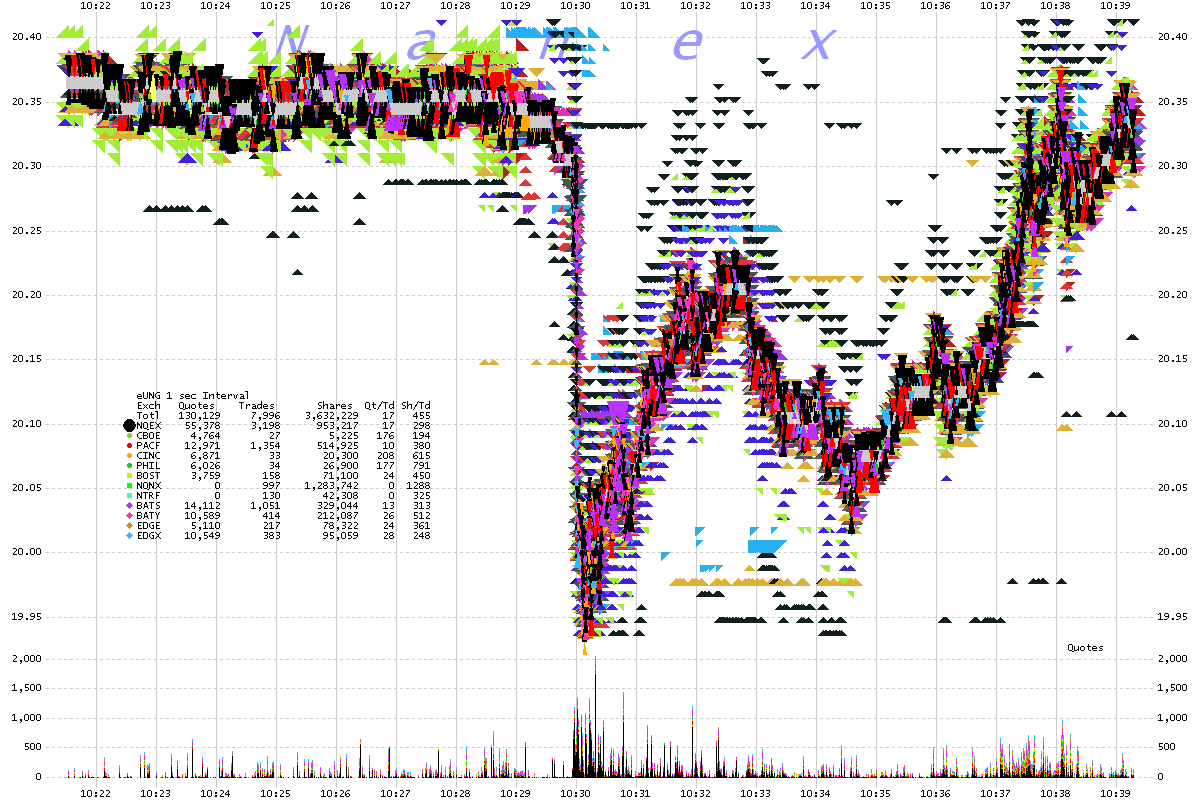
6. UNG ~ 1 second interval chart showing bids and asks color coded by reporting exchange.


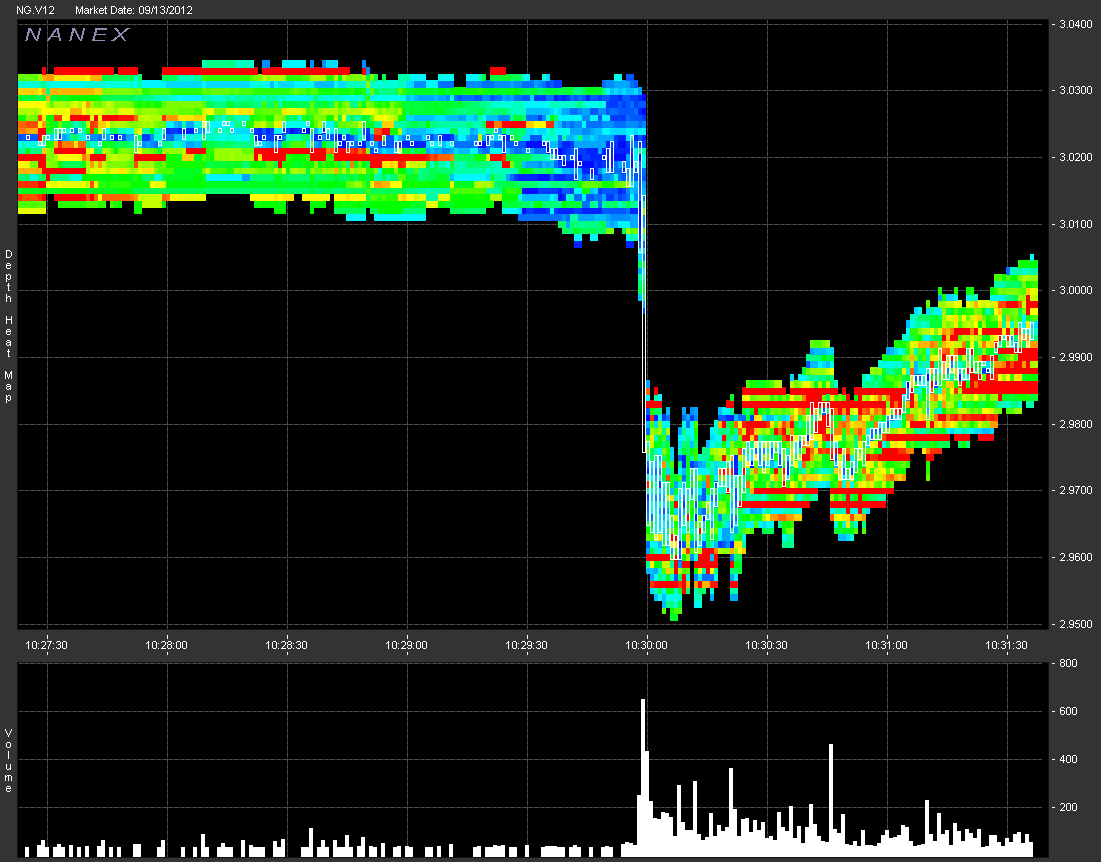
6. Natural Gas October 2012 futures contract showing depth of book.


Nanex Research

Inquiries: pr@nanex.net