Nanex Research

Nanex ~ 13-Sep-2012 ~ Double Flash Crash in Gold

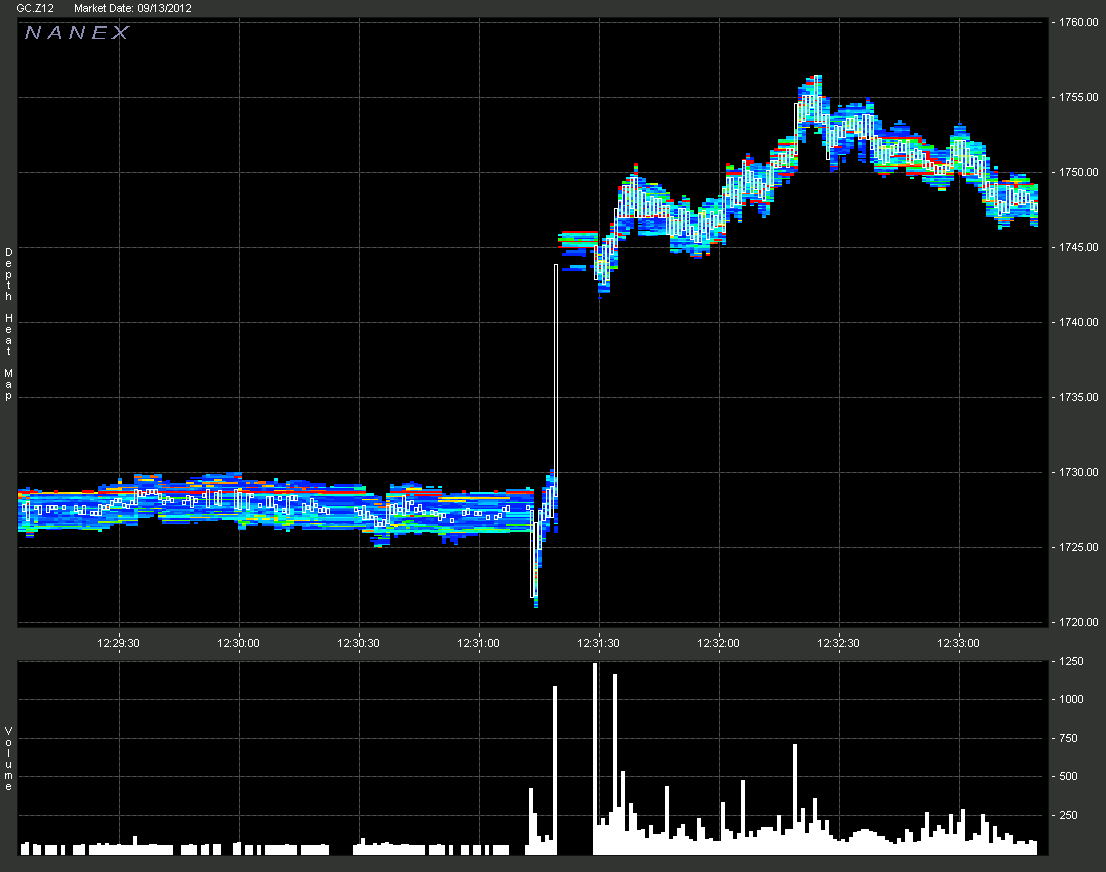
Trading was so furious in Gold, that the CME circuit breakers triggered and halted the futures contract for 5 seconds. First on the downside, then on the upside. This is the same circuit breaker that triggered only once in the eMini during market hours: that time was at the bottom of the flash crash on May 6, 2010.

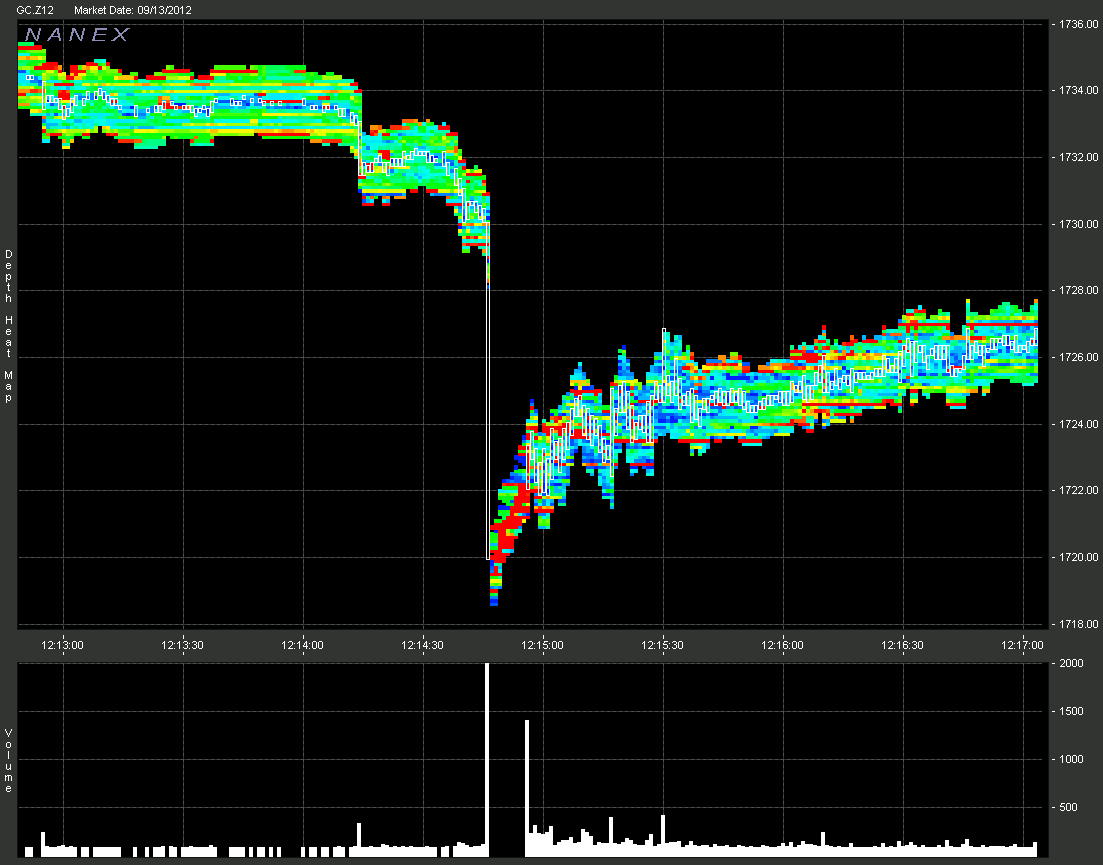
The first halt in the December 2012 Gold Futures contract (GC.Z12) was at 12:14:44: you can see the gap in volume in the lower panel of Chart 1. One second before the halt, 2,000 contracts traded the price down $10, from $1,730 to $1,720. The CME halt logic triggers a 5 second market pause whenever orders appear that would remove all available liquidity and move the price by a certain amount. For this event, this basically means that if this order represented a true intent to sell, then we should expect additional selling (from the balance of the order that triggered the halt) when trading resumes. However, in this case, the additional selling did not materialize, which leads us to believe the large sell order was meant to disturb any market based on the price of gold. And disturb the markets, it did.

1. December Gold Futures (GC.Z12) ~ 1 second interval trades with depth of book color coded by how much size is at each level.
Note the gap showing the halt after the drop. The depth of book shows orders continue to be added/removed from the book during the halt.


2. December Gold Futures (GC.Z12) ~ 1 second interval trades with depth of book color coded by how much size is at each level.
Another gap, this time after the meteoric rally.


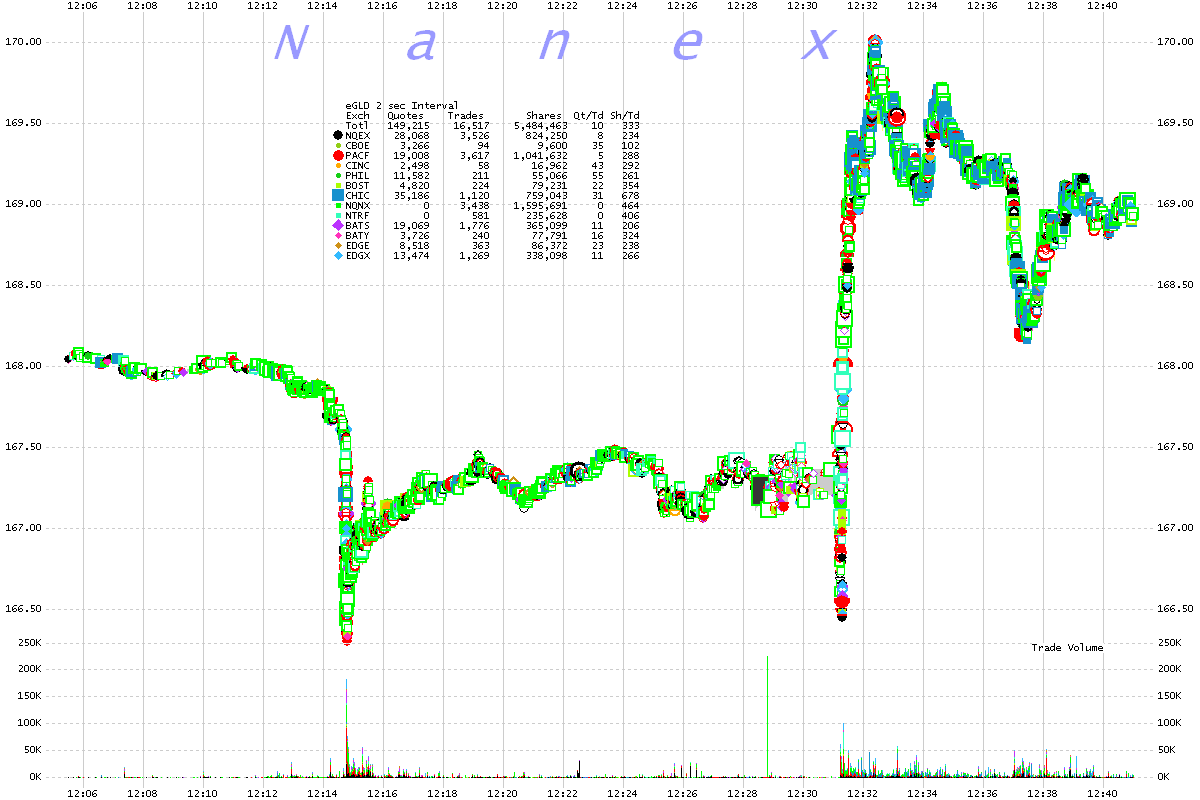
3. GLD ~ 2 second interval chart showing trades color coded by reporting exchange.


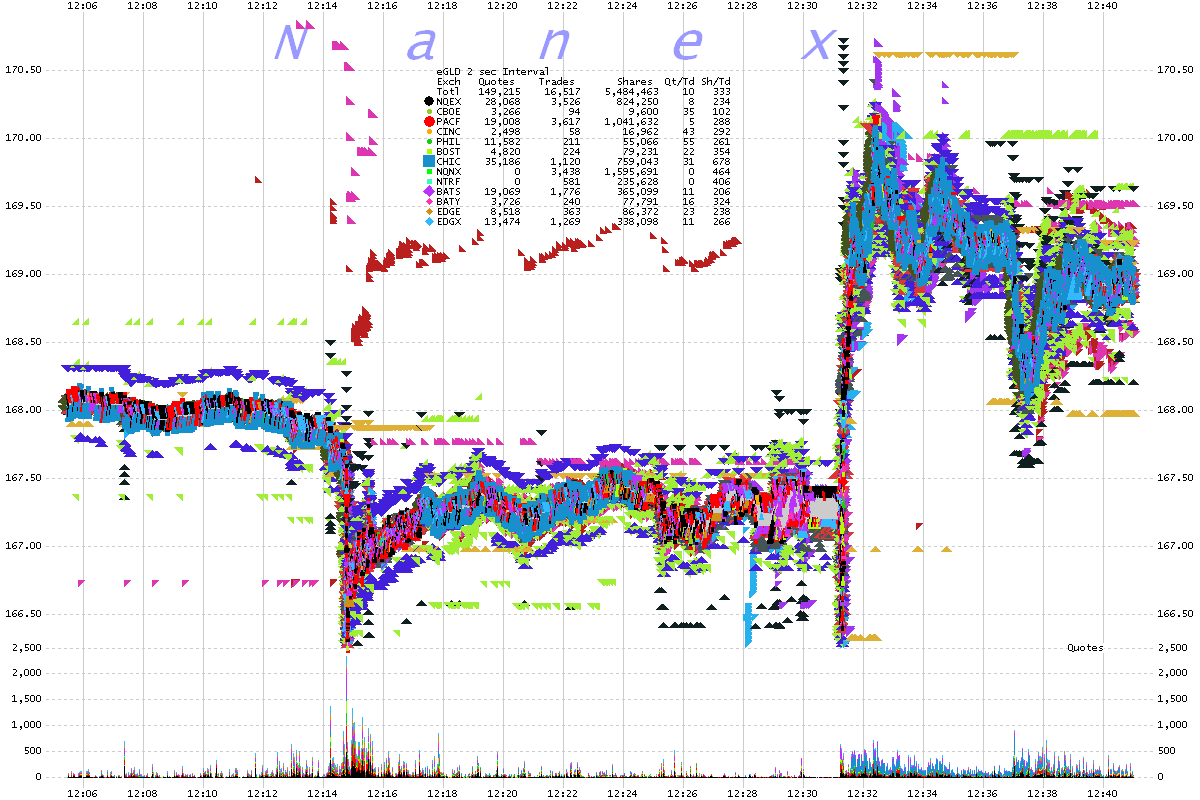
4. GLD ~ 2 second interval chart bids and offers color coded by reporting exchange.


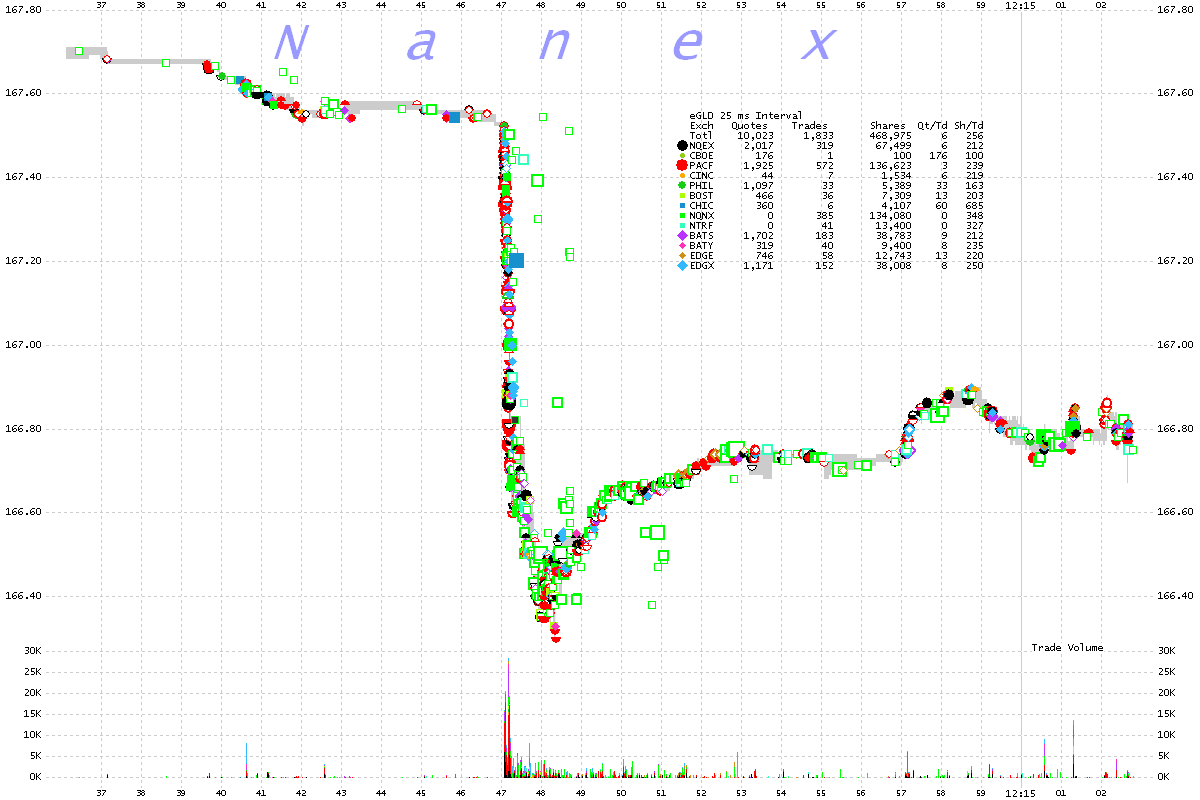
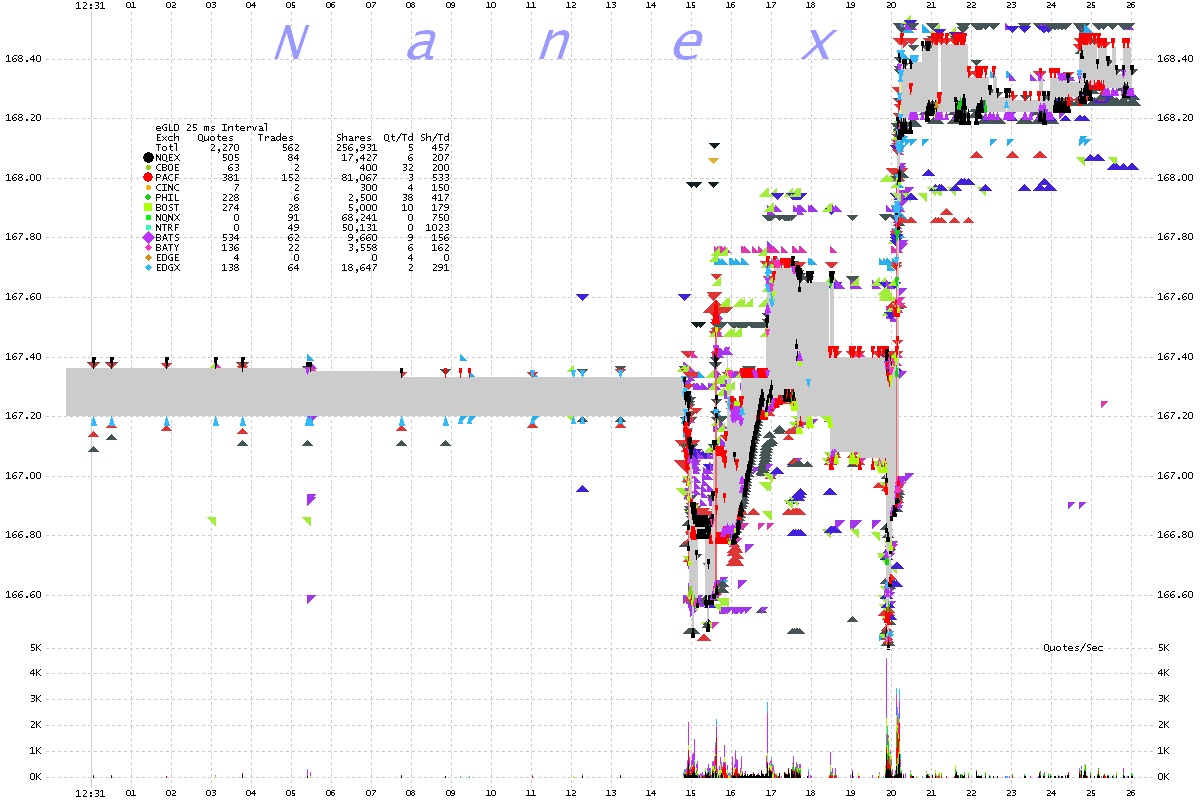
5. GLD ~ 25 millisecond interval chart showing trades color coded by reporting exchange and the NBBO (gray shade).


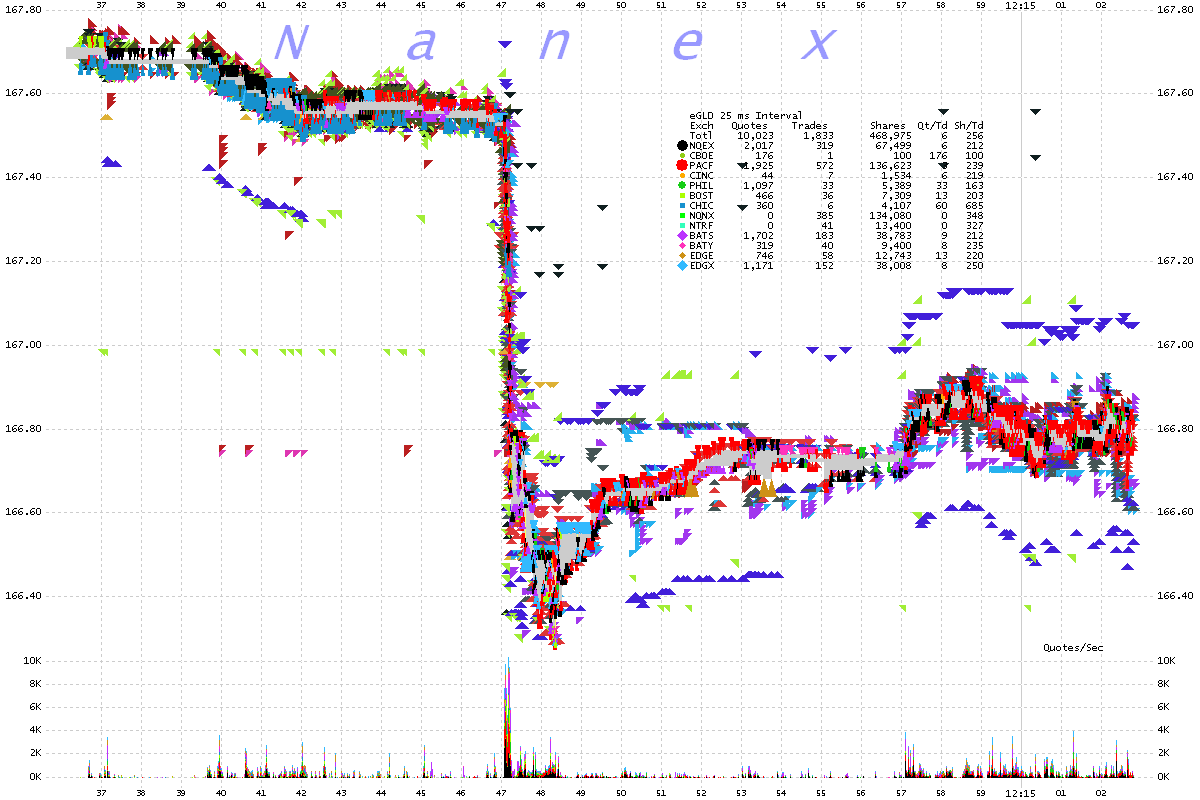
6. GLD ~ 25 millisecond interval chart showing bids and asks color coded by reporting exchange.


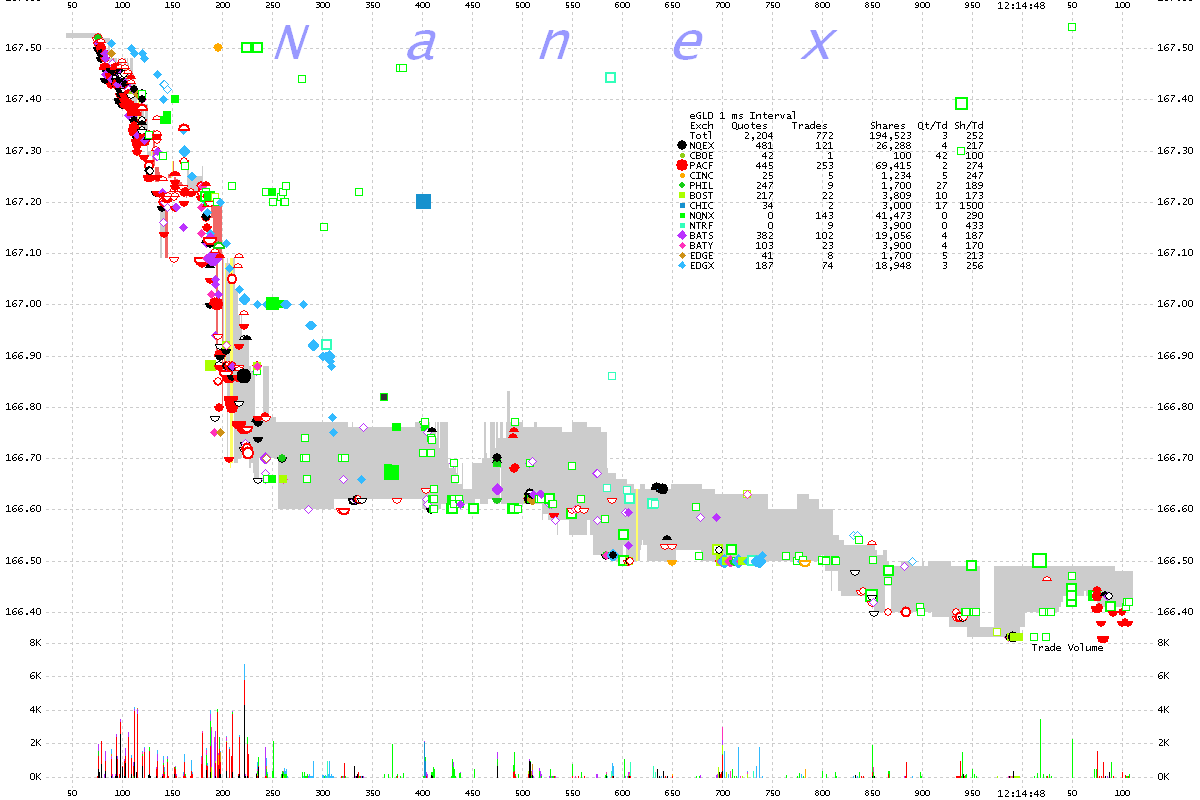
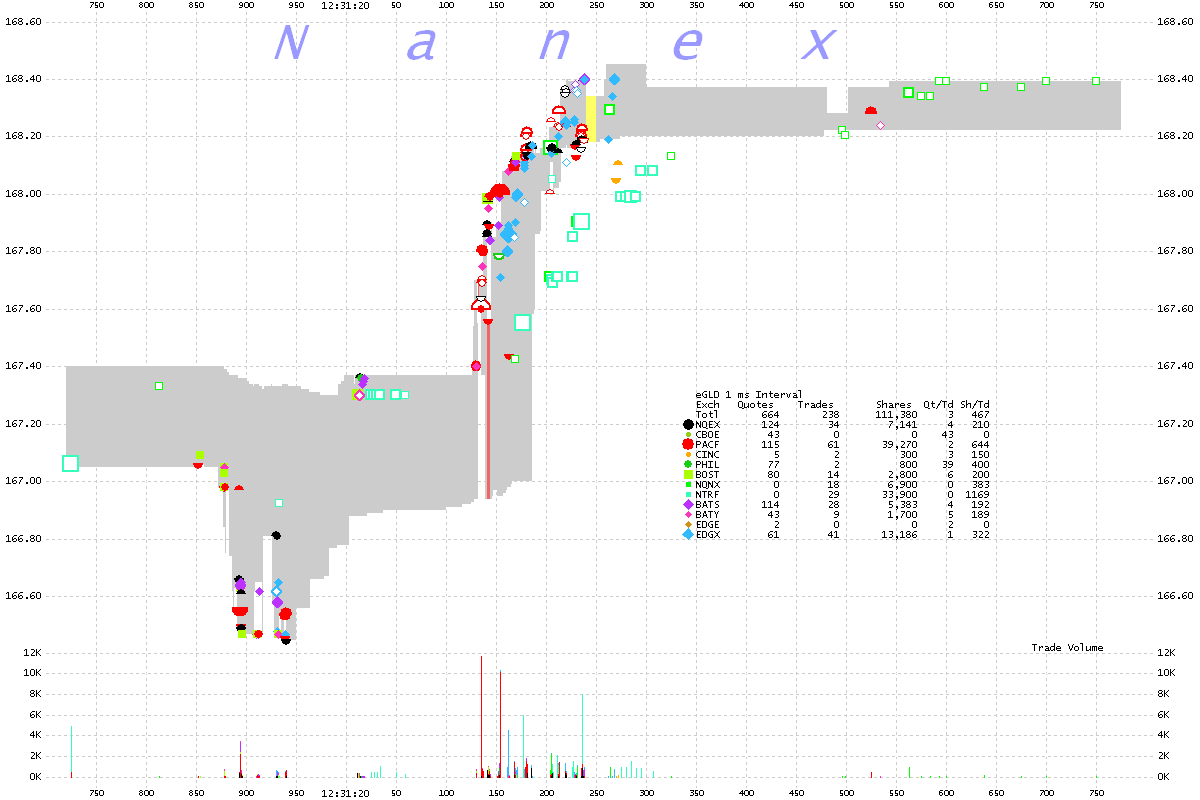
7. GLD ~ 1 millisecond interval chart showing trades color coded by reporting exchange and the NBBO (gray shade).


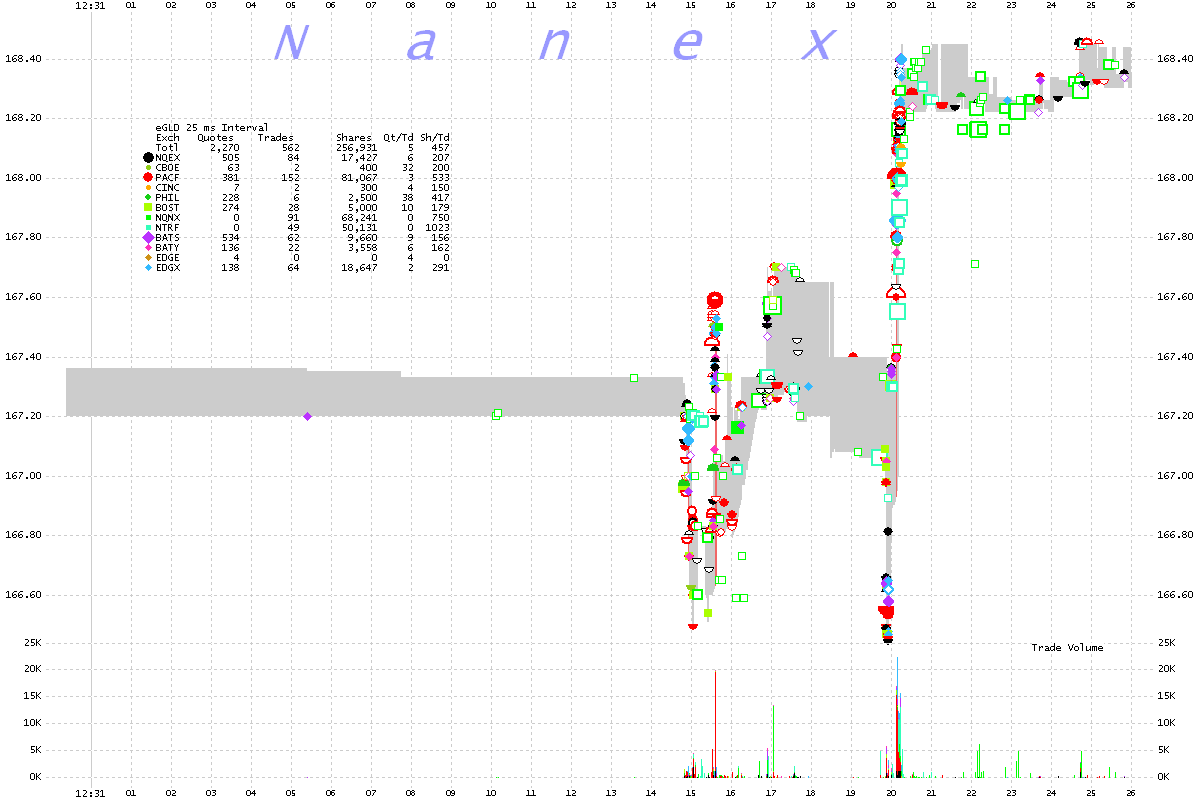
8. GLD ~ 25 millisecond interval chart showing trades color coded by reporting exchange and the NBBO (gray shade).


9. GLD ~ 25 millisecond interval chart showing bids and asks color coded by reporting exchange.


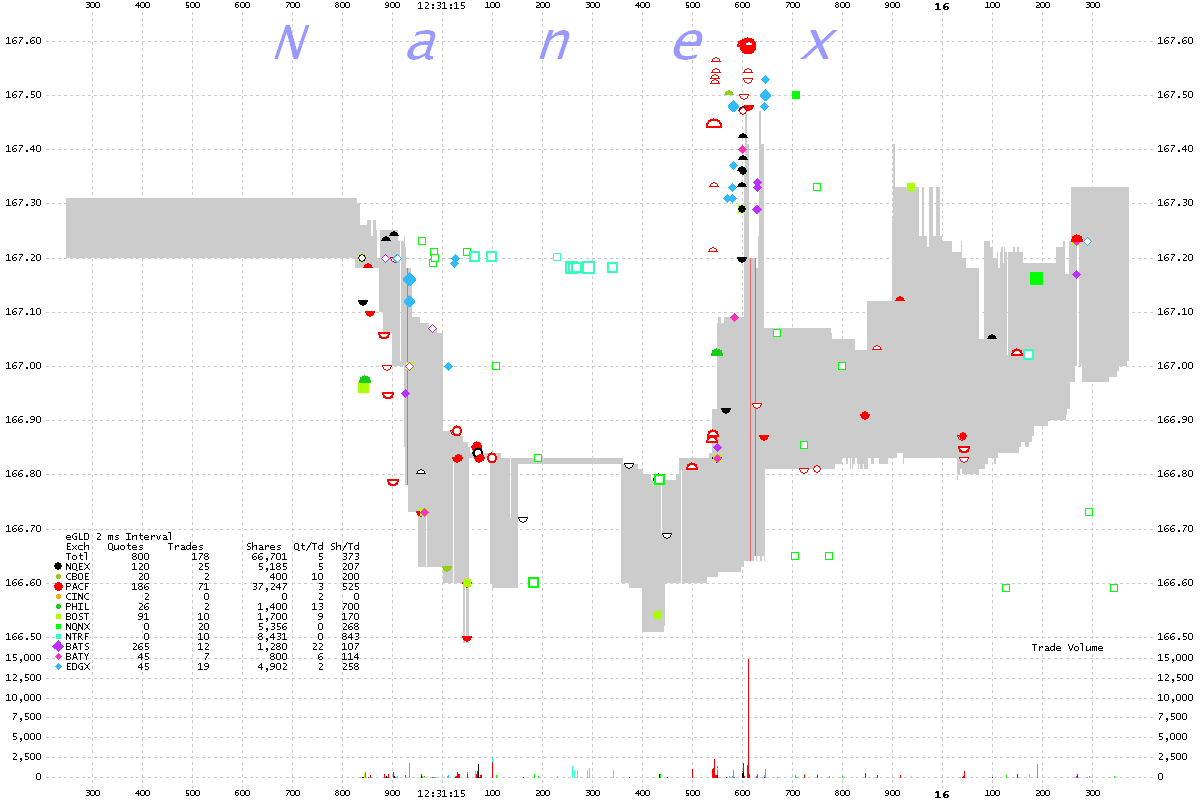
10. GLD ~ 2 millisecond interval chart showing trades color coded by reporting exchange and the NBBO (gray shade).


11. GLD ~ 2 millisecond interval chart showing trades color coded by reporting exchange and the NBBO (gray shade).


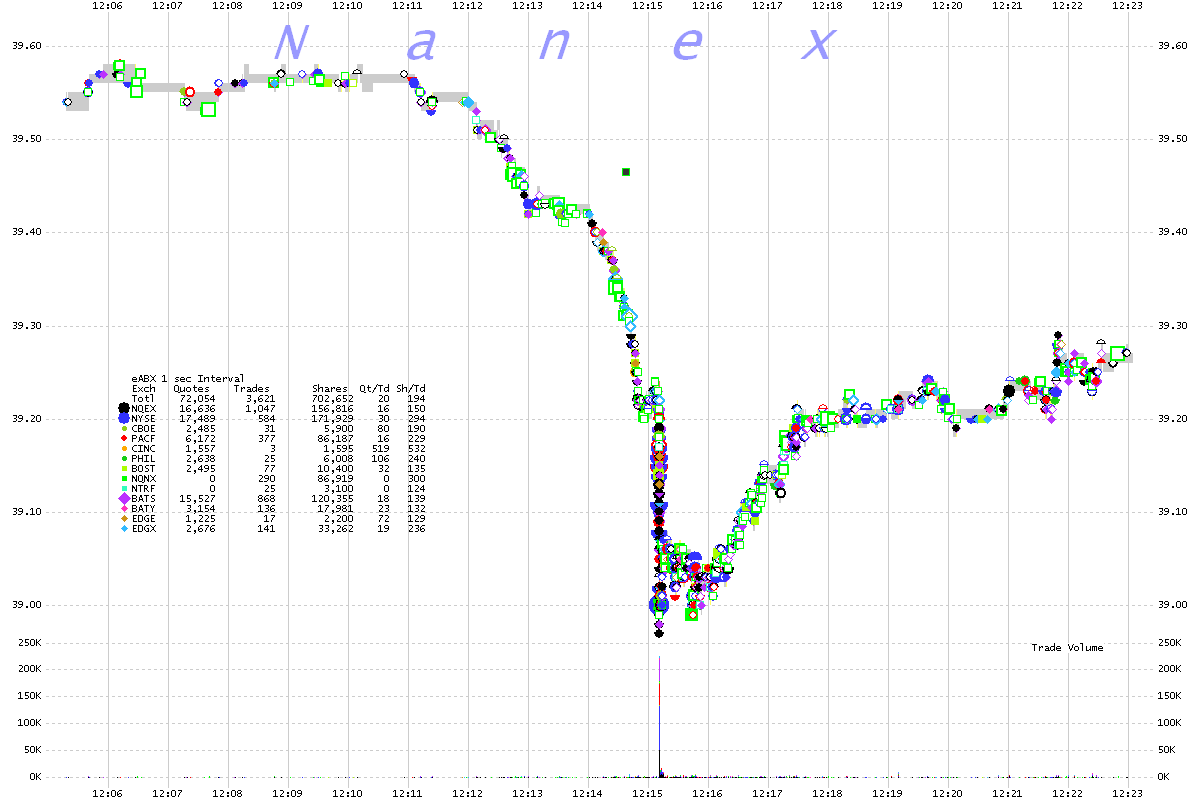
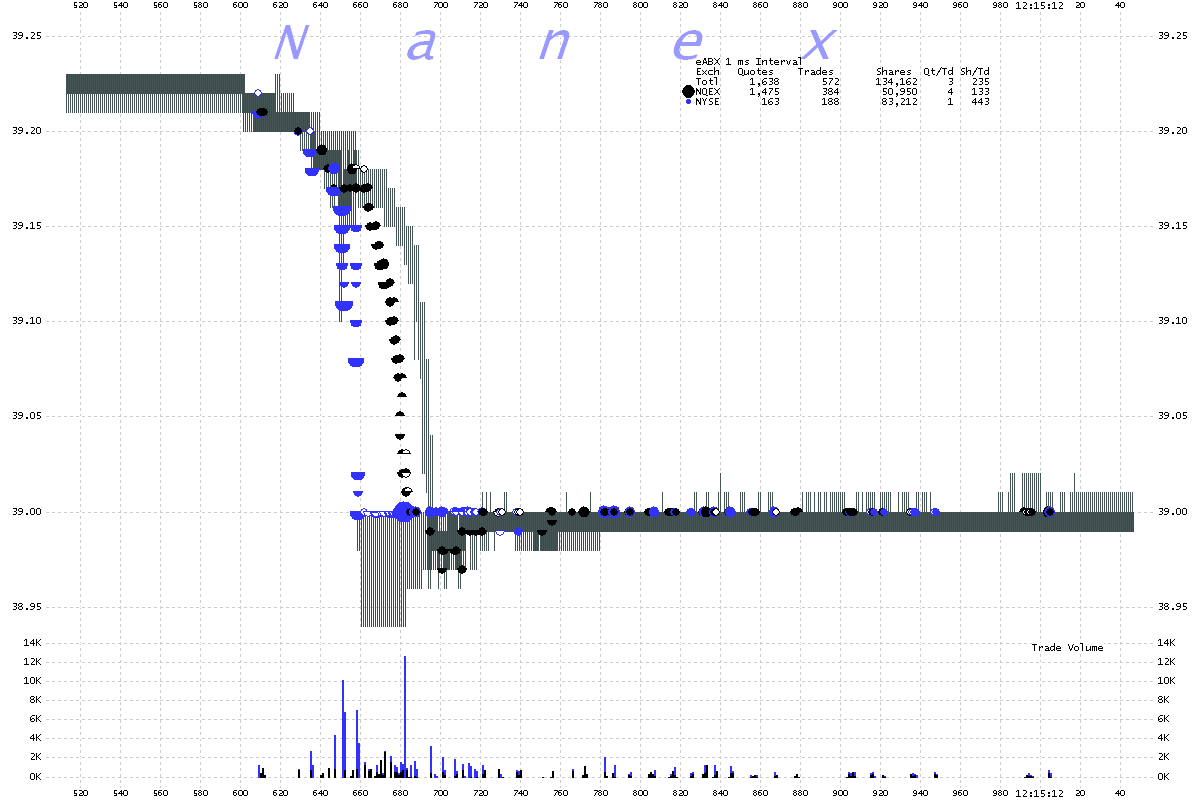
12. ABX ~ 1 second interval chart showing trades color coded by reporting exchange.


13. ABX ~ 1 millisecond interval chart showing trades and bid/ask spread for Nasdaq (black) and NYSE (blue).
Note how the trades print ahead of quotes.


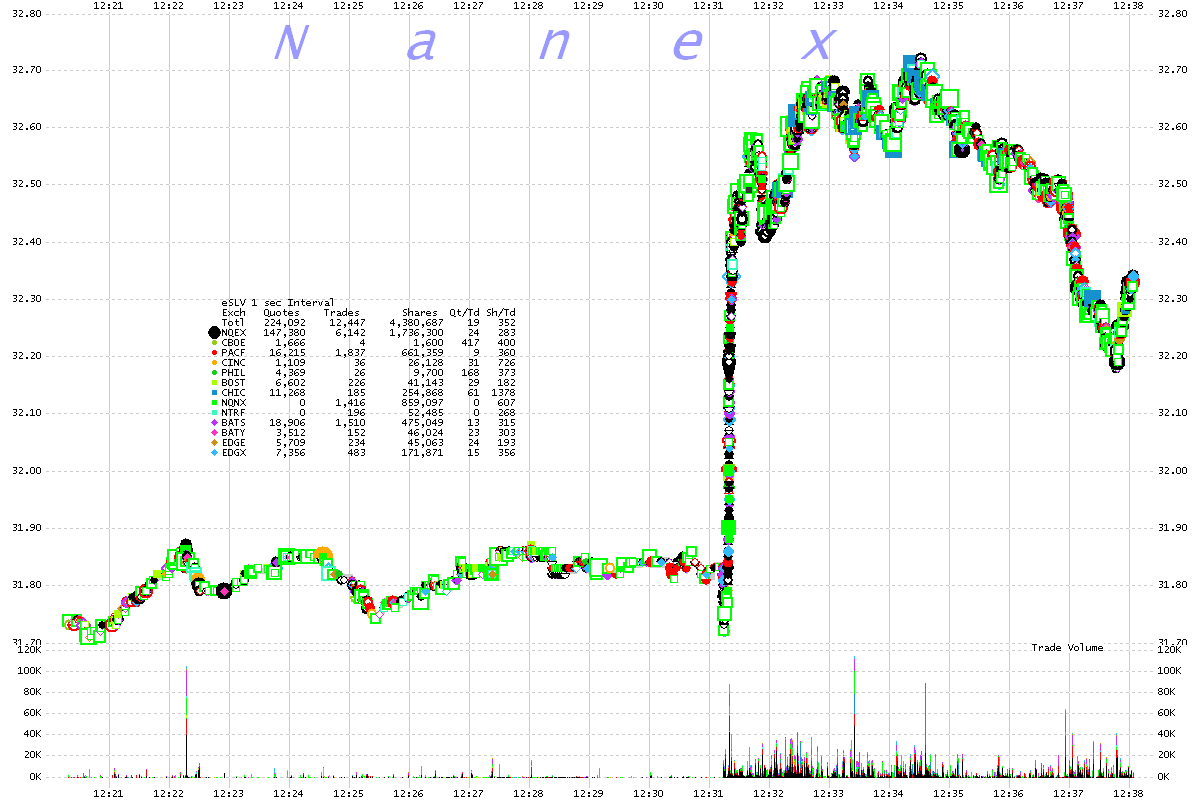
14. SLV ~ 1 second interval chart showing trades color coded by reporting exchange.


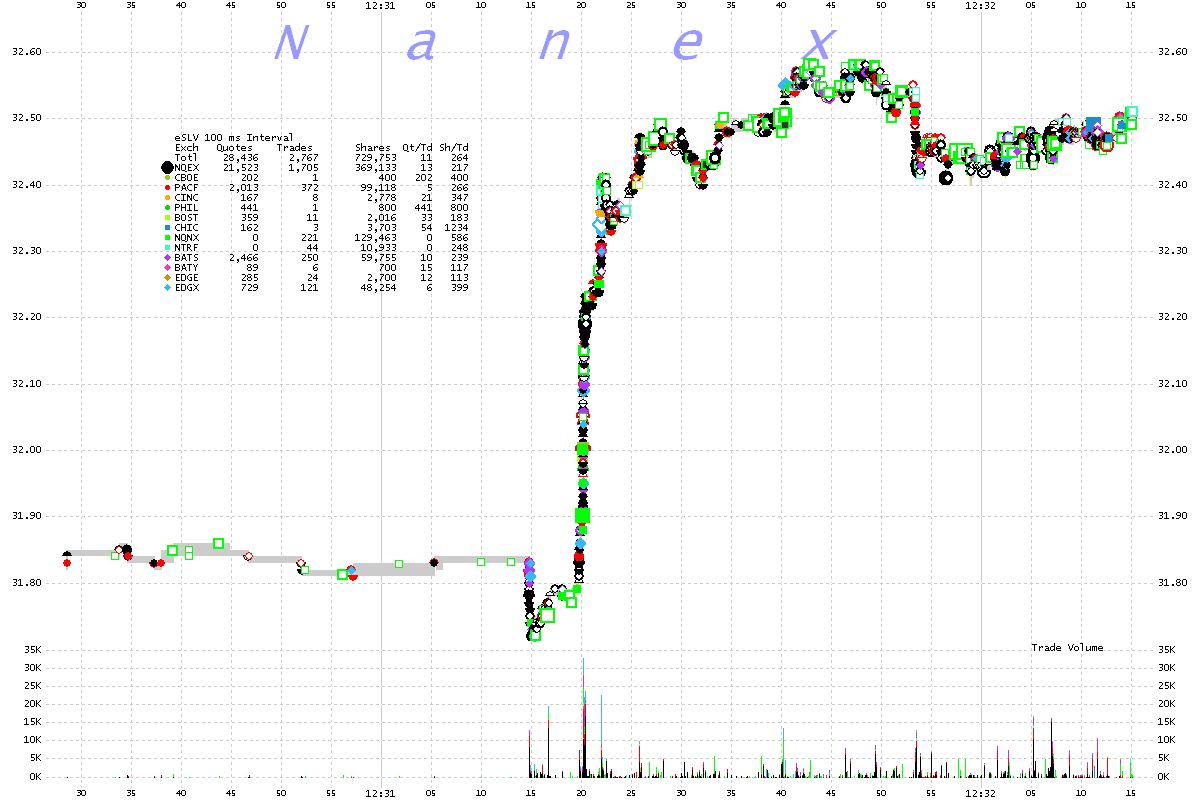
15. SLV ~ 100 millisecond interval chart showing trades color coded by reporting exchange.


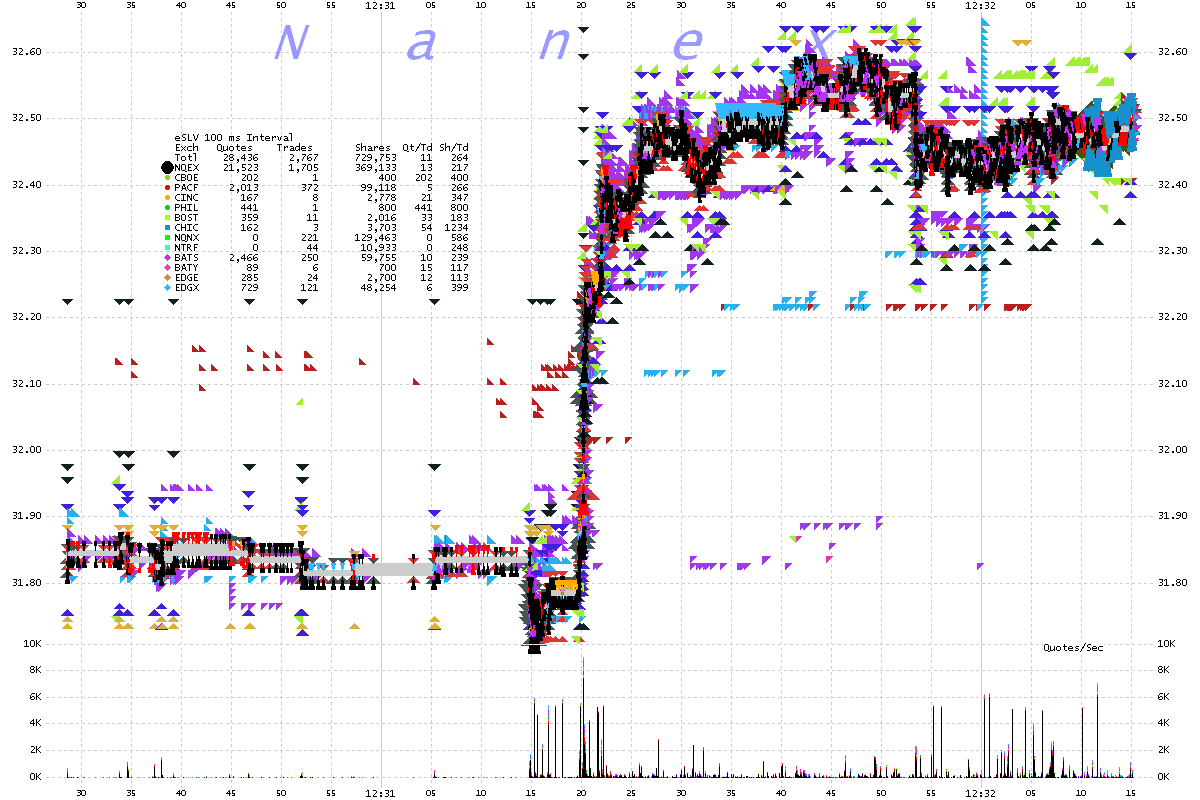
16. SLV ~ 100 millisecond interval chart showing bids and asks color coded by reporting exchange.


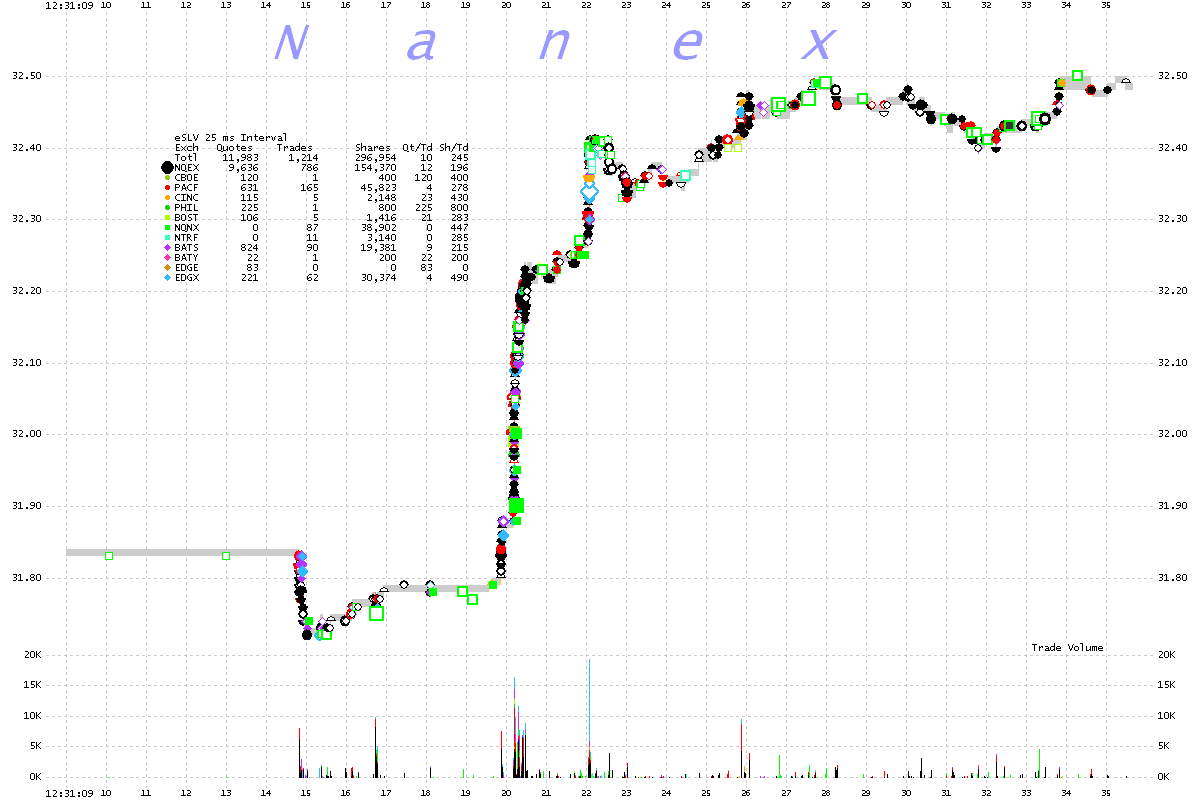
17. SLV ~ 25 millisecond interval chart showing trades color coded by reporting exchange.


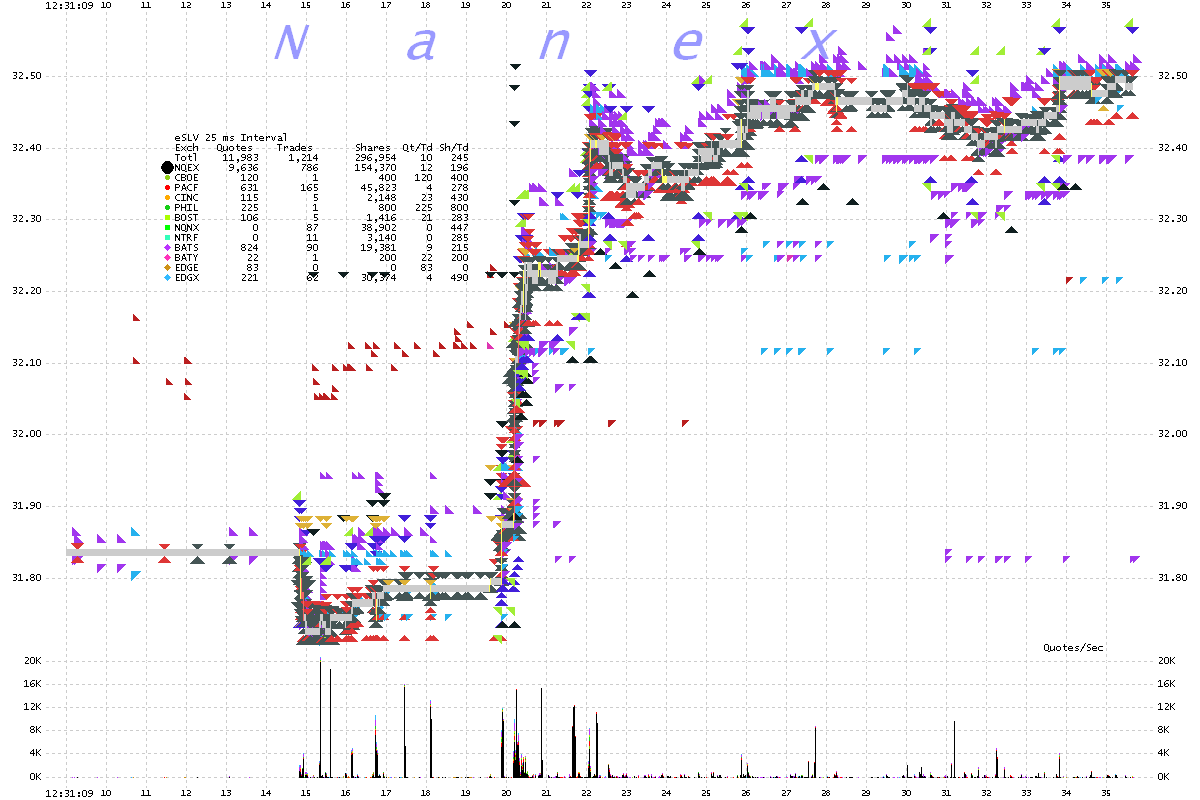
18. SLV ~ 25 millisecond interval chart showing bids and asks color coded by reporting exchange.


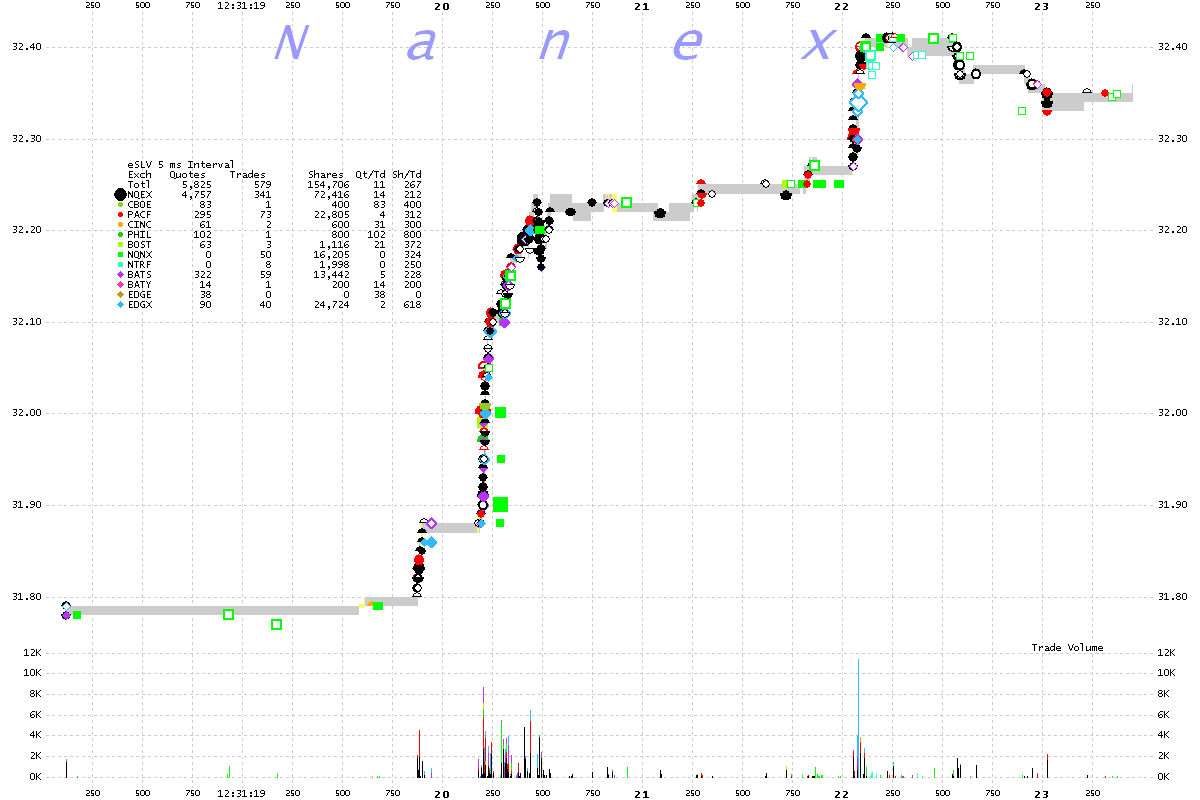
19. SLV ~ 5 millisecond interval chart showing trades color coded by reporting exchange.


Nanex Research

Inquiries: pr@nanex.net