Nanex Research

Nanex ~ 13-Sep-2012 ~ SEC Sanctioned Trading in SPY

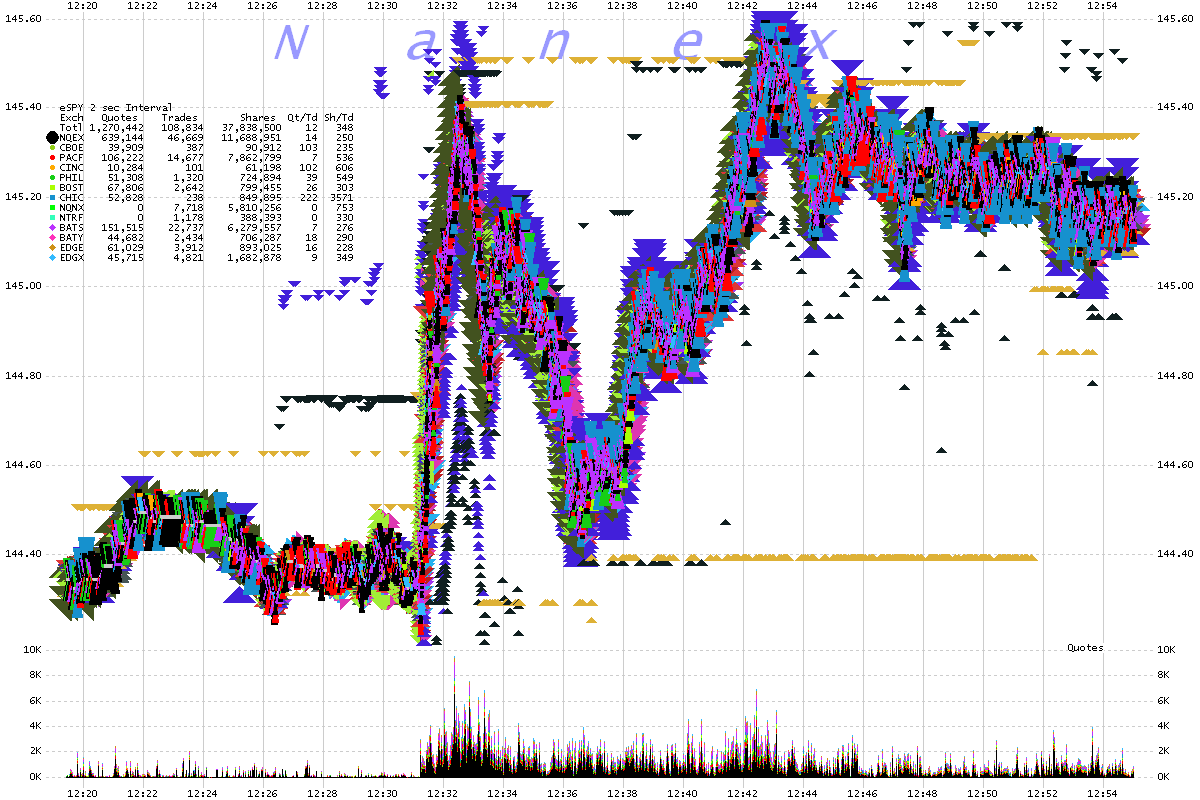
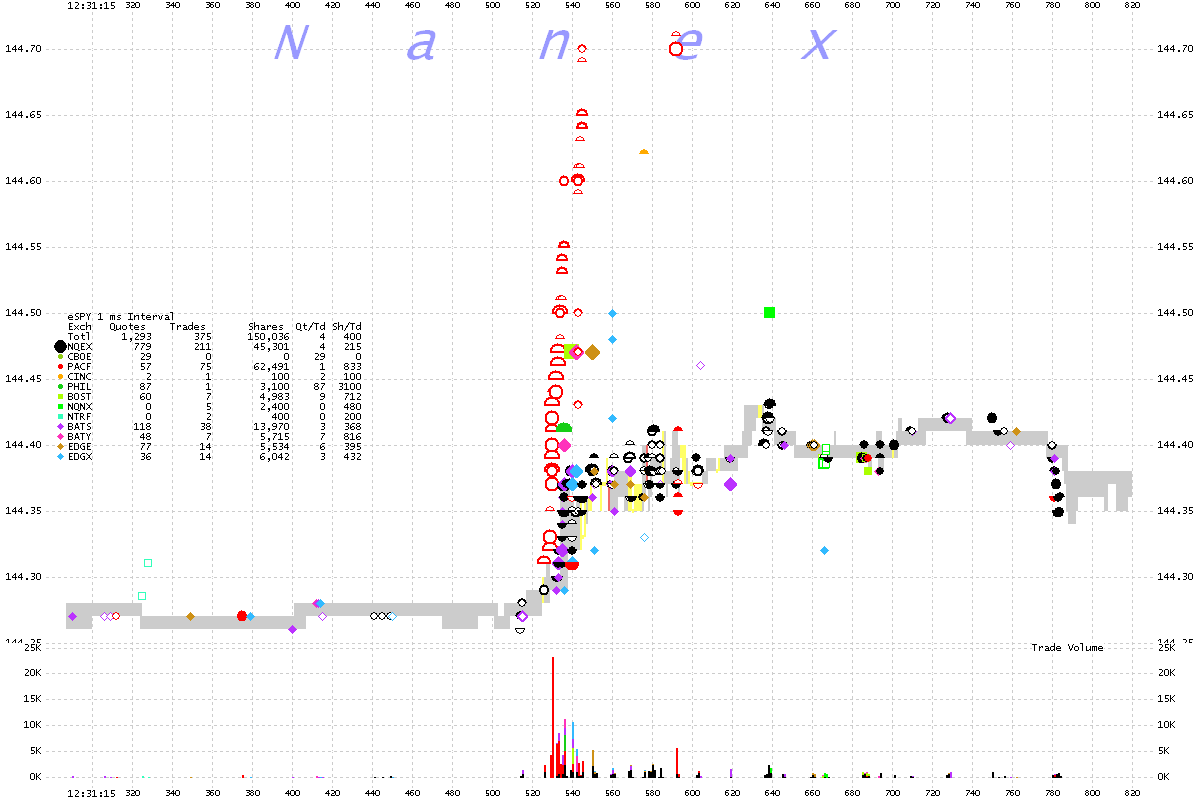
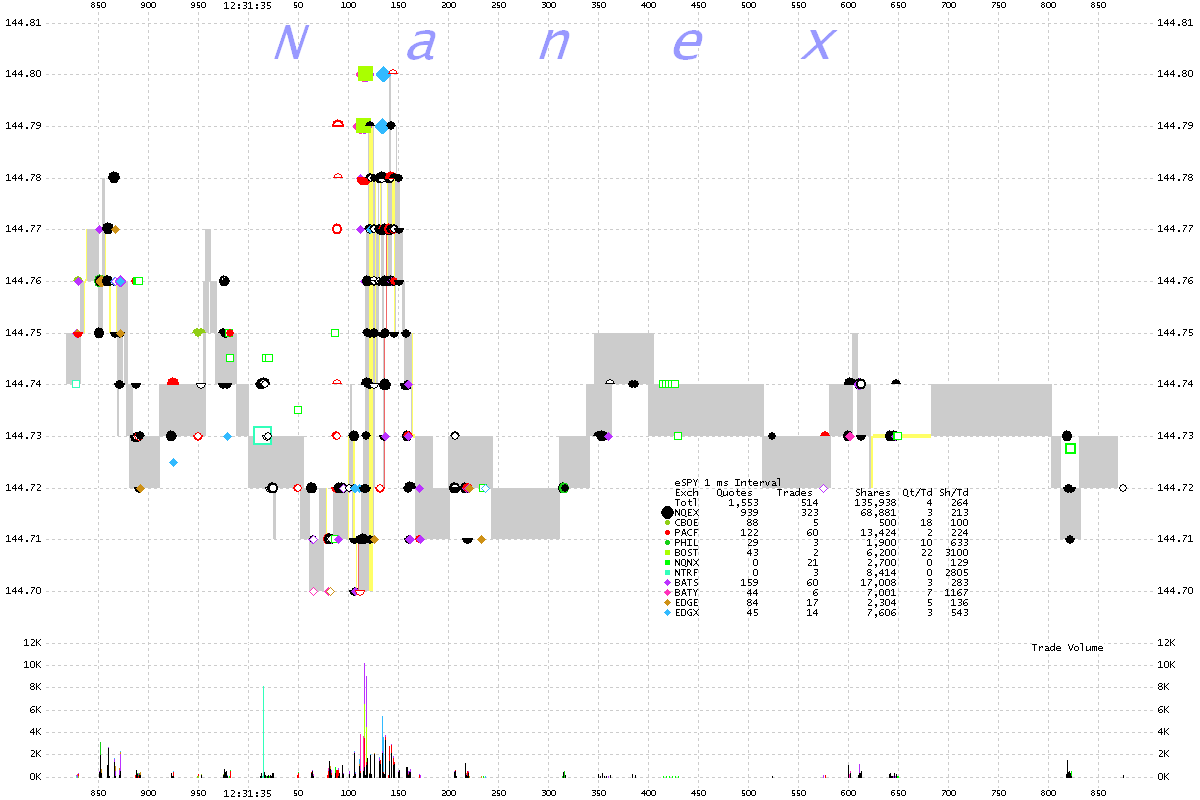
On September 13, 2012 at 12:31:15, during a very important FOMC Meeting Announcement, the machines took over, and SPY stopped resembling a stock market. The follow charts capture some of that mayhem. Viewer discretion is advised. See also SPY Intentional Bad Tick .

1. SPY ~ 2 second interval chart showing trades color coded by reporting exchange.
Those large green squares are trades from dark pools that don't set the last. These are typical.


2. SPY ~ 2 second interval chart bids and offers color coded by reporting exchange.
This is price discovery. How many prices can you discover?


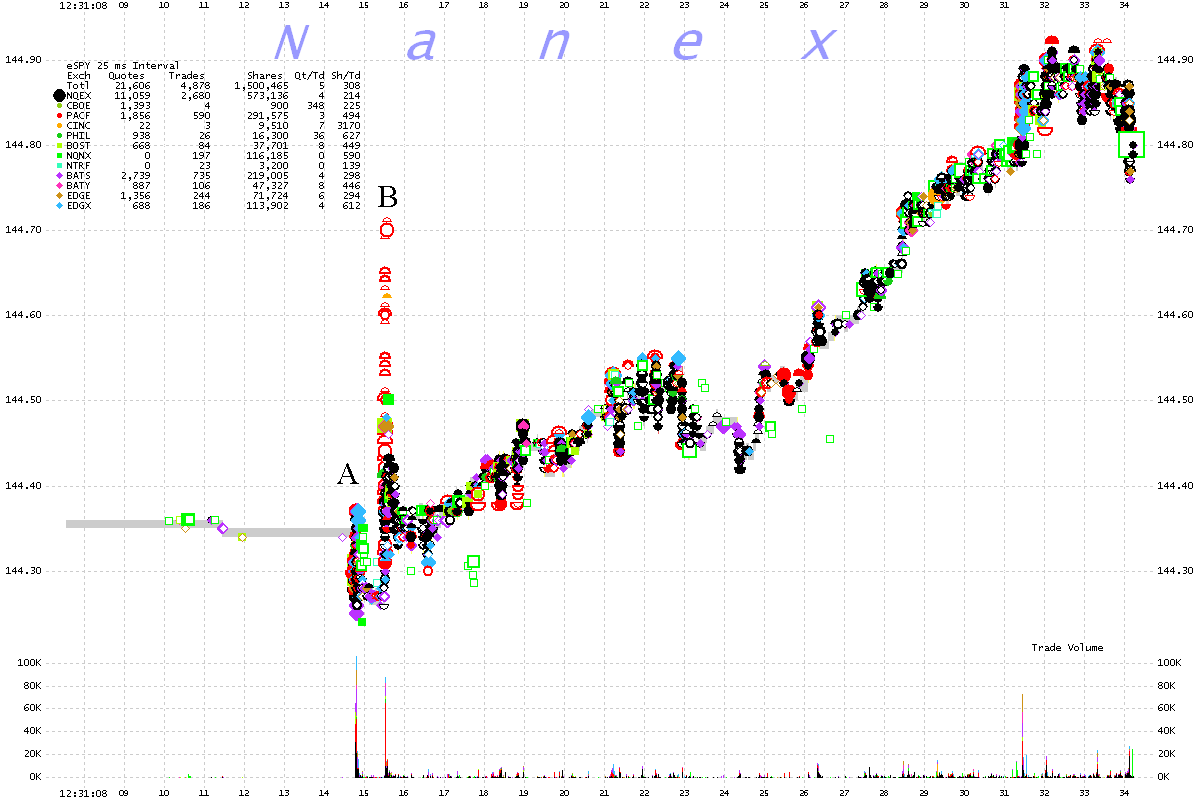
3. SPY ~ 25 millisecond interval chart showing trades color coded by reporting exchange.
Note the two areas labeled A and B.


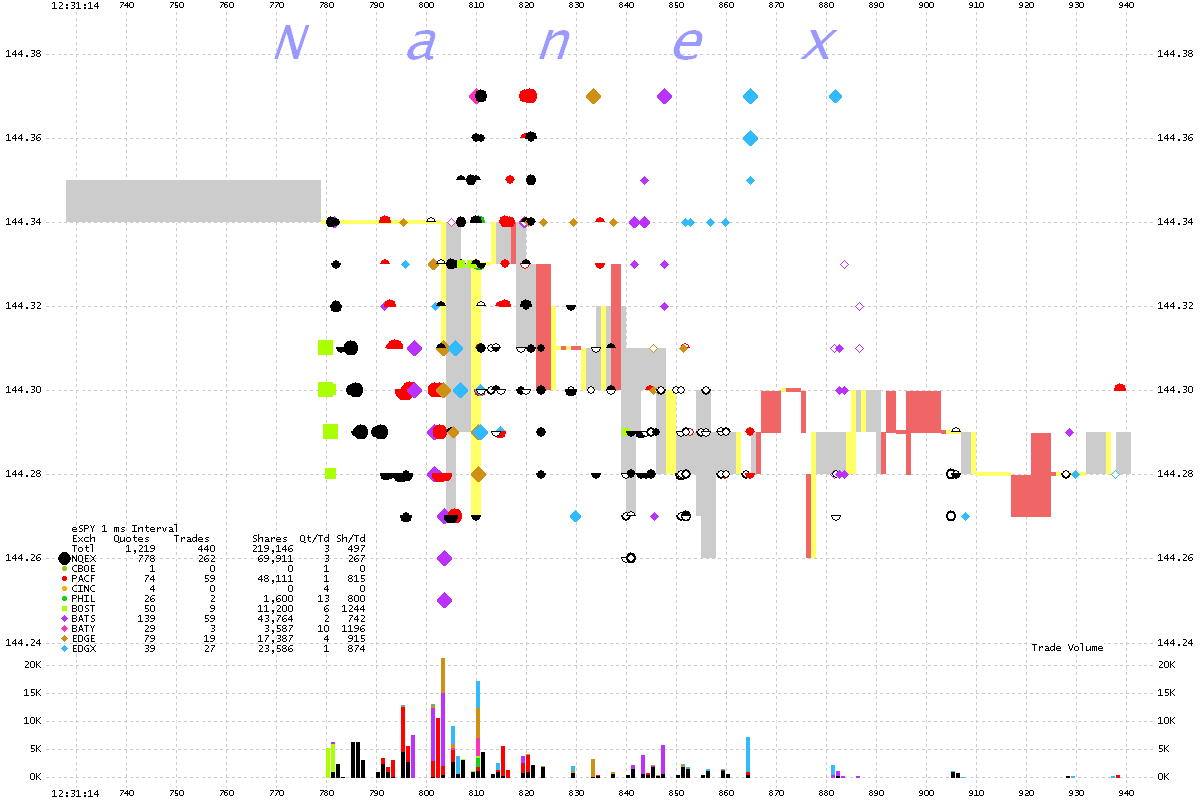
4. SPY ~ 1 millisecond interval chart showing trades color coded by reporting exchange. Showing 1/4 second of data from Area A on Chart 4.
Does this resemble a market place suitable for humans? The machines can't even keep up.


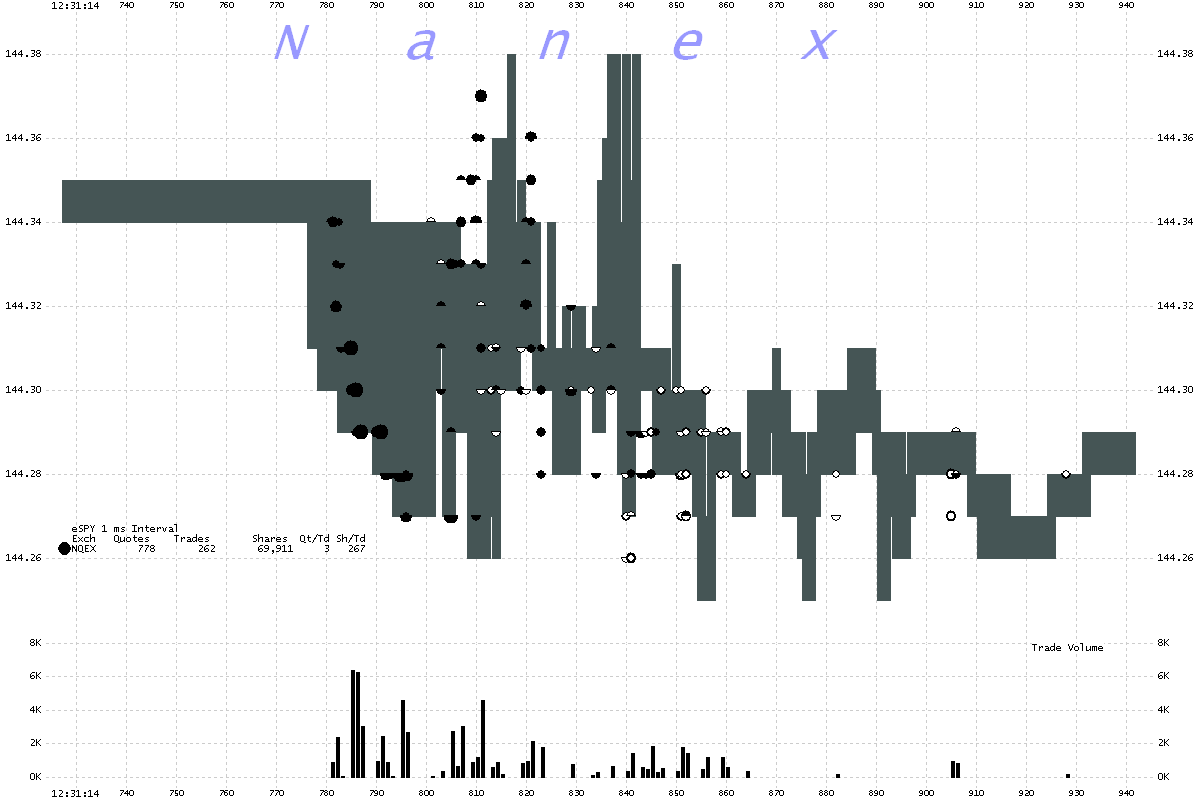
5. SPY ~ 1 millisecond interval chart showing trades (circles) and bid/ask spread (gray shade) from one exchange for clarity.
Down, up, down, up, down, up, down, up, down.. Over 5 cycles of this in 50 milliseconds. Some cycles lasting a few milliseconds.


6. SPY ~ 1 millisecond interval chart showing trades color coded by reporting exchange. Showing 1/2 second of data from Area B on Chart 4.
The run up in trades from NY-ARCA (PACF), traded well outside the NBBO (gray shade).


7. SPY ~ 1 millisecond interval chart showing trades color coded by reporting exchange.
Another oscillation found (with little effort).


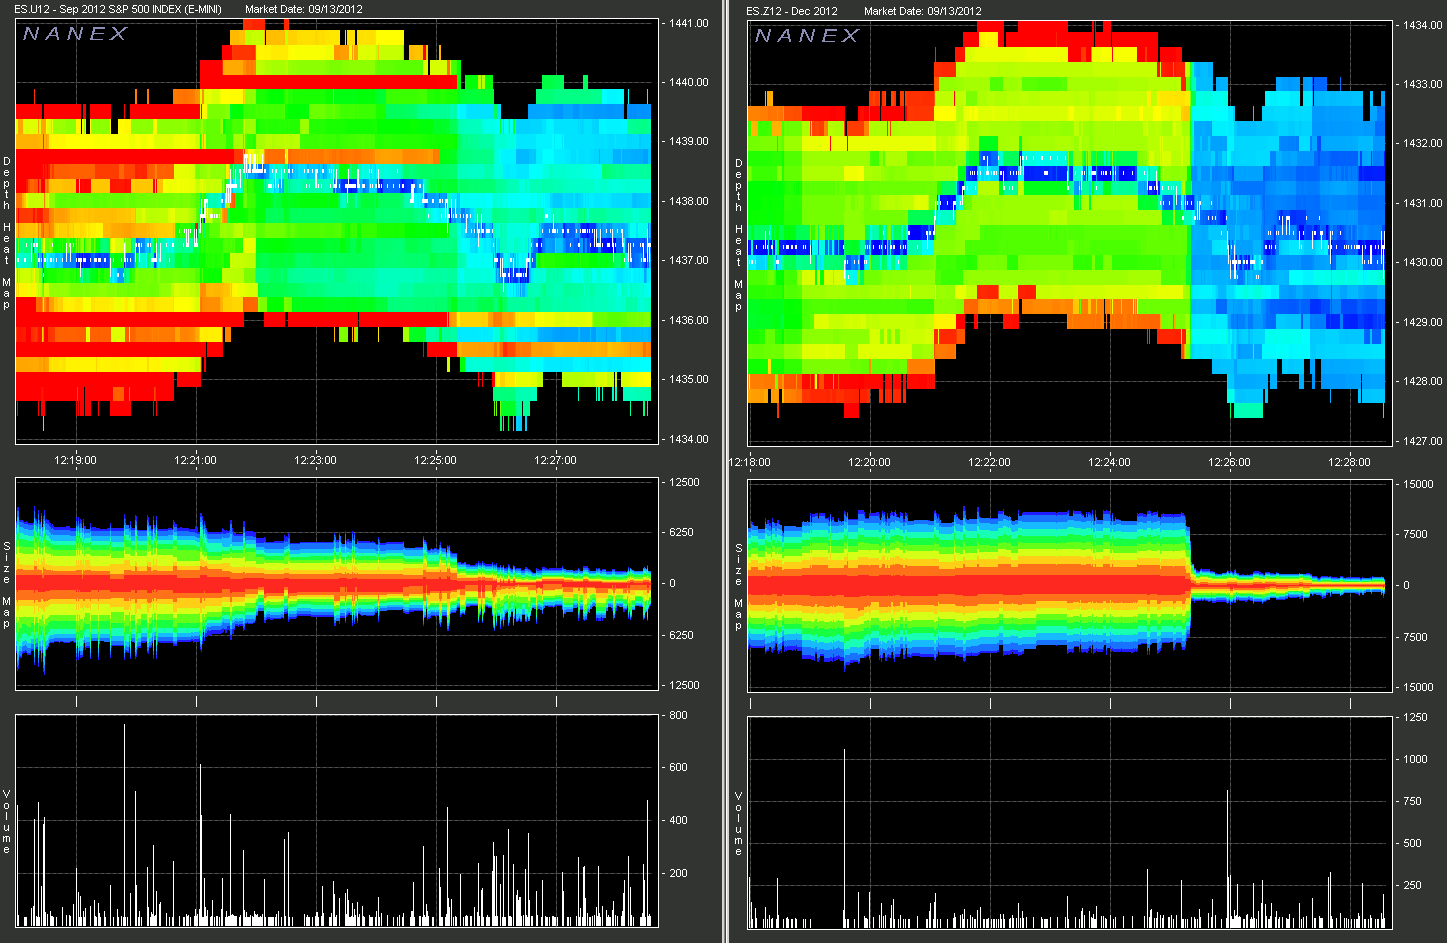
8. Depth of book in EMini Futures, September (left) and December (right) contracts.
Note the sudden drop of liquidity in the December contract.


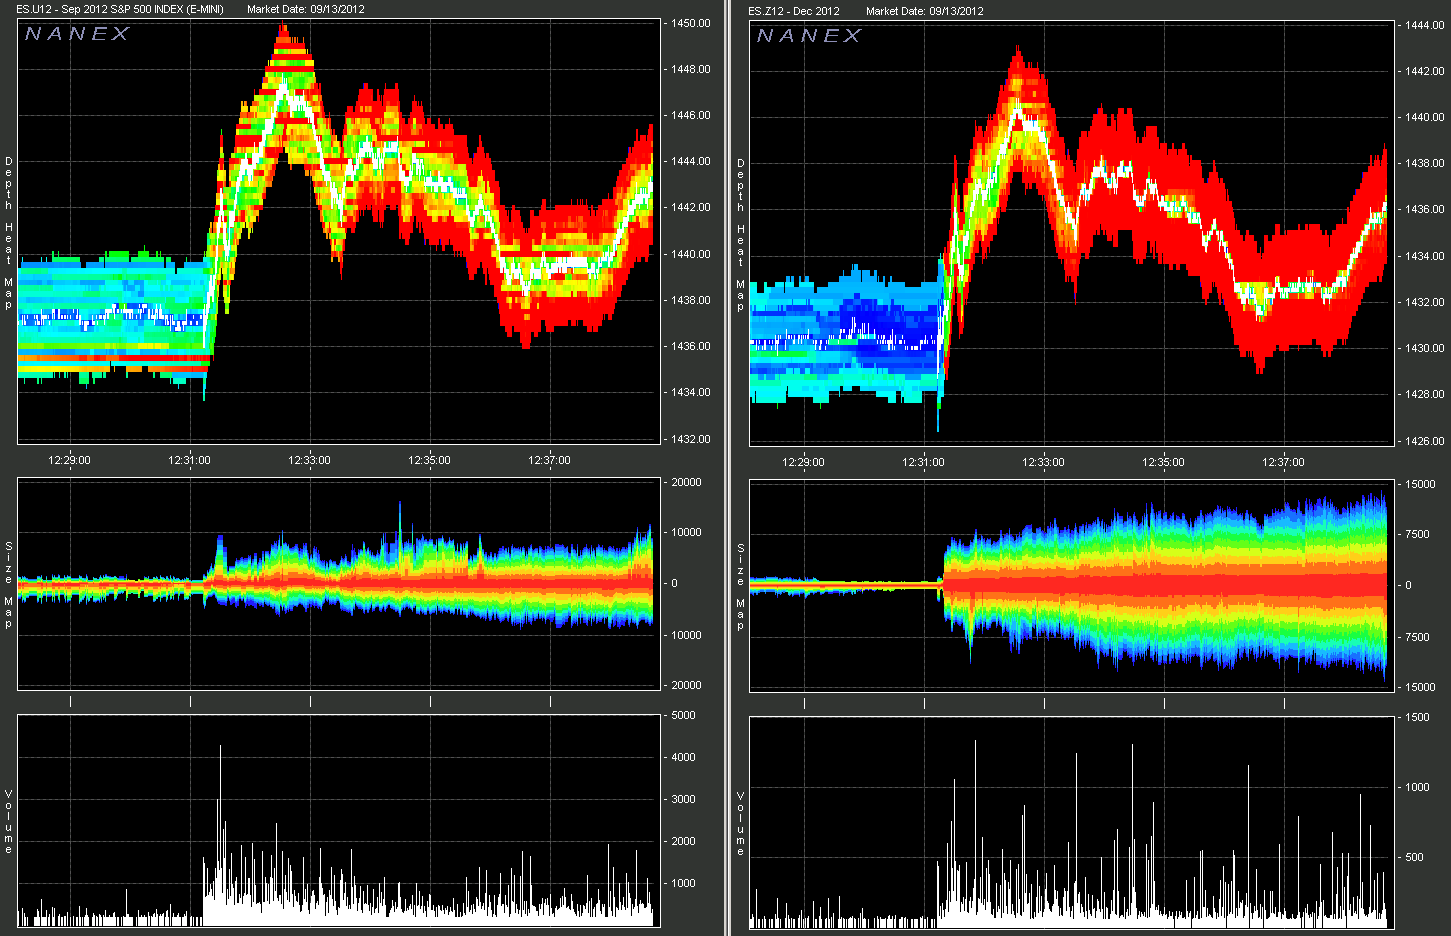
9. Depth of book a few minute later.


Nanex Research

Inquiries: pr@nanex.net