Nanex Research

Nanex ~ 19-Sep-2012 ~ War Exercises
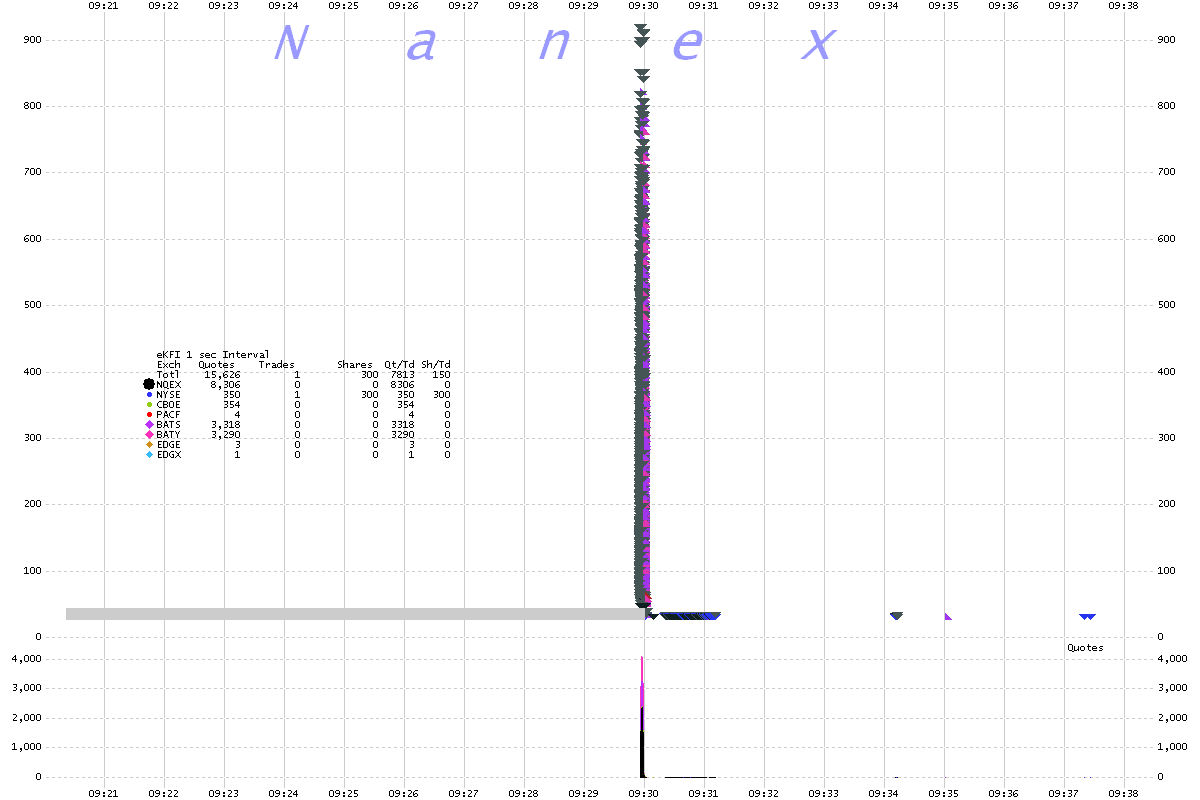
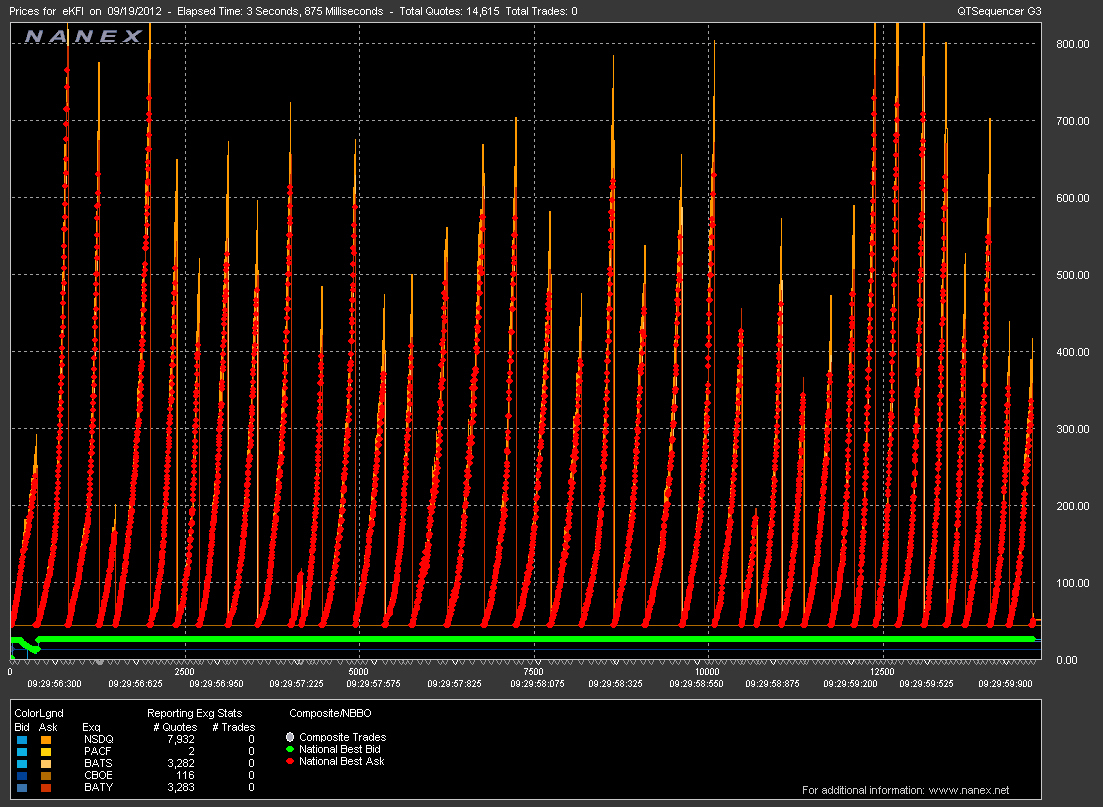
On September 19, 2012, starting 4 seconds before market open and ending at market open,
someone was practicing fading offers with about 14,700 quotes. No trade executions took
place during this exercise.
1. KFI 1 second interval chart showing bids and offers color and NBBO (gray shade)
The quotes line up in a column on a 1 second interval chart. Note the ask price that
ranges from $43.35 to $914.38.
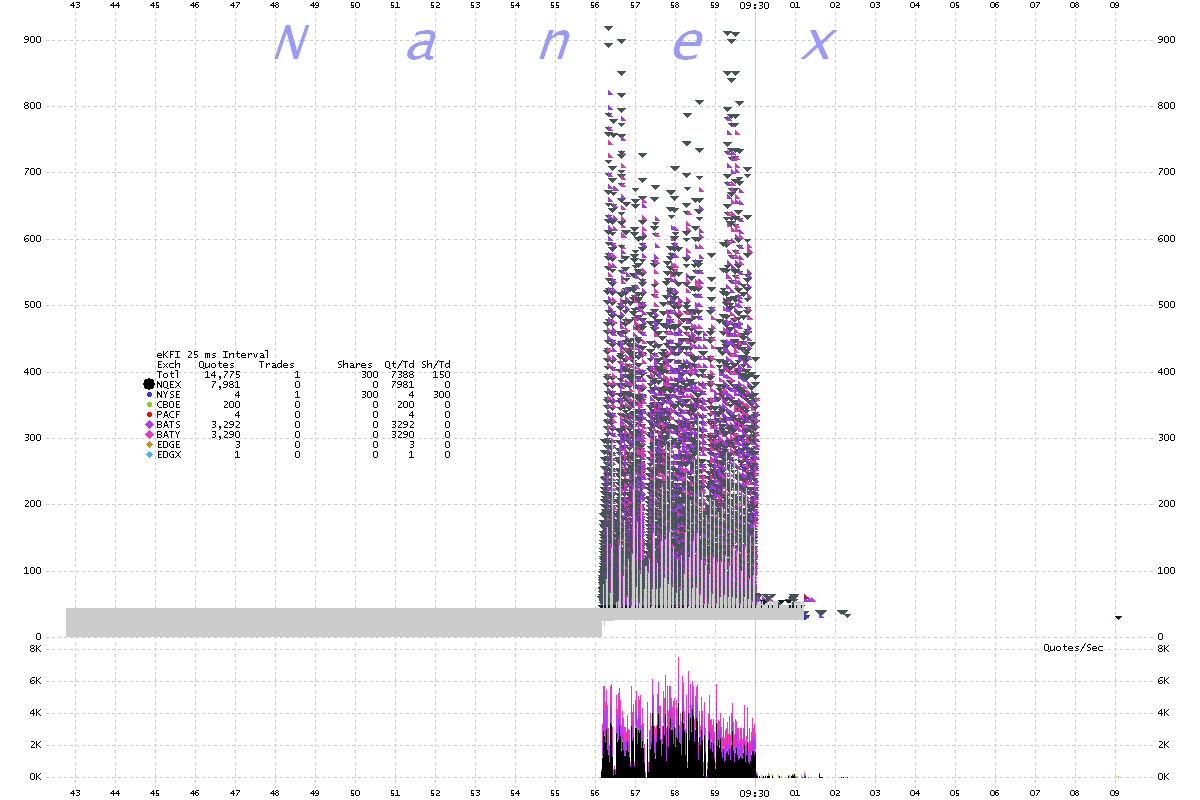
2. KFI 25 millisecond interval chart showing bids and offers color and NBBO (gray shade)
At this resolution, we can make out individul columns.
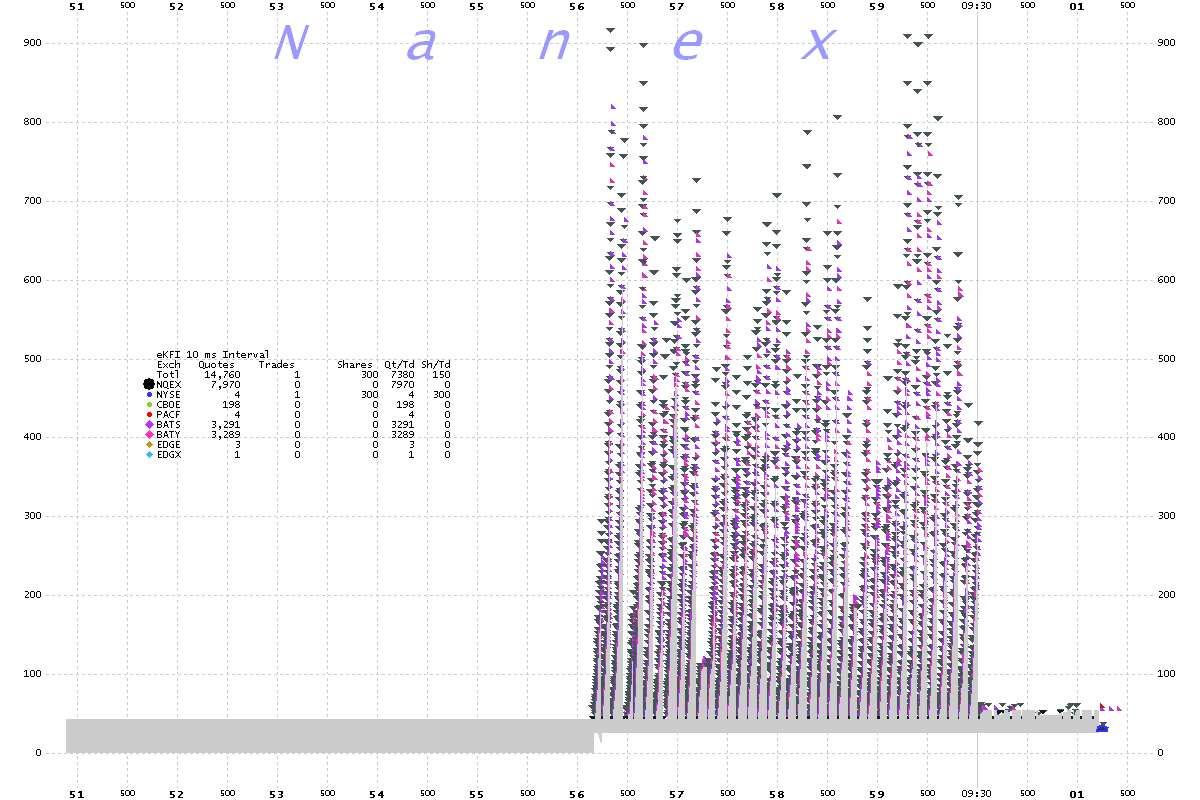
3. KFI 10 millisecond interval chart showing bids and offers color and NBBO (gray shade)
At this resolution, we can see the individual test runs.
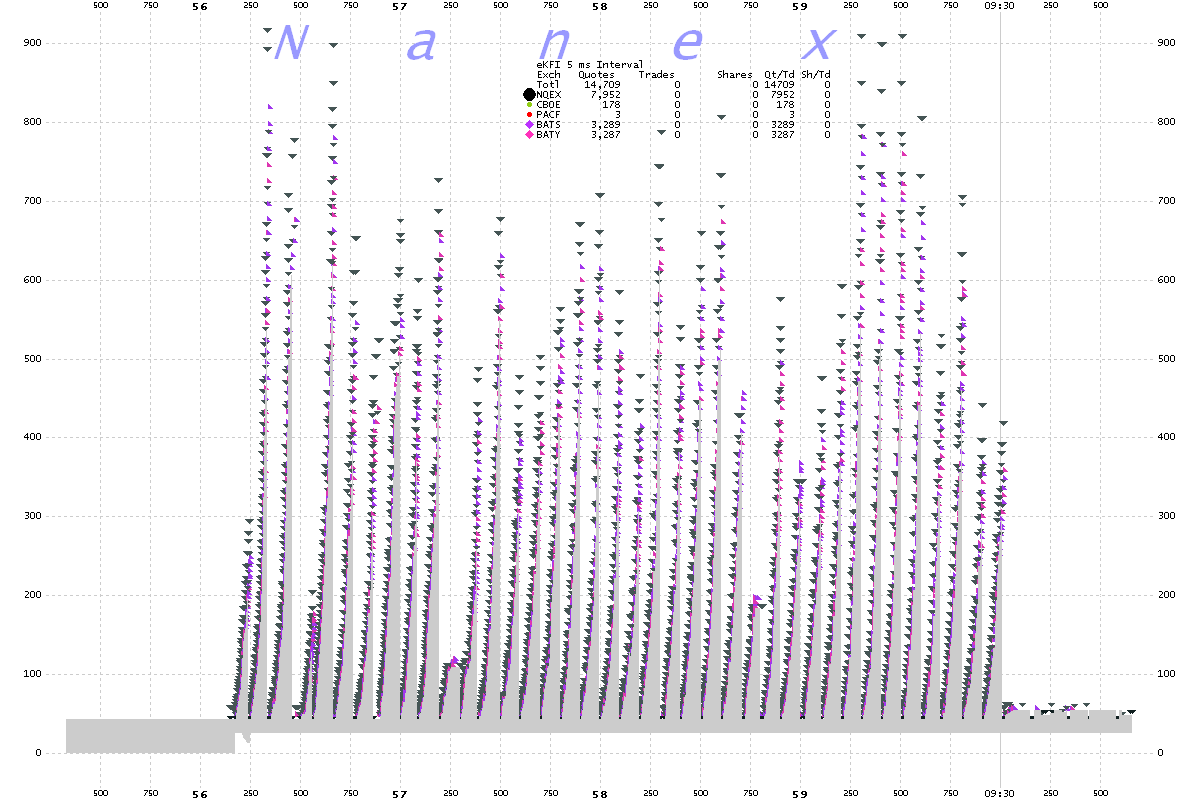
4. KFI 5 millisecond interval chart showing bids and offers color and NBBO (gray shade)
At this resolution, we can count them: there were 38.
5. KFI 1 millisecond interval chart showing bids and offers color and NBBO (gray shade)
Chart shows 1 second of data.
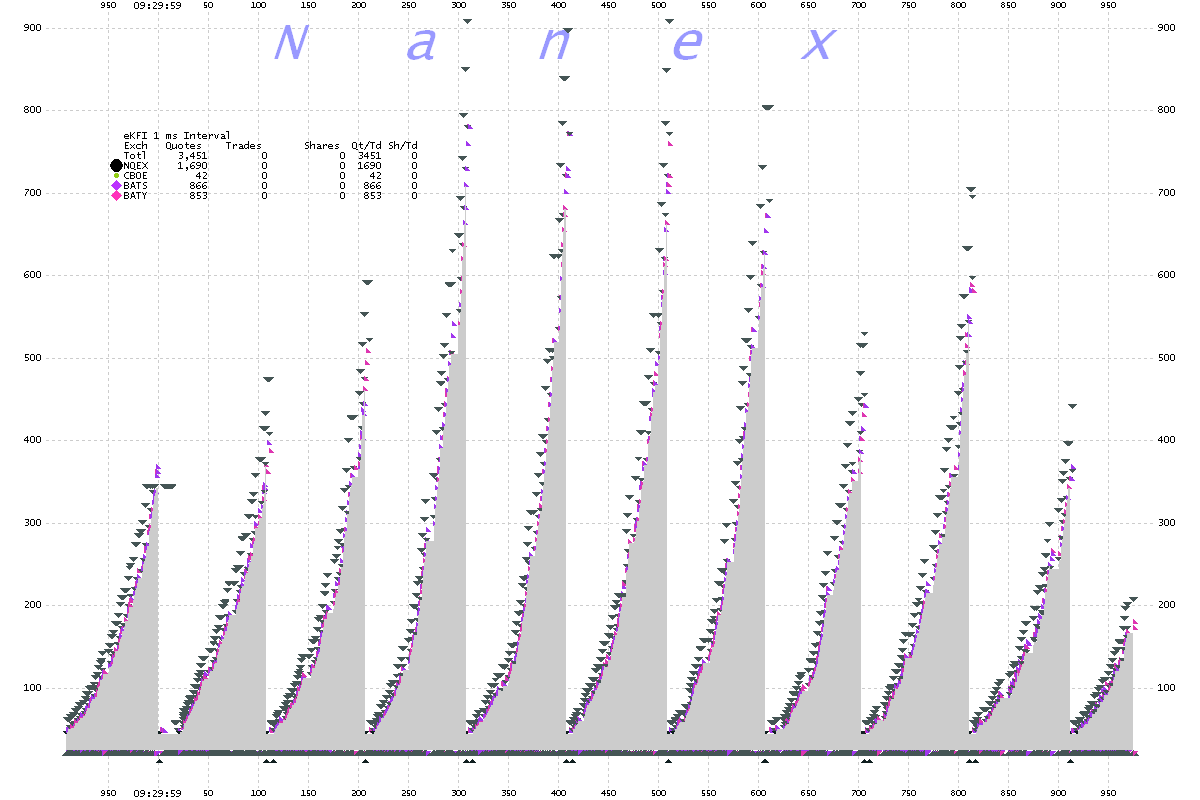
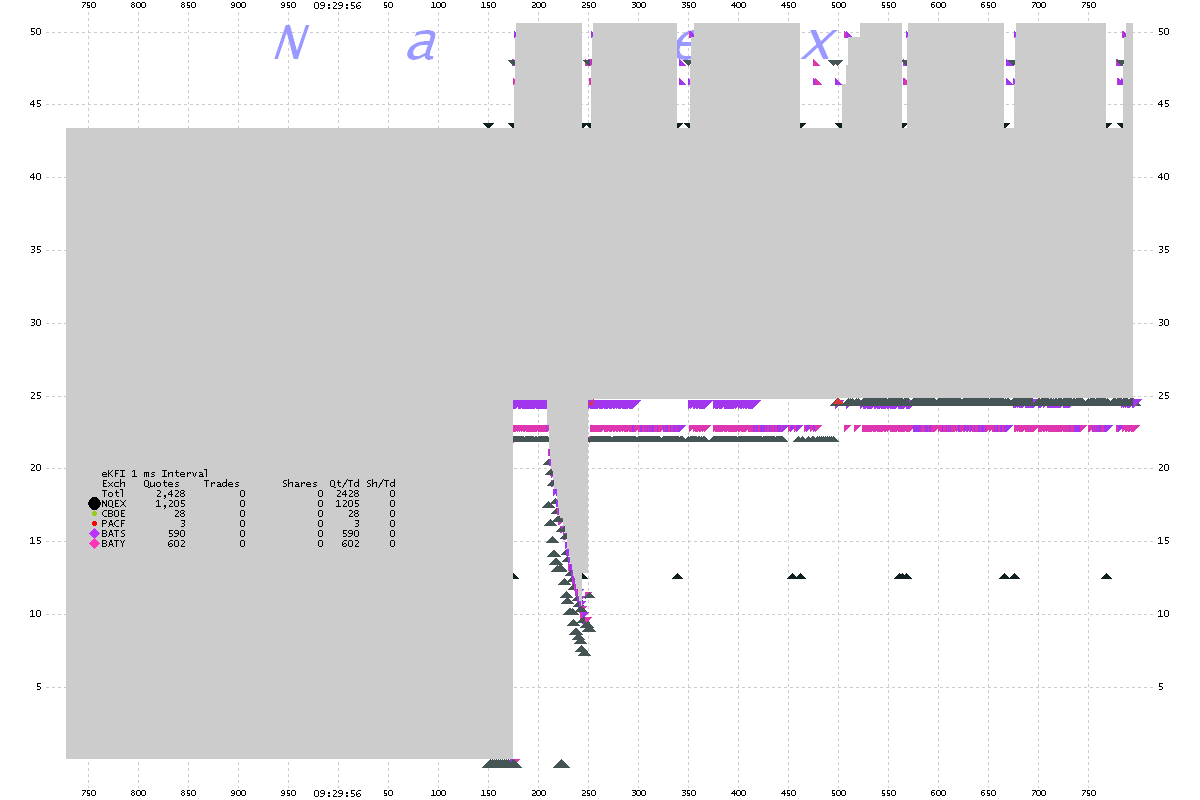
6. KFI 1 millisecond interval chart showing bids and offers color and NBBO (gray shade)
Zooming in on the bid side, we can see the algo practicing dropping the bid price down
to about $6. The lowest bid price? $0.01.
7. KFI Nanex Tick Chart
Nanex Research
Inquiries: pr@nanex.net


