Nanex Research

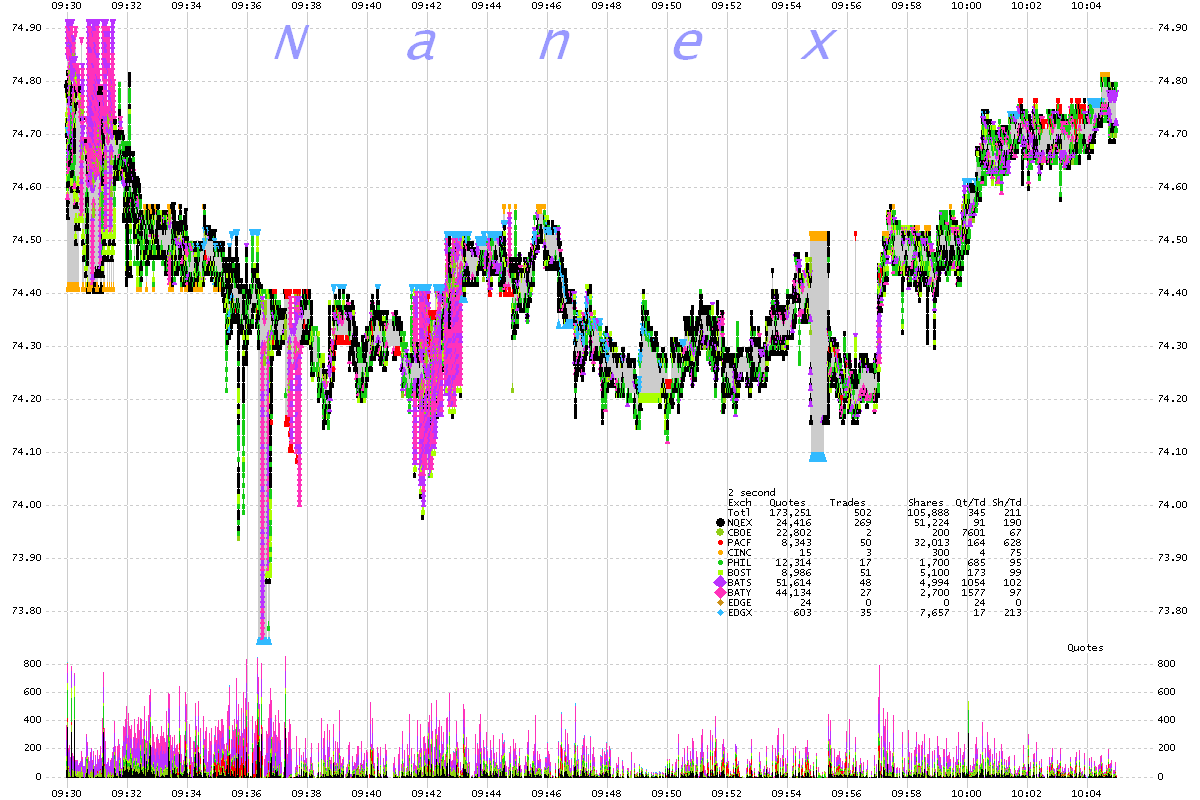
Nanex ~ 29-Jun-2012 ~ Lunacy or Art
Images of SPXL on June 29, 2012.
1. SPXL 2 second interval chart showing bids and offers color coded by exchange.
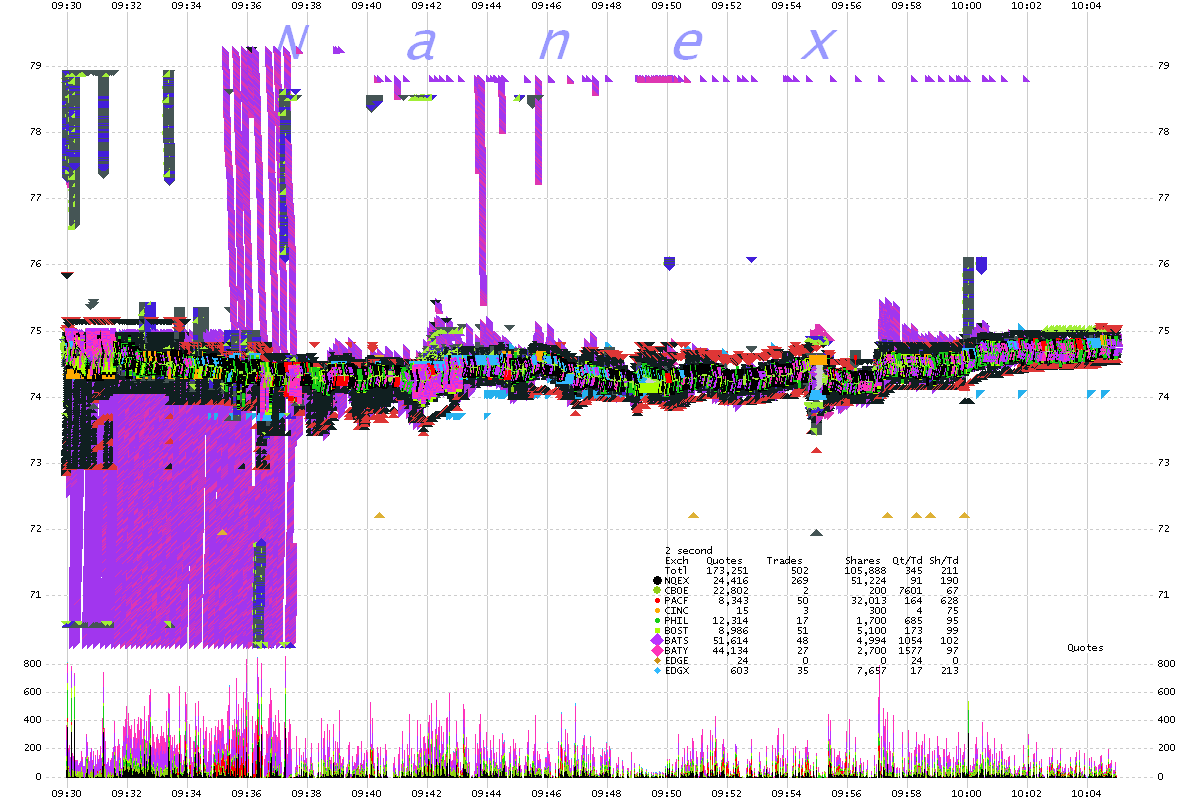
2. SPXL 2 second interval chart showing bids and offers color coded by exchange.
(Zoom of Chart 1)
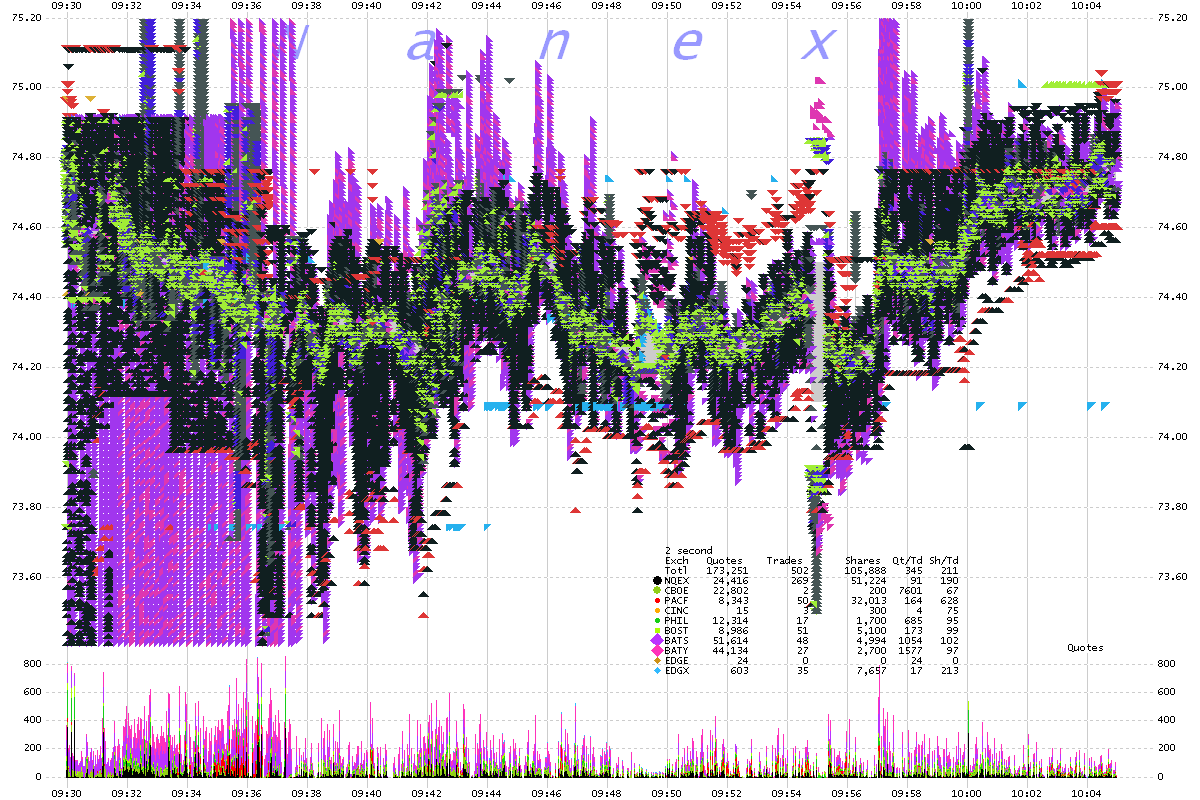
3. SPXL 1 second interval chart showing bids and offers color coded by exchange.
(Zoom of Chart 1)
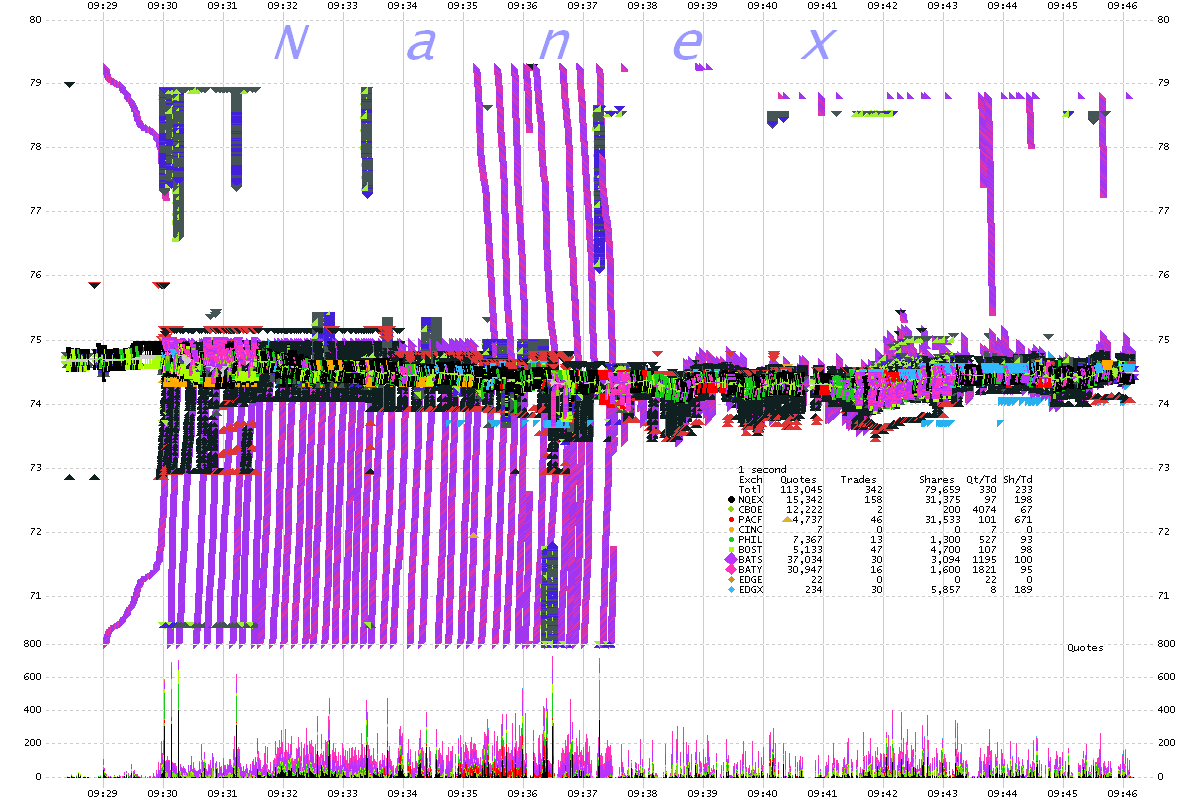
4. SPXL 200 millisecond interval chart showing bids and offers color coded by
exchange. (Zoom of Chart 3)
Tentacles of Doom
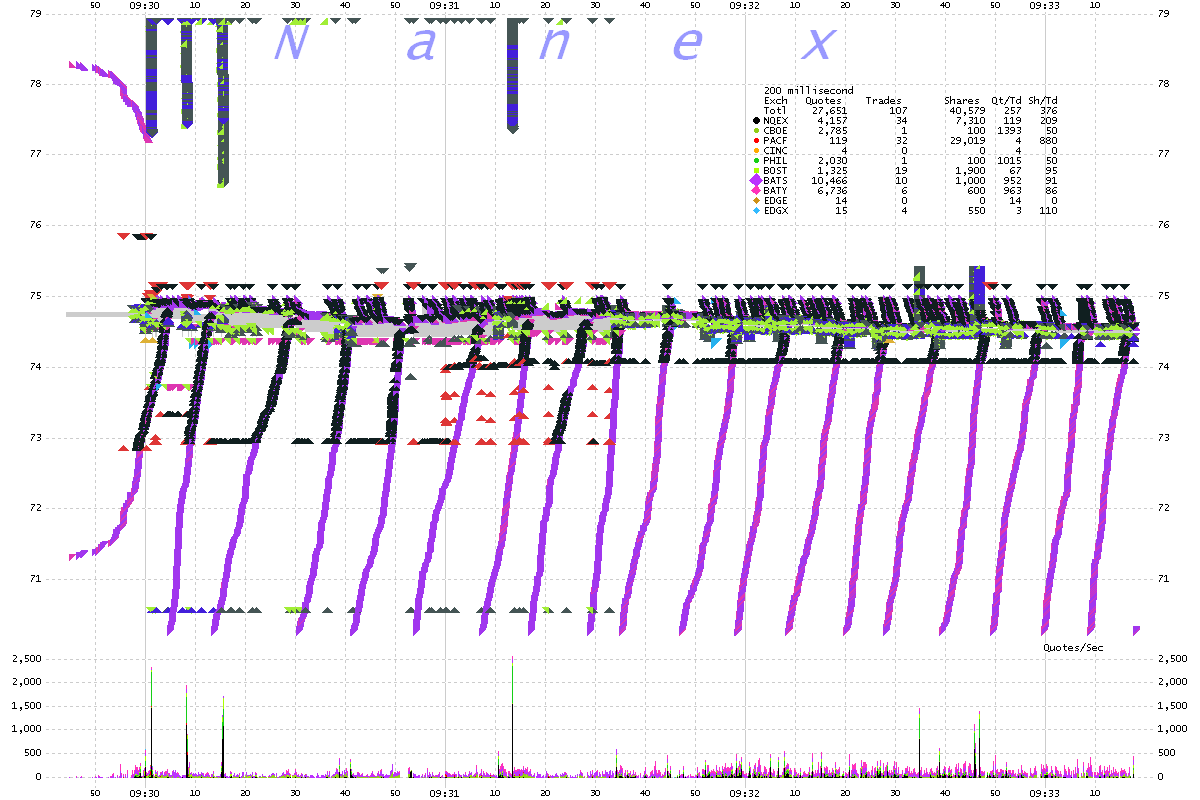
5. SPXL 2 second interval chart showing best bids and offers color.
This is chart 1 after removing quotes that don't set the NBBO. It makes it easier to see the "price discovery".
Kind of.
Nanex Research
Inquiries: pr@nanex.net


