Nanex Research

Nanex ~ 25-Sep-2012 ~ Mandelbrot Quotes
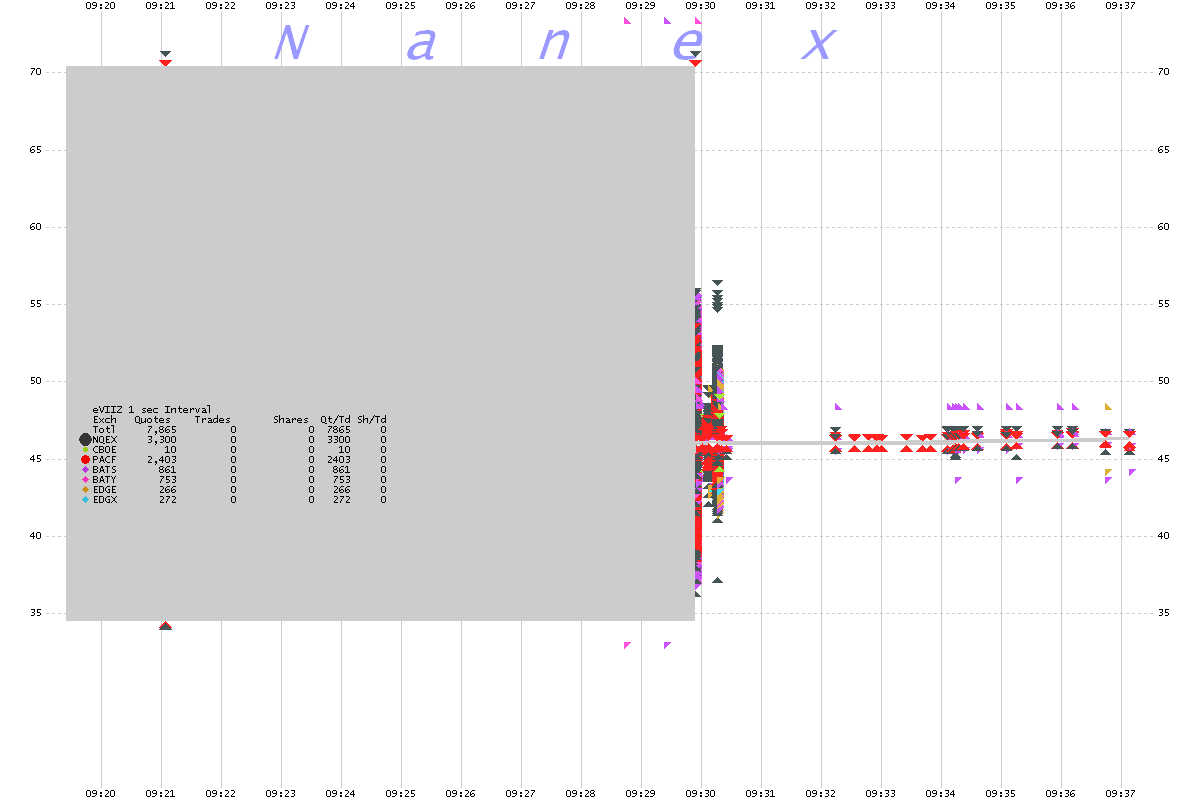
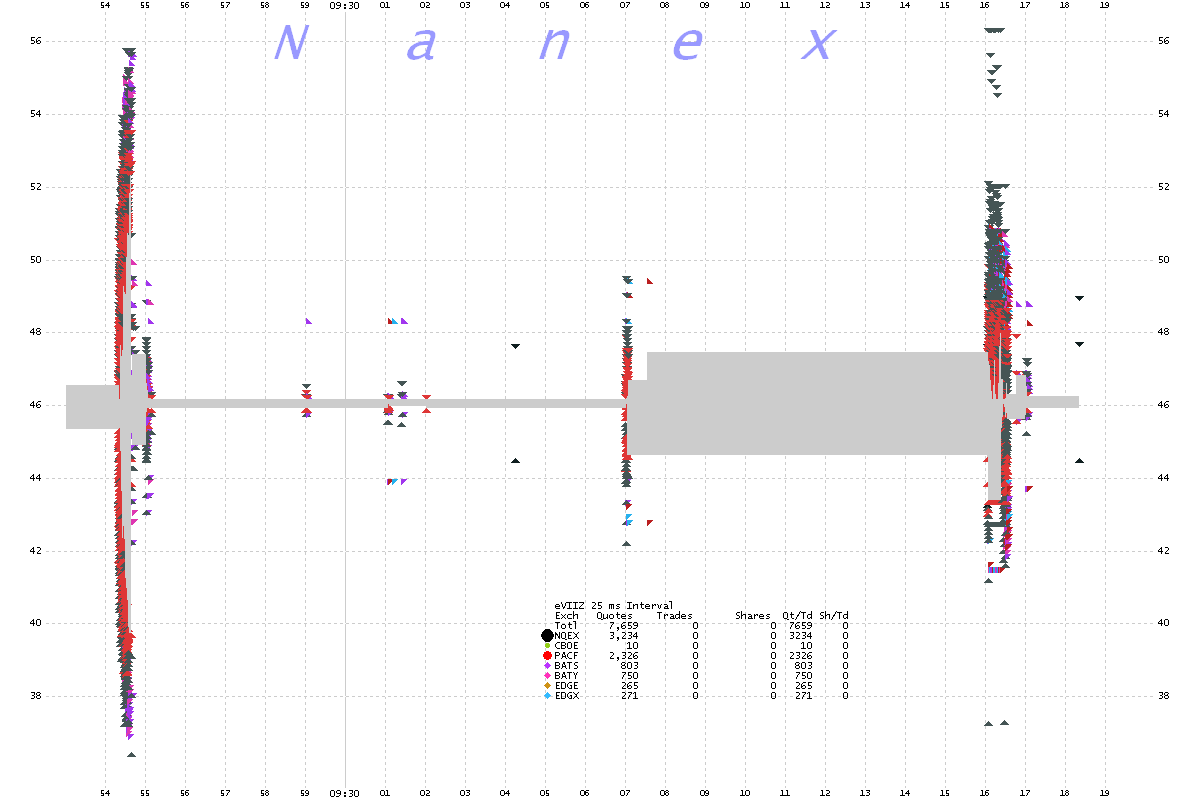
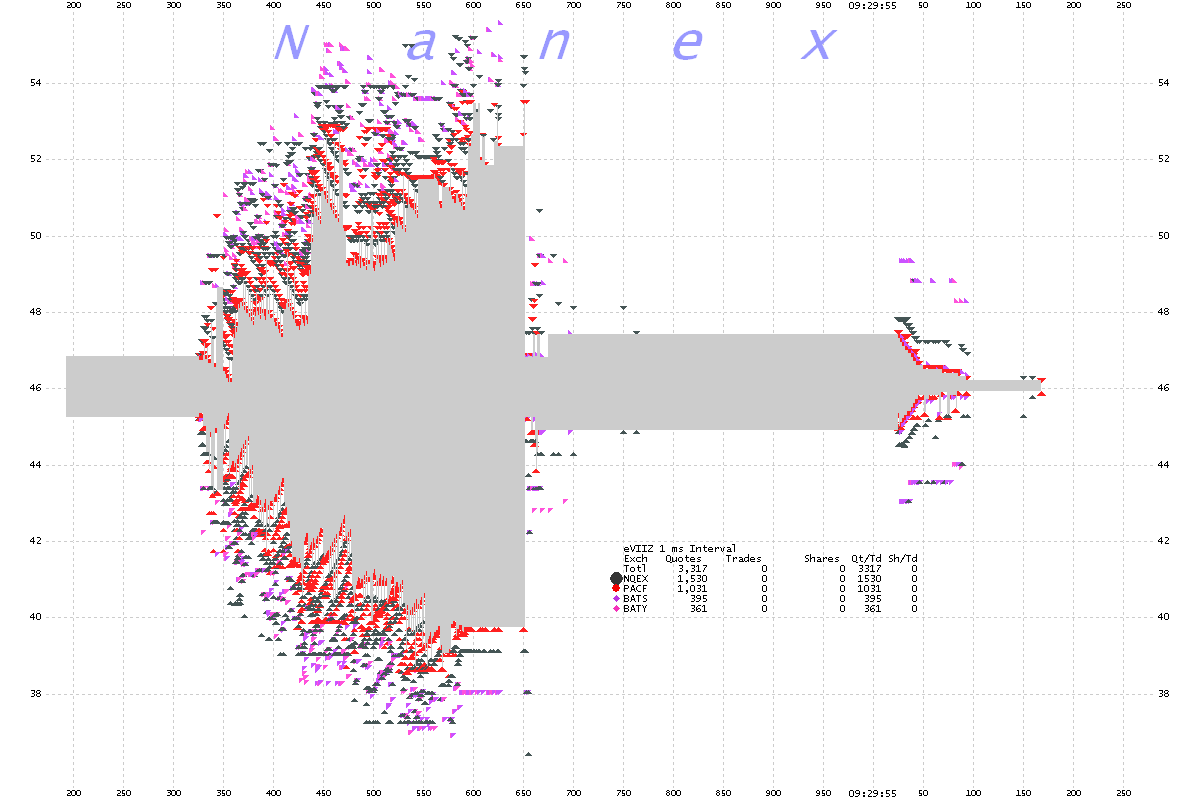
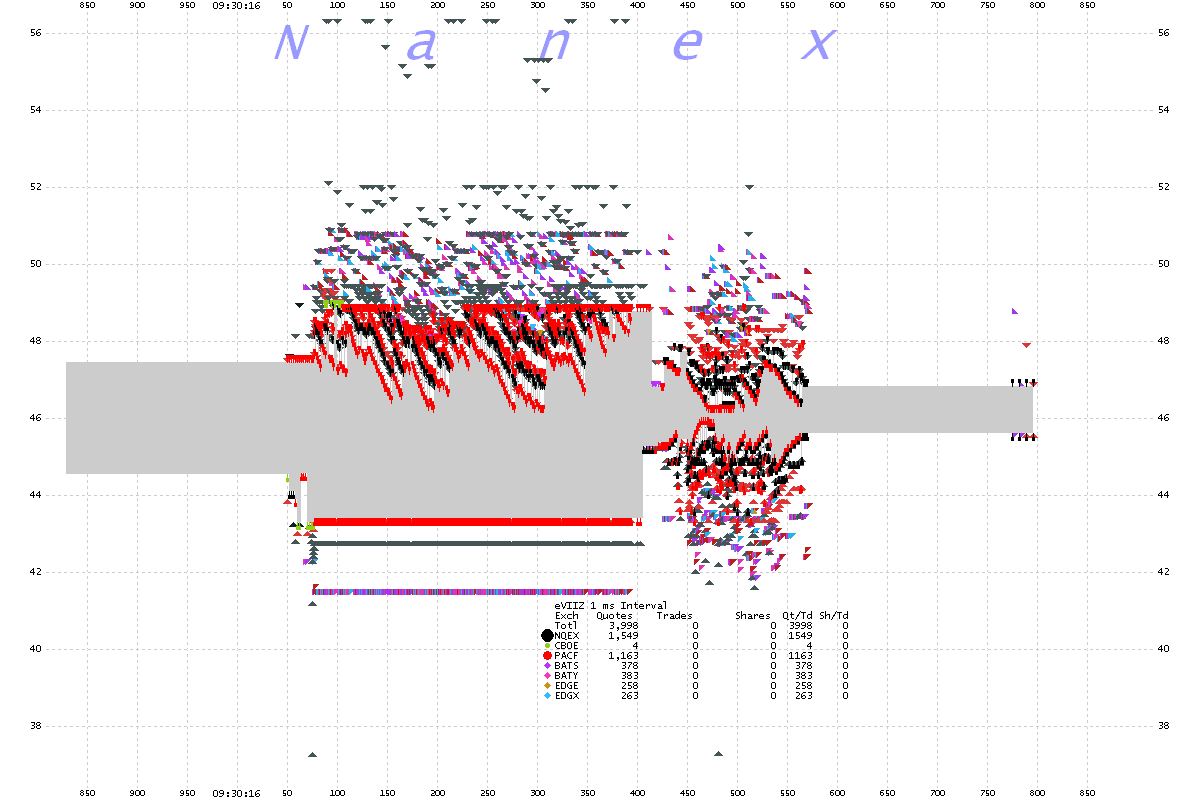
On September 25, 2012, a 1 millisecond interval chart of quotes in the symbol VIIZ appeared
somewhat like an image of the
Mandelbrot Set (see Chart 3). Only 2 trades executed over the
time periods shown below. A good deal of this quote noise occurred during very active
trading (in other symbols).
1. VIIZ 1 second interval chart showing trades color coded by exchange and NBBO spread.
2. VIIZ 25 millisecond interval chart showing trades color coded by exchange and NBBO spread.
3. VIIZ 1 millisecond interval chart showing trades color coded by exchange and NBBO spread.
4. VIIZ 1 millisecond interval chart showing trades color coded by exchange and NBBO spread.
5. VIIZ 1 second interval chart showing the 2 trades.
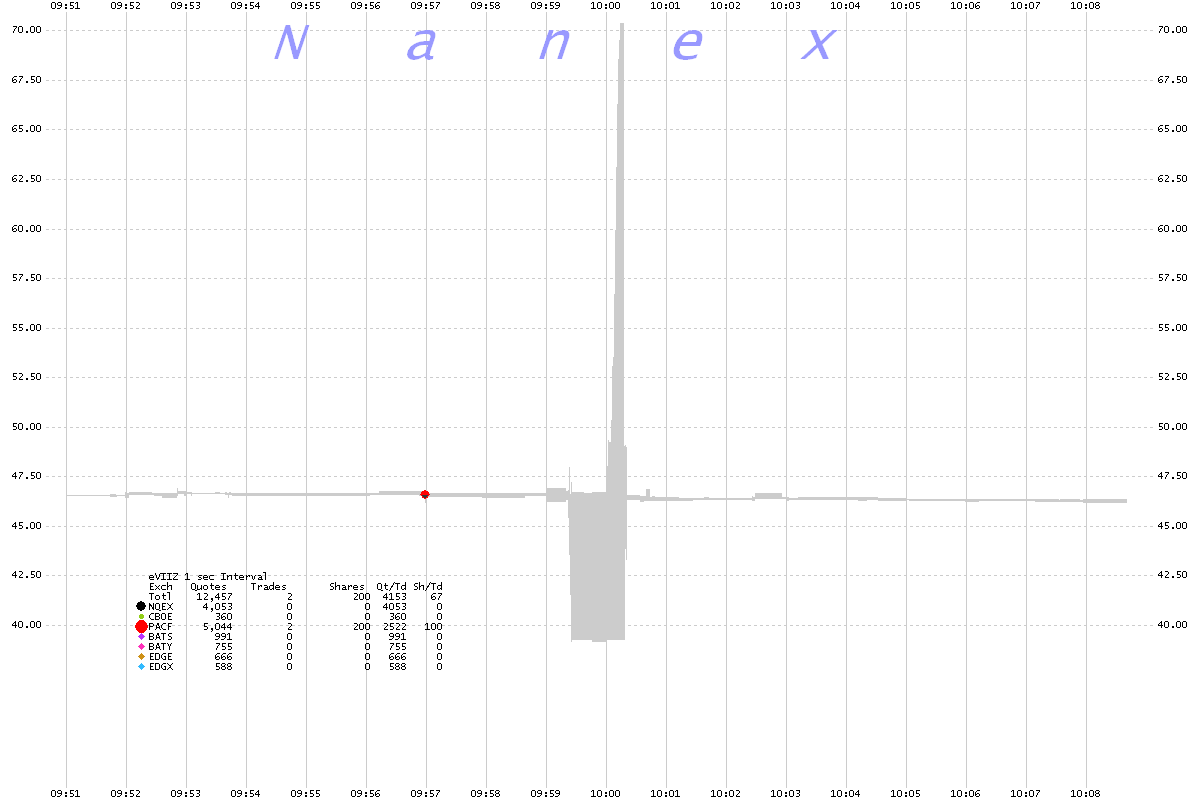
6. VIIZ 1 second interval chart showing trades color coded by exchange and NBBO spread.
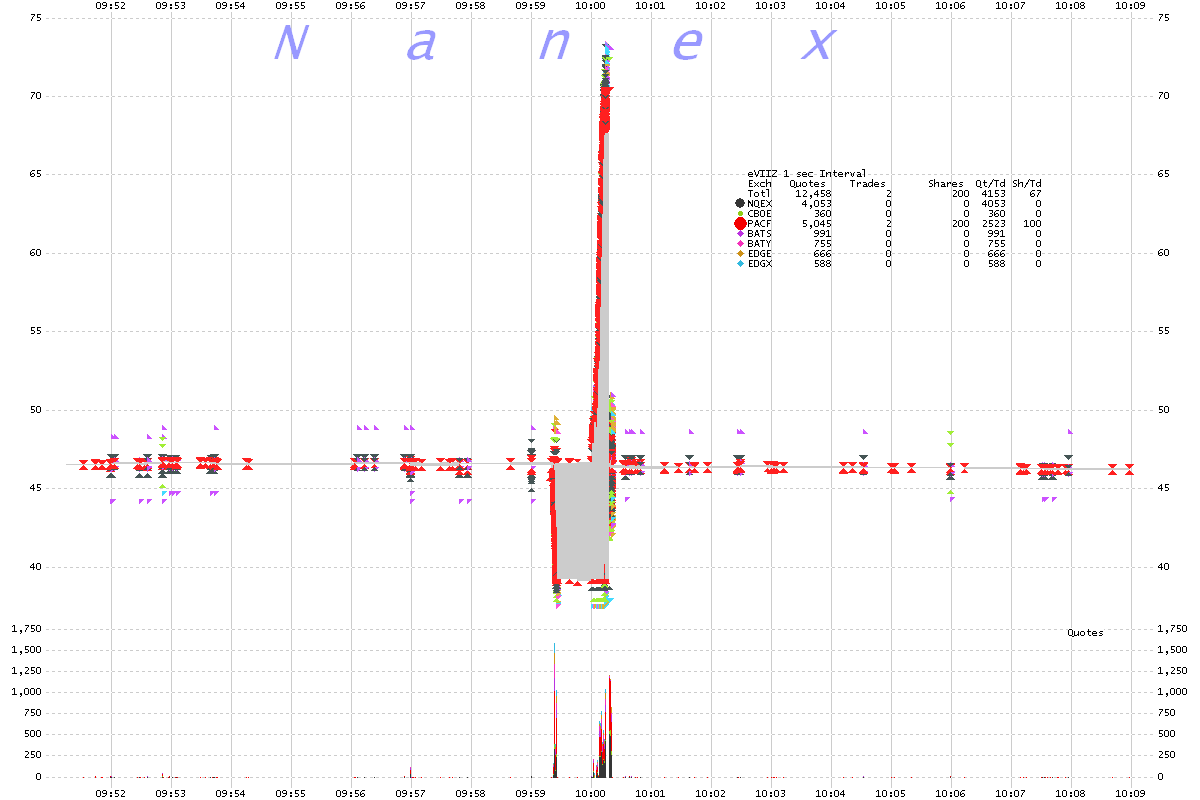
7. VIIZ 100 millisecond interval chart showing trades color coded by exchange and NBBO spread.
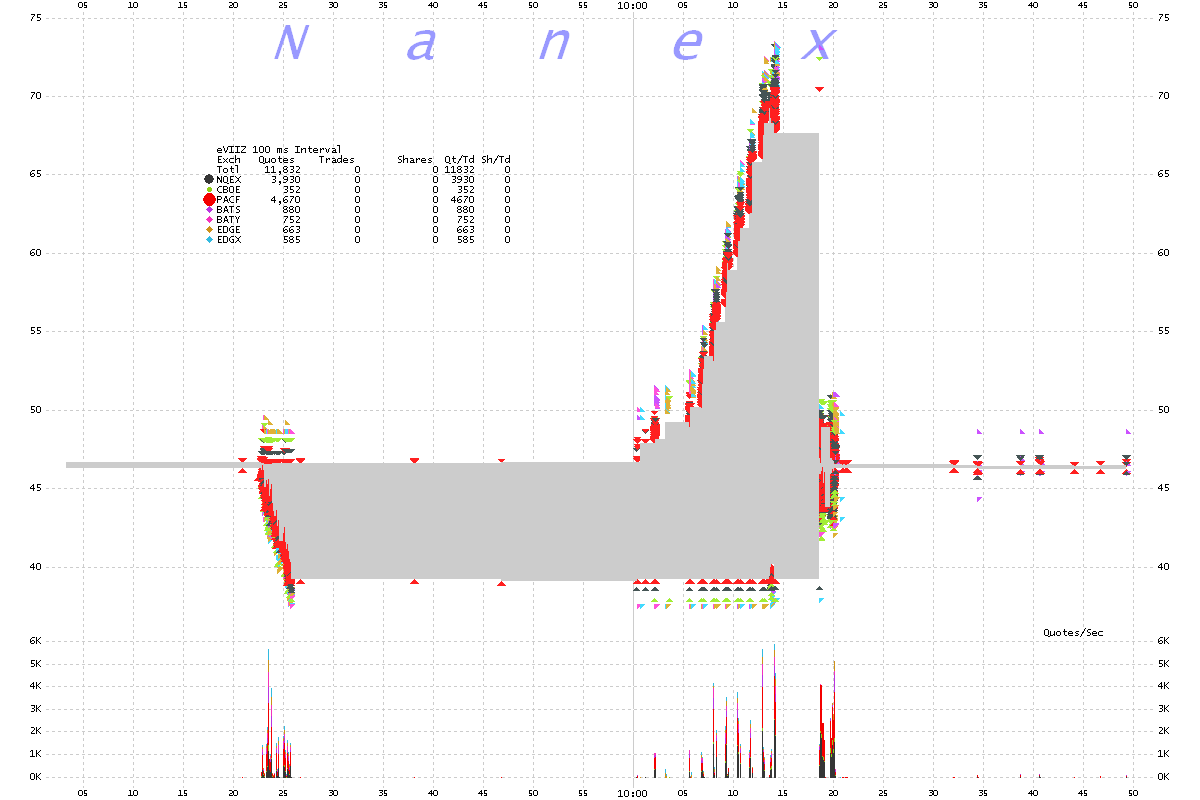
8. VIIZ 2 millisecond interval chart showing trades color coded by exchange and NBBO spread.
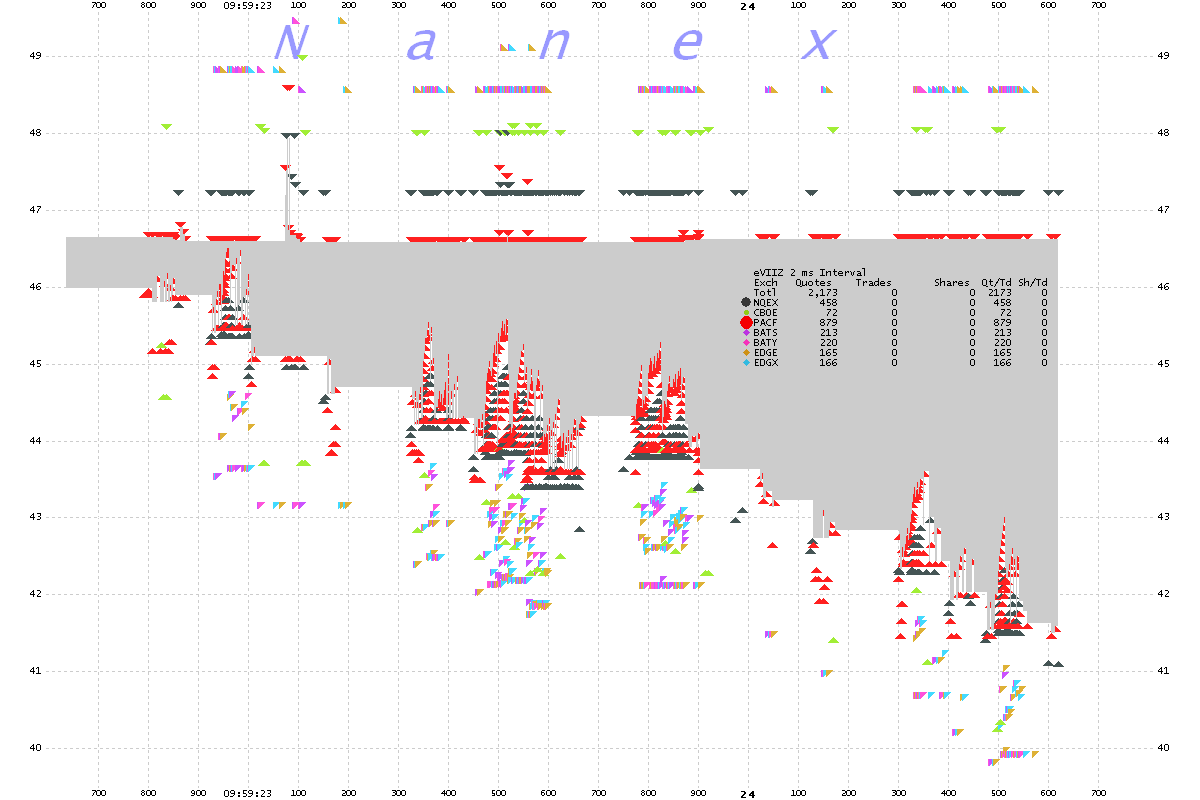
9. VIIZ 25 millisecond interval chart showing trades color coded by exchange and NBBO spread.
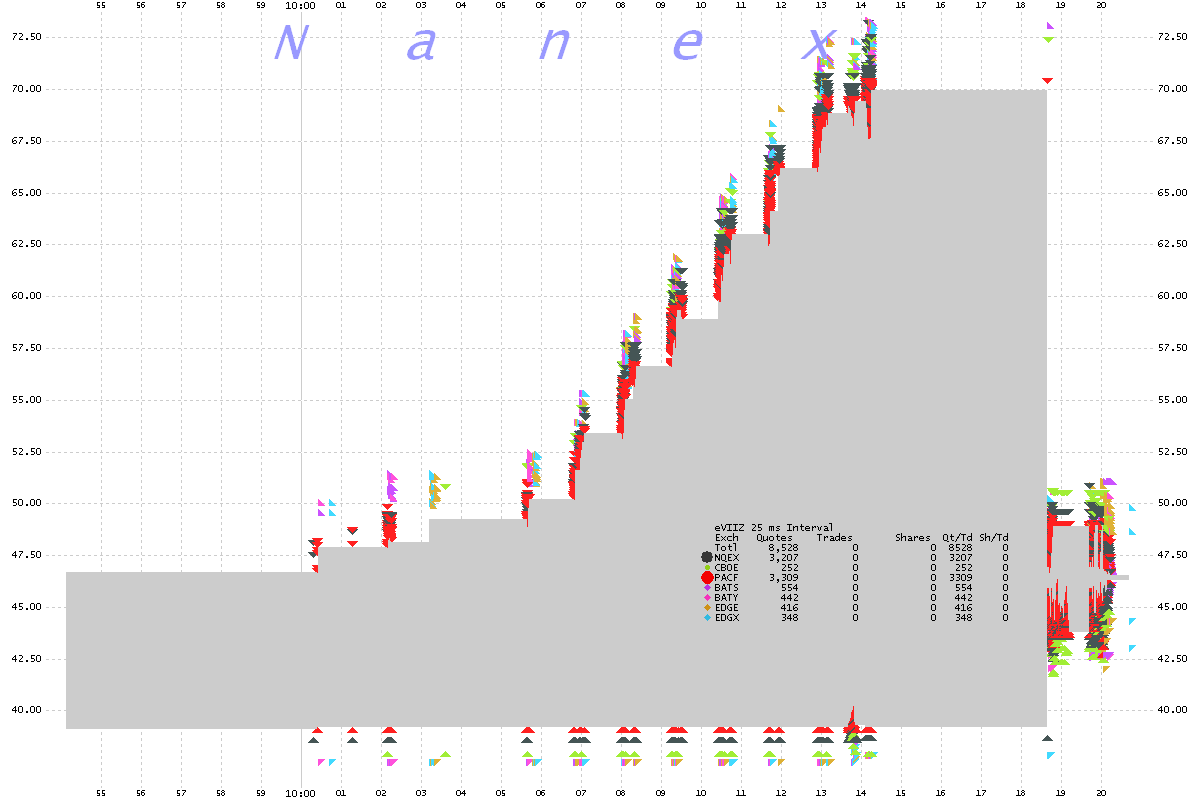
10. VIIZ 2 millisecond interval chart showing trades color coded by exchange and NBBO spread.
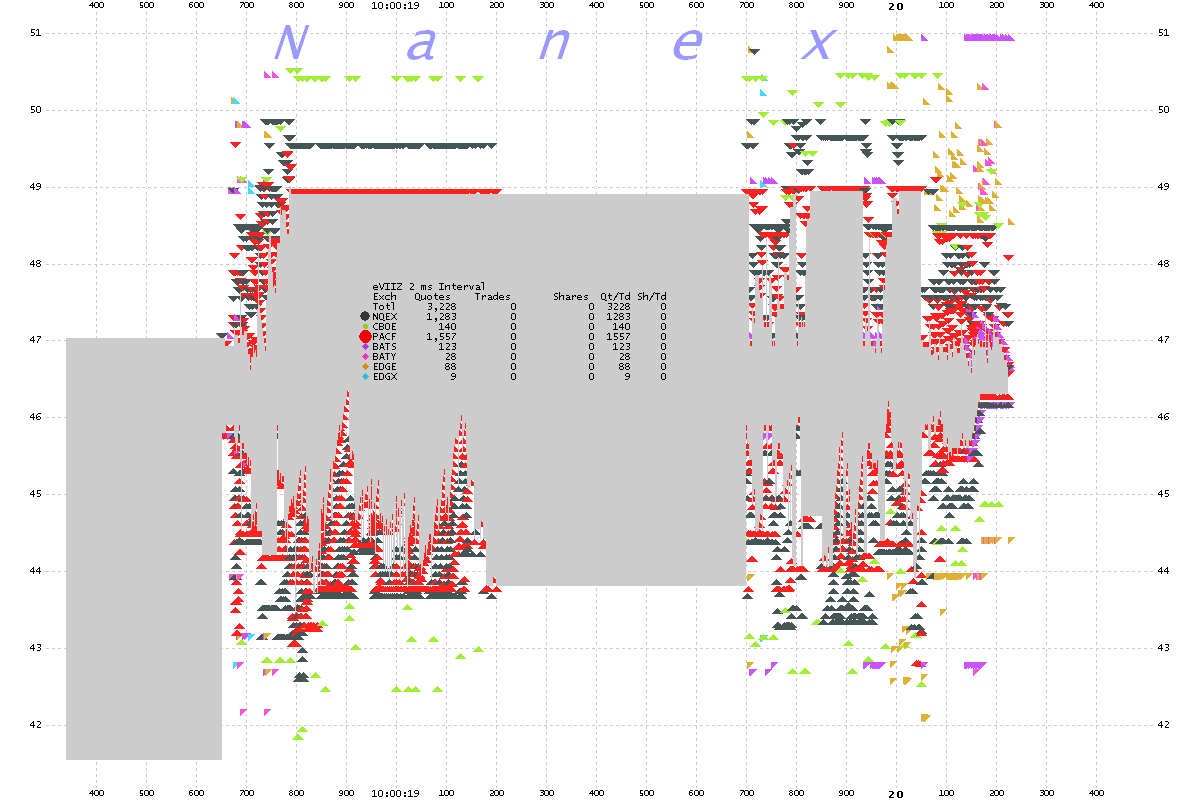
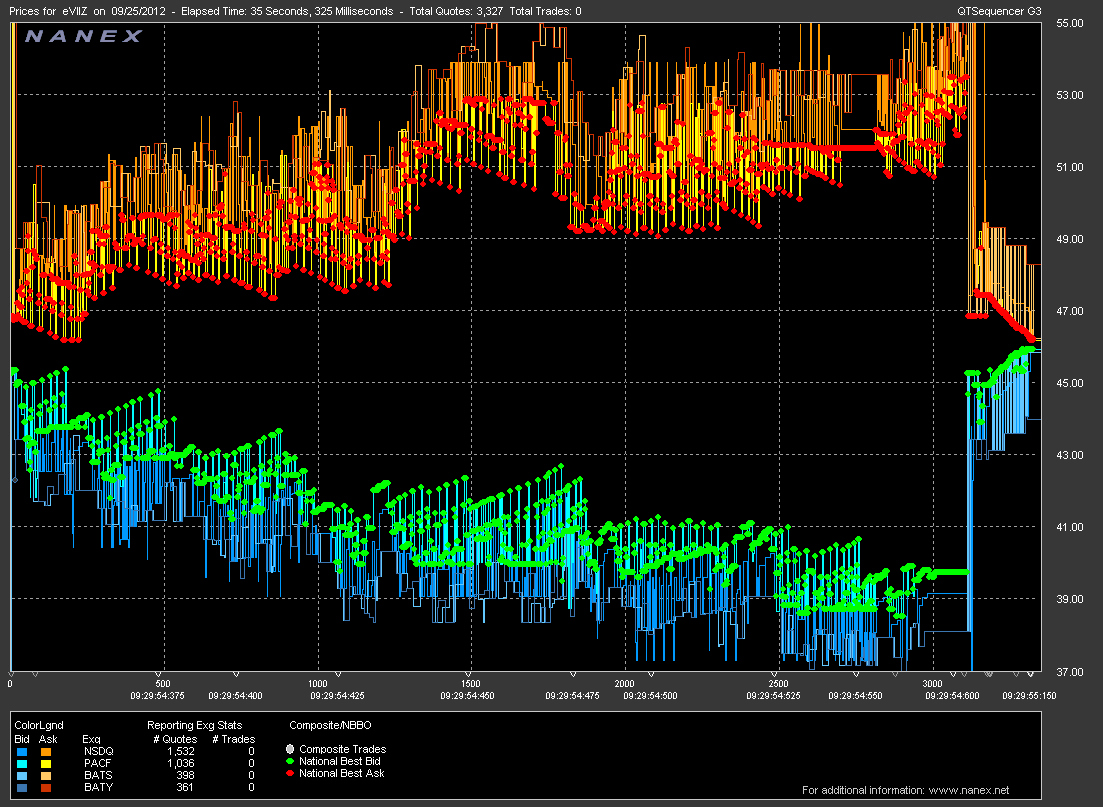
11. VIIZ - Nanex Tick Chart.
Nanex Research
Inquiries: pr@nanex.net


