Nanex Research

Nanex ~ 25-Sep-2012 ~ Whac-A-Mole is Manipulation

On September 25, 2012, FINRA issued a press release: FINRA Joins Exchanges and the SEC in Fining Hold Brothers More Than $5.9 Million for Manipulative Trading, Anti-Money Laundering, and Other Violations.

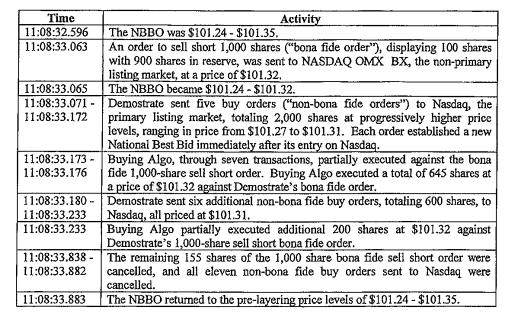
One of the links in the press release gave information about a manipulative cross-market layering activity on page 4 under the section Spoofing and Layering. Included in this section was a table (shown on the right) of information about one of these manipulative events.

We used the information in the table to search our database of trades and quotes for June 4, 1010 (the date that was indicated in the text) to determine which symbol was involved. Minutes later, the program spit out the symbol GWW which is listed on the NYSE (the table mistakenly states Nasdaq is the listing market).

Then we ran another program which created a few sub-second charts of GWW during this event so that we could get a look at this algo visually. When we first saw the charts, we were stunned, because we have seen this pattern before, and gave it the name "whac-a-mole".

See also: Other manipulation patterns.

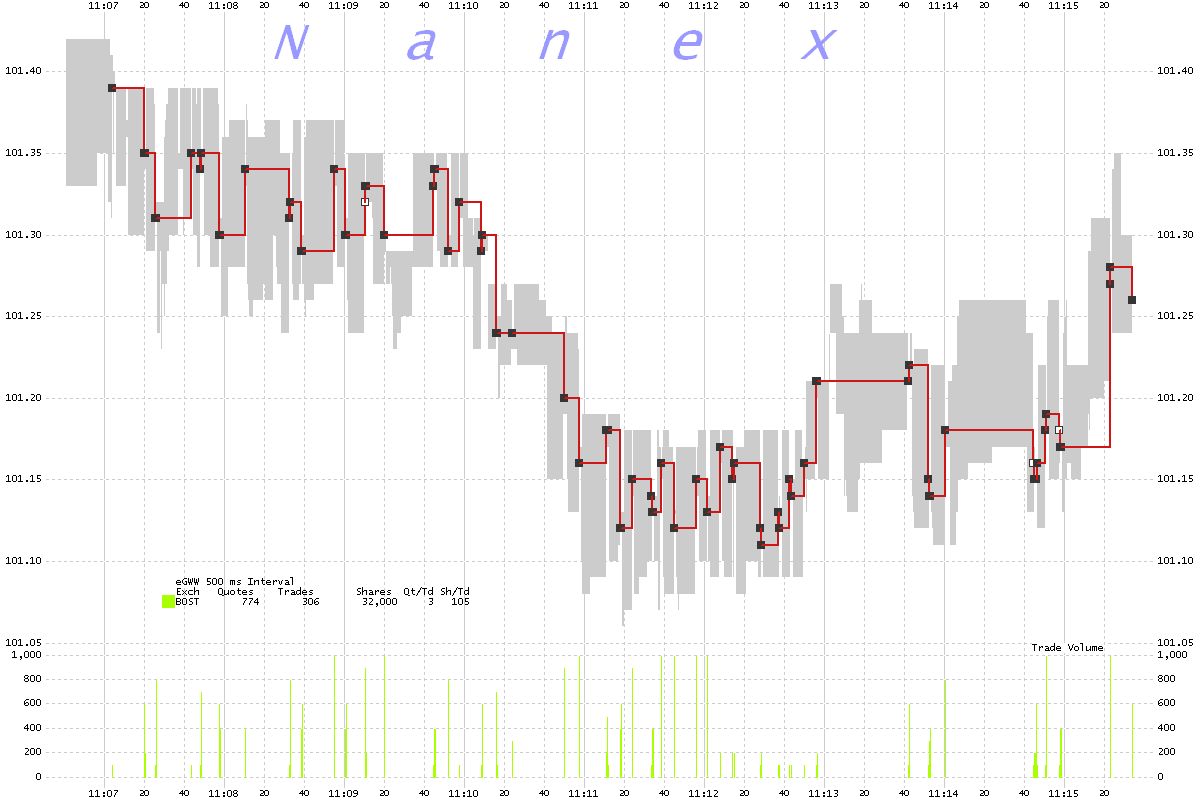
1. GWW 500 millisecond interval chart showing NQ-BX trades (squares, connected by a red line) and the NBBO (gray shading).


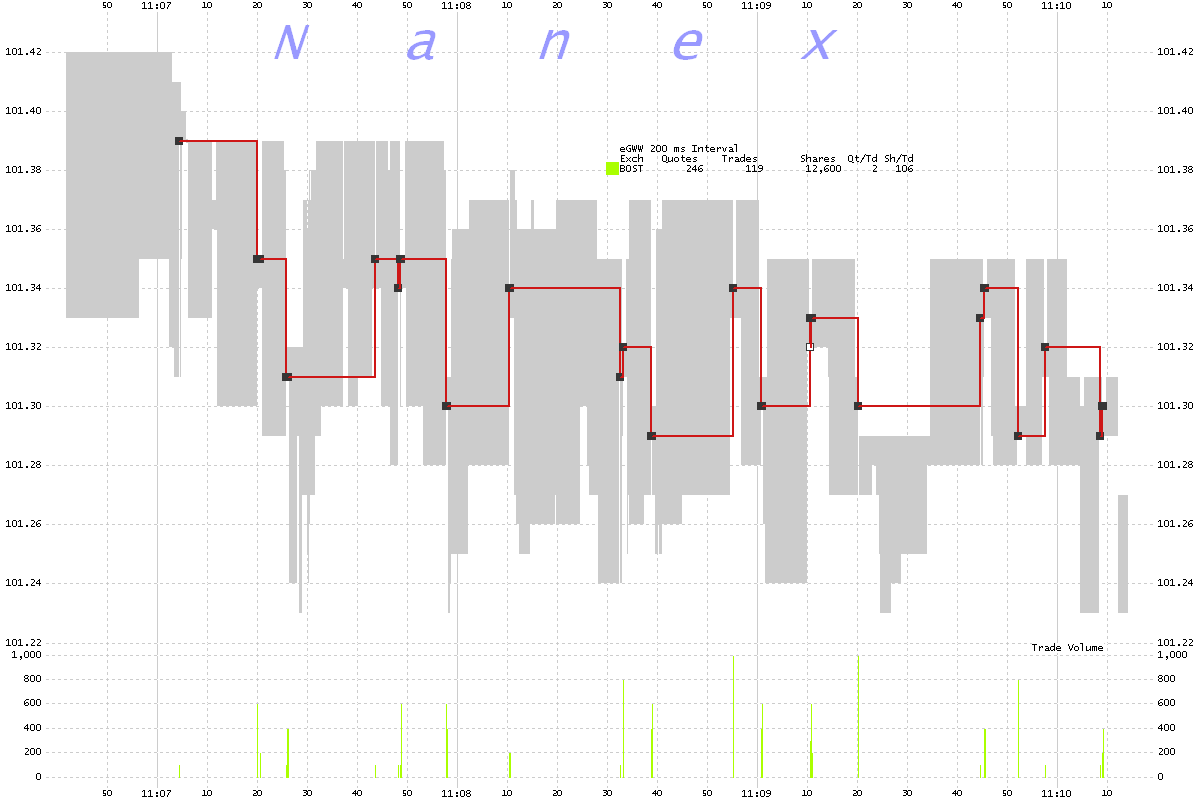
2. GWW 200 millisecond interval chart showing NQ-BX trades (squares, connected by a red line) and the NBBO (gray shading).


Later in the day, the SEC came out with their own order which, among other things, reveals the symbol is in fact GWW! Follow along from page 6 of the SEC order.

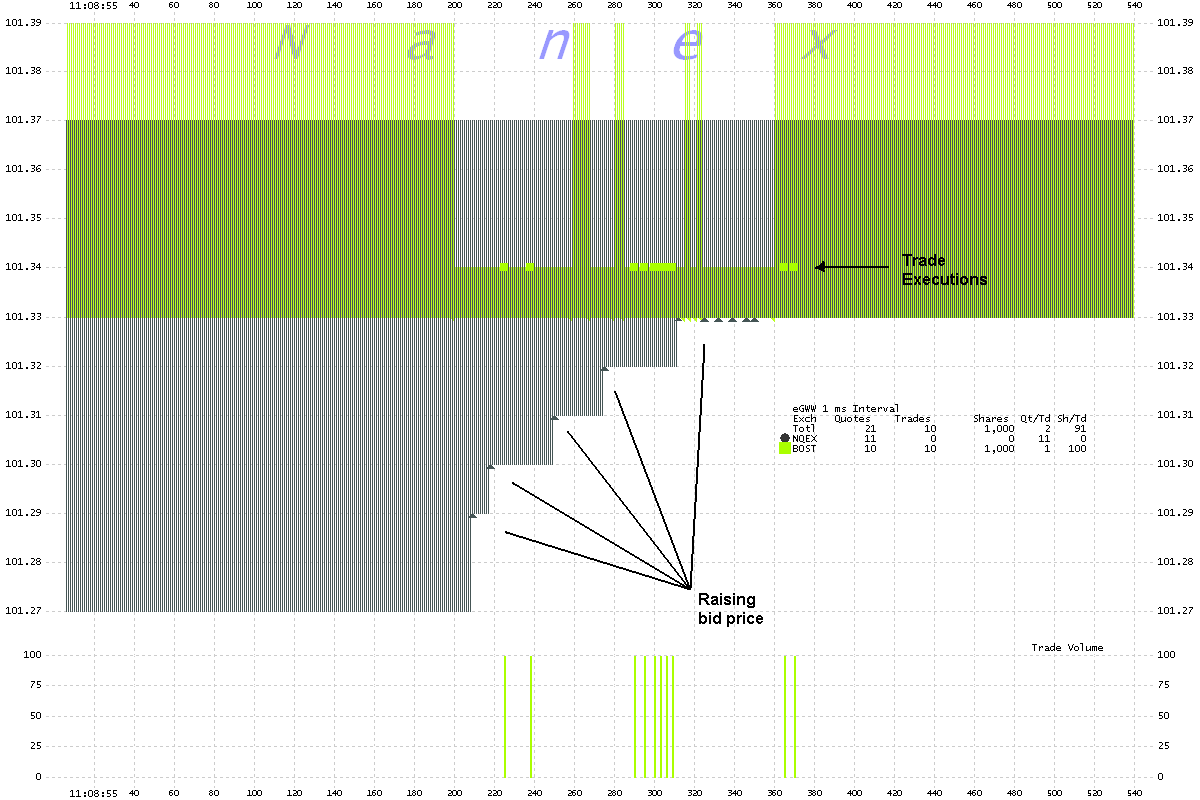
25. That day, at 11:08:55.152 a.m., the trader placed an order to sell 1,000 GWW shares at $101.34 per share. Prior to the trader placing the order, the inside bid was $101.27 and the inside ask was $101.37. The trader’s sell order moved the inside ask to $101.34. From 11:08:55.164 a.m. to 11:08:55.323 a.m., the trader placed eleven orders offering to buy a total of 2,600 GWW shares at successively increasing prices from $101.29 to $101.33. During this time, the inside bid rose from $101.27 to $101.33, and the trader sold all 1,000 shares she offered to sell for $101.34 per share, completing the execution at 11:08:55.333. At 11:08:55.932, less than a second after the trader placed the initial buy order, the trader cancelled all open buy orders. At 11:08:55.991, once the trader had cancelled all of her open buy orders, the inside bid reverted to $101.27 and the inside ask reverted to $101.37.
3. GWW 1 millisecond interval chart showing Quote spread from Nasdaq (gray) and NQ-BX (green)


Continuing along on page 6 of the SEC order.

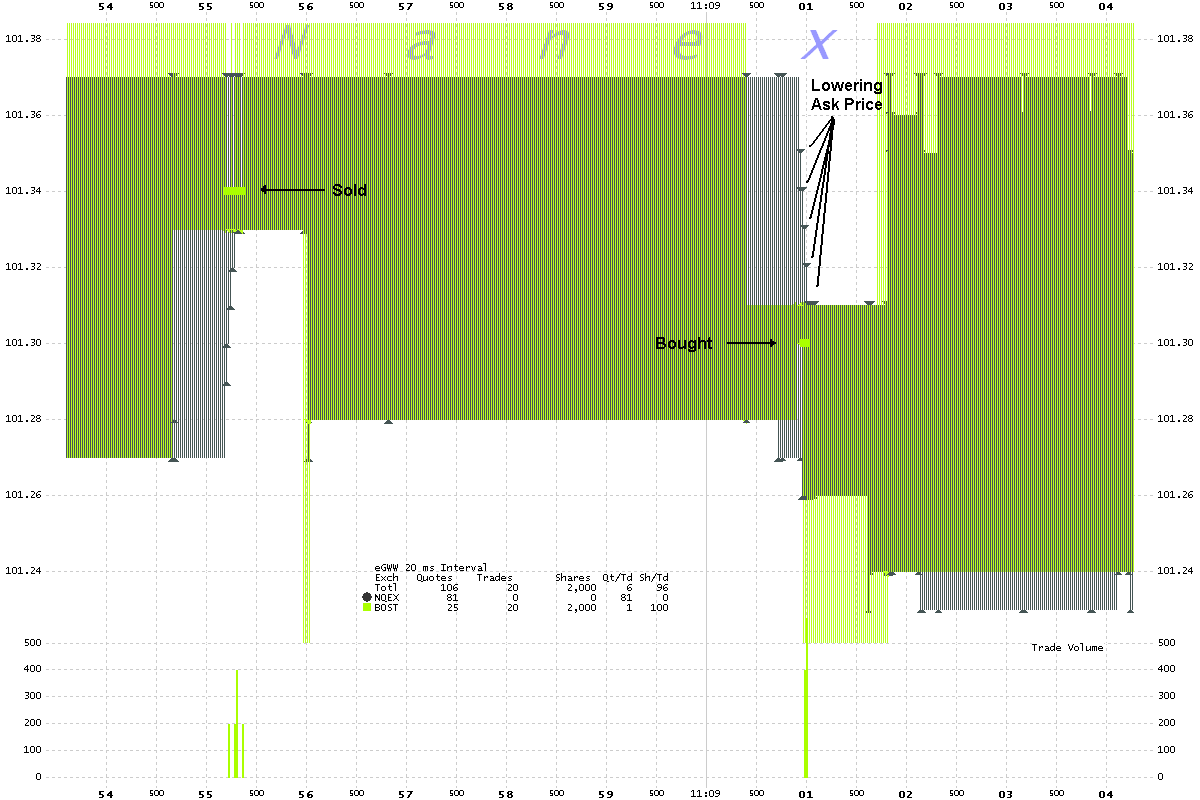
26. Because the trader was now short 1,000 GWW shares, at 11:09:00.881, the trader placed an order to buy 1,000 GWW shares at $101.30, thereby changing the inside bid to $101.30. From 11:09:00.929 a.m. to 11:09:01.060 a.m., the trader placed eleven orders offering to sell a total of 2,600 GWW shares at successively decreasing prices from $101.35 to $101.31. During this time, the inside ask declined from $101.37 to $101.31, and the trader bought all 1,000 GWW shares she offered to buy for $101.30 per share, completing the execution at 11:09:00.977. At 11:09:01.662, less than a second after the trader placed the initial sell order, the trader cancelled all open sell orders. At 11:09:01.792, once the trader had cancelled all of her open sell orders, the inside bid reverted to $101.24 and the inside ask reverted to $101.37. This round trip transaction, which took less than seven seconds to complete, yielded the trader approximately $40. As described below, this strategy was repeated over and over again.

4. GWW 20 millisecond interval chart showing Quote spread from Nasdaq (gray) and NQ-BX (green). Follow along with the text in paragraph 26 with the right half of the chart.


Links to some of the other "Whac-a-mole" instances we have found:

Links to similar events, most of which still remain a mystery for the SEC or CFTC to solve.


Nanex Research

Inquiries: pr@nanex.net