Nanex Research

Nanex ~ 26-Sep-2012 ~ Testing Market Manipulation Software
We see evidence of HFT manipulation and testing of manipulation techniques all the time.
Here are a few, which come right on the heels of the
SEC declaring this to be manipulative, illegal behavior. Charts
are from September 26, 2012.
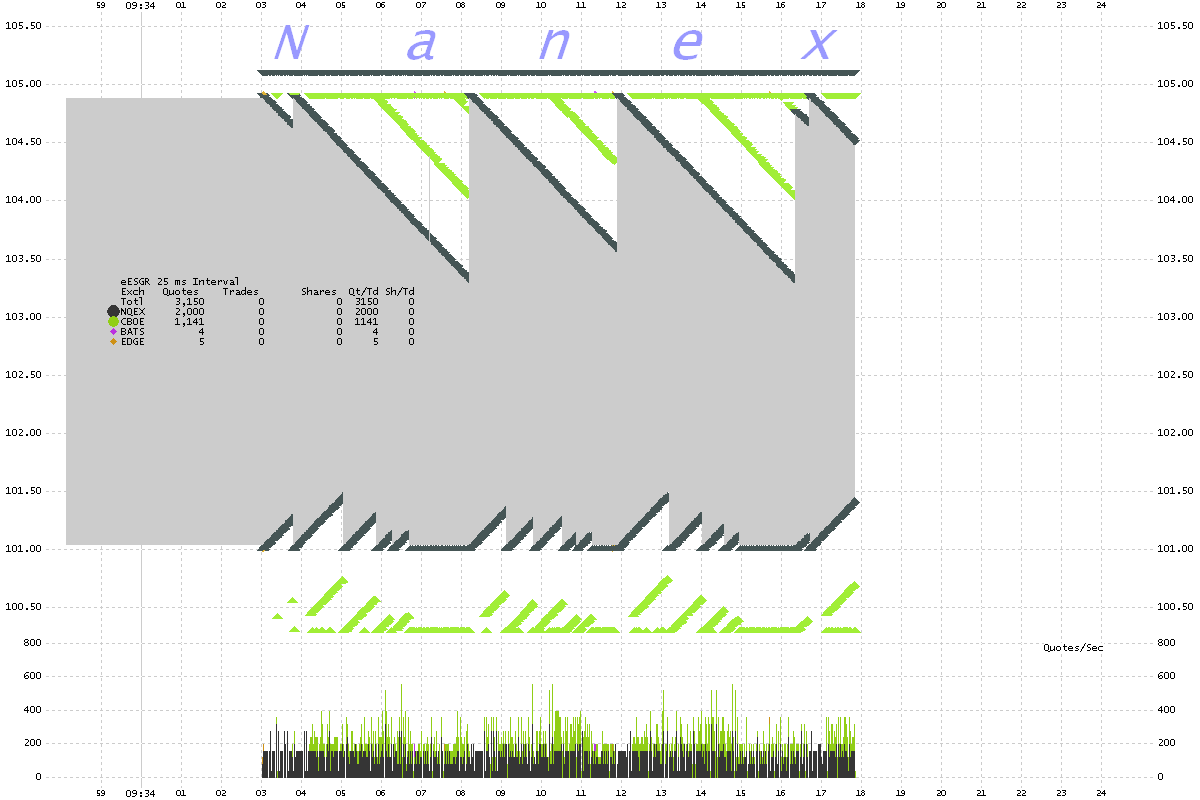
1. Layering Software Test
ESGR 25 millisecond interval chart showing quotes color coded by exchange and NBBO (gray shading).
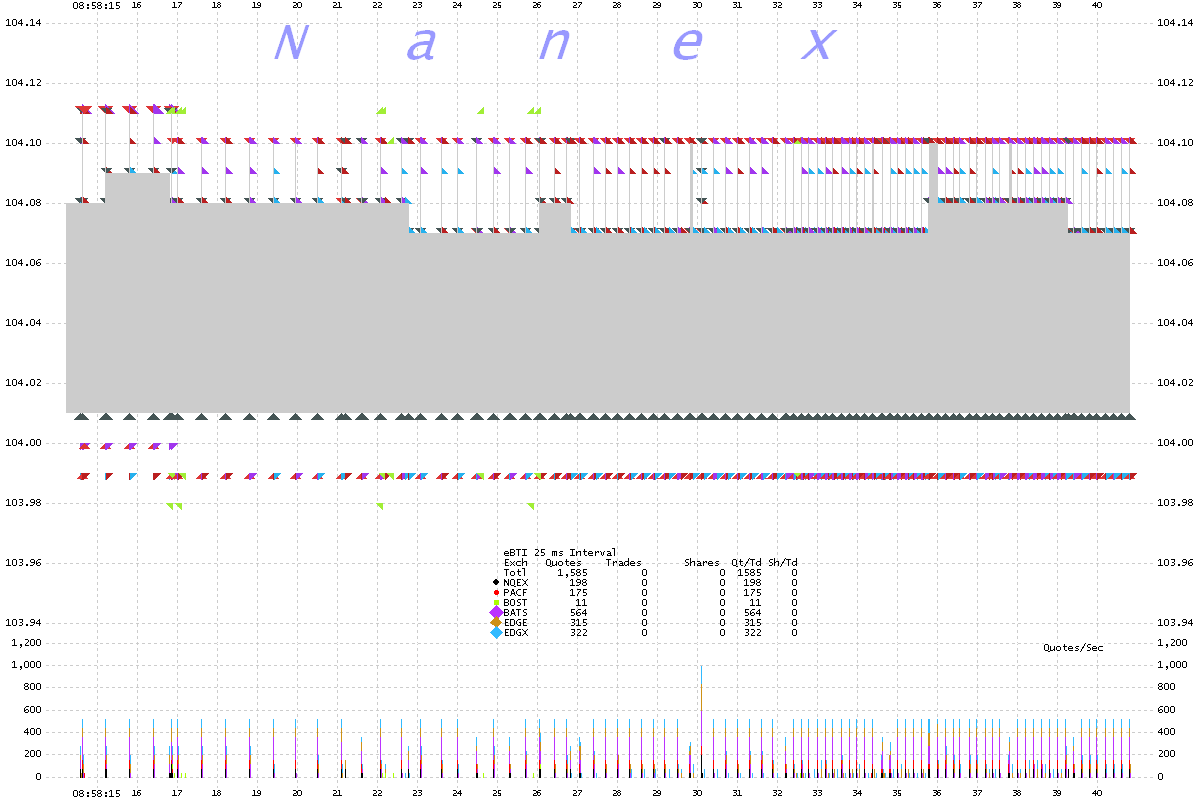
2. Order-Router Destroyer Software Test
BTI 25 millisecond interval chart showing quotes color coded by exchange and NBBO (gray shading).
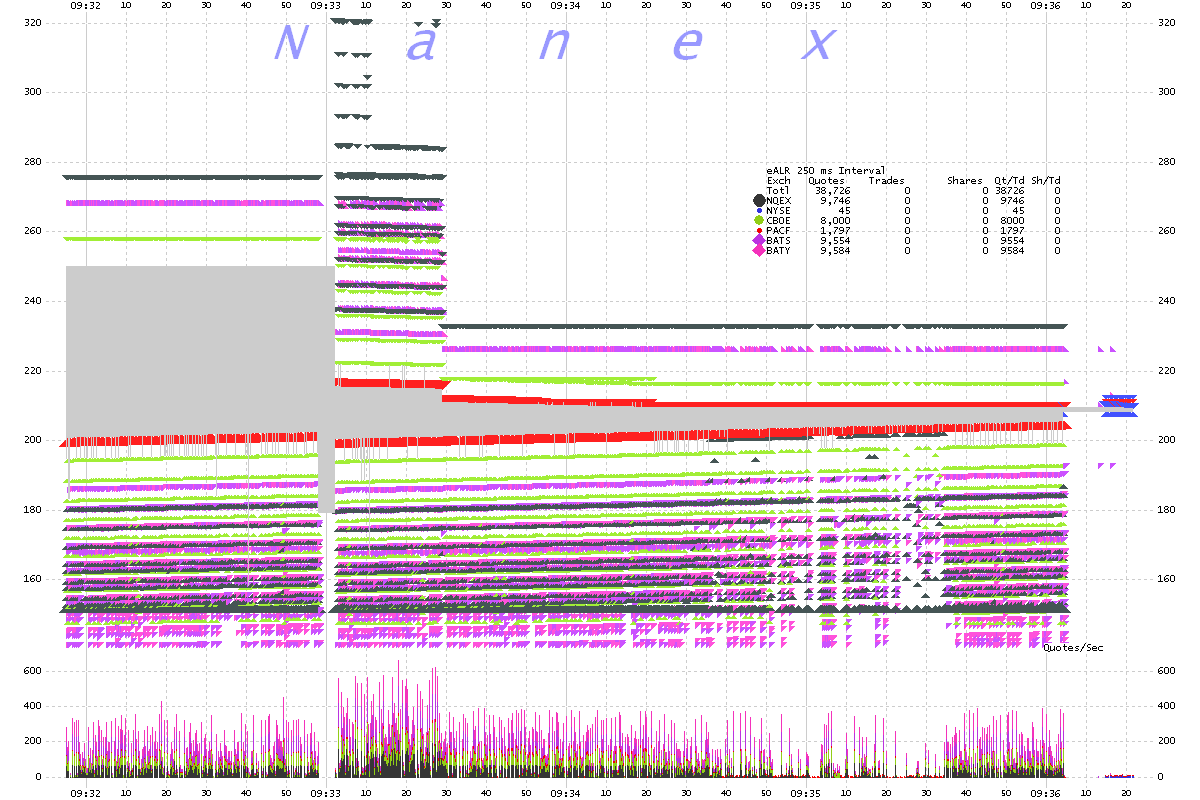
3. Price Discovery Test
ALR.PR.B 250 millisecond interval chart showing quotes color coded by exchange and NBBO (gray shading).
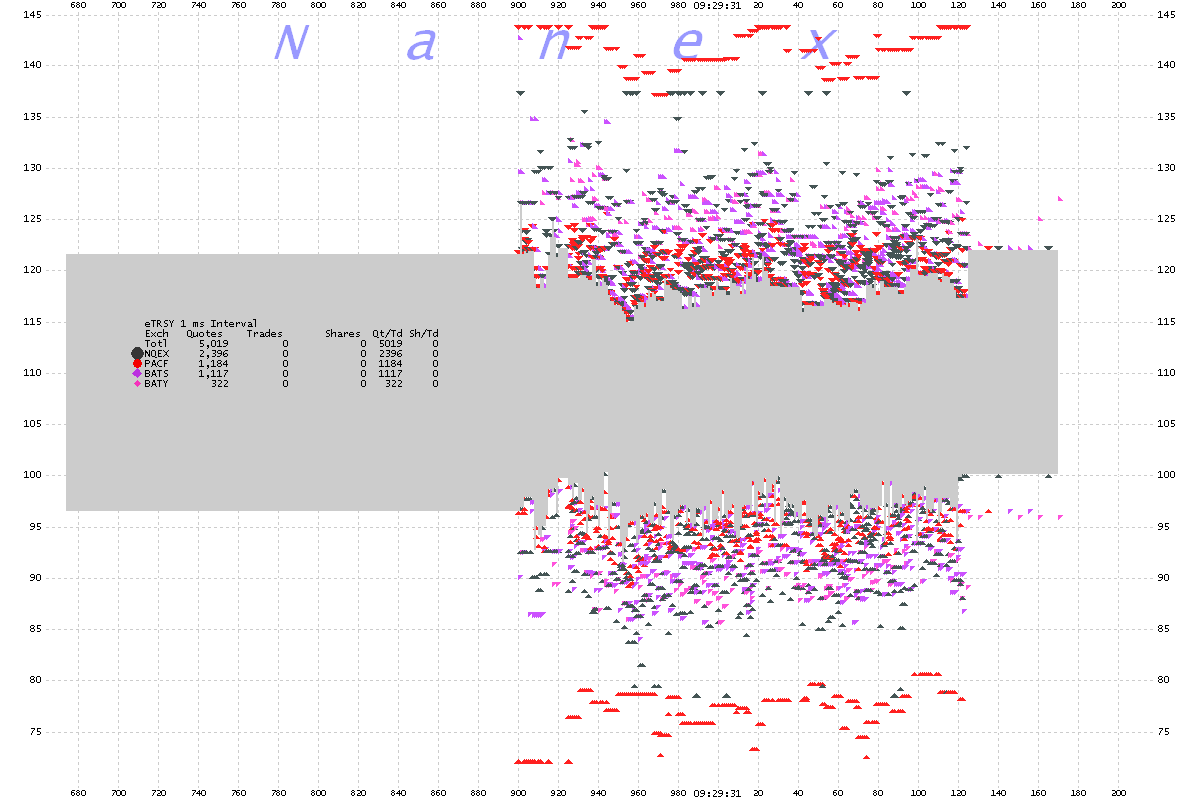
4. Random Noise Generator Test
TRSY 1 millisecond interval chart showing quotes color coded by exchange and NBBO (gray shading).
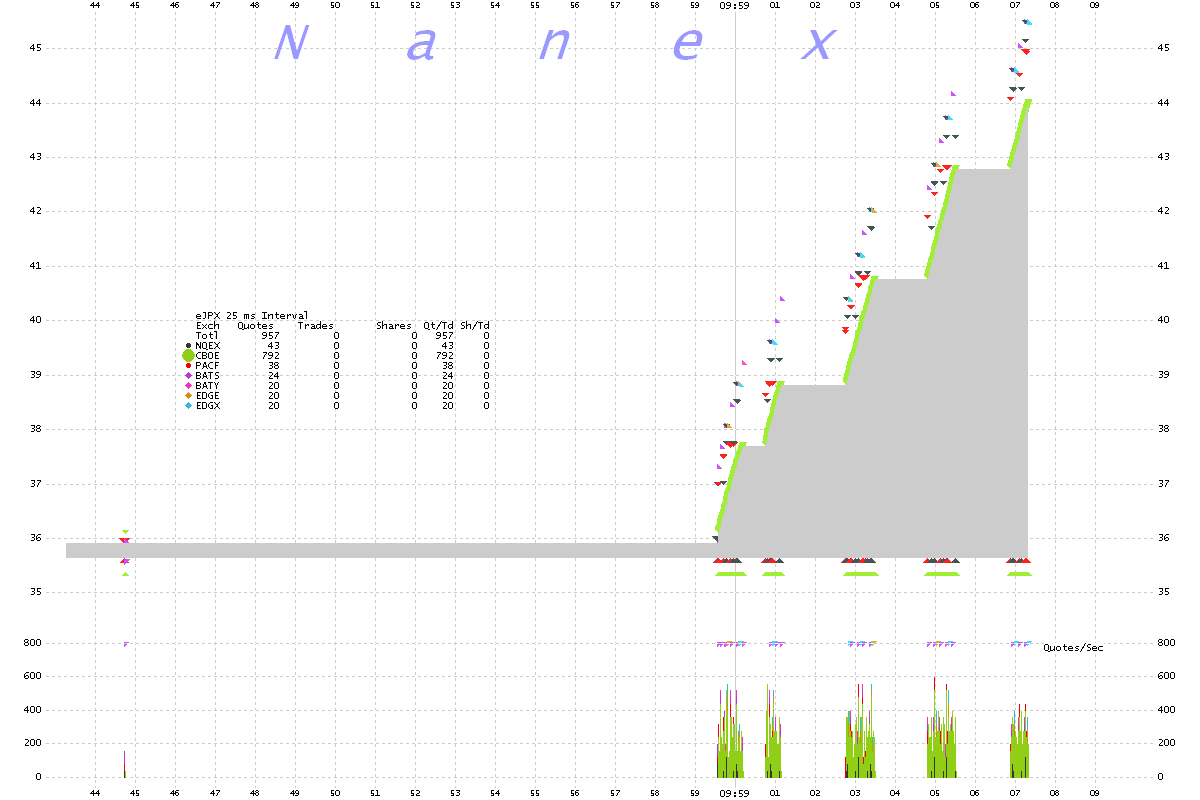
5. Fading the Offer Test
JPX 25 millisecond interval chart showing quotes color coded by exchange and NBBO (gray shading).
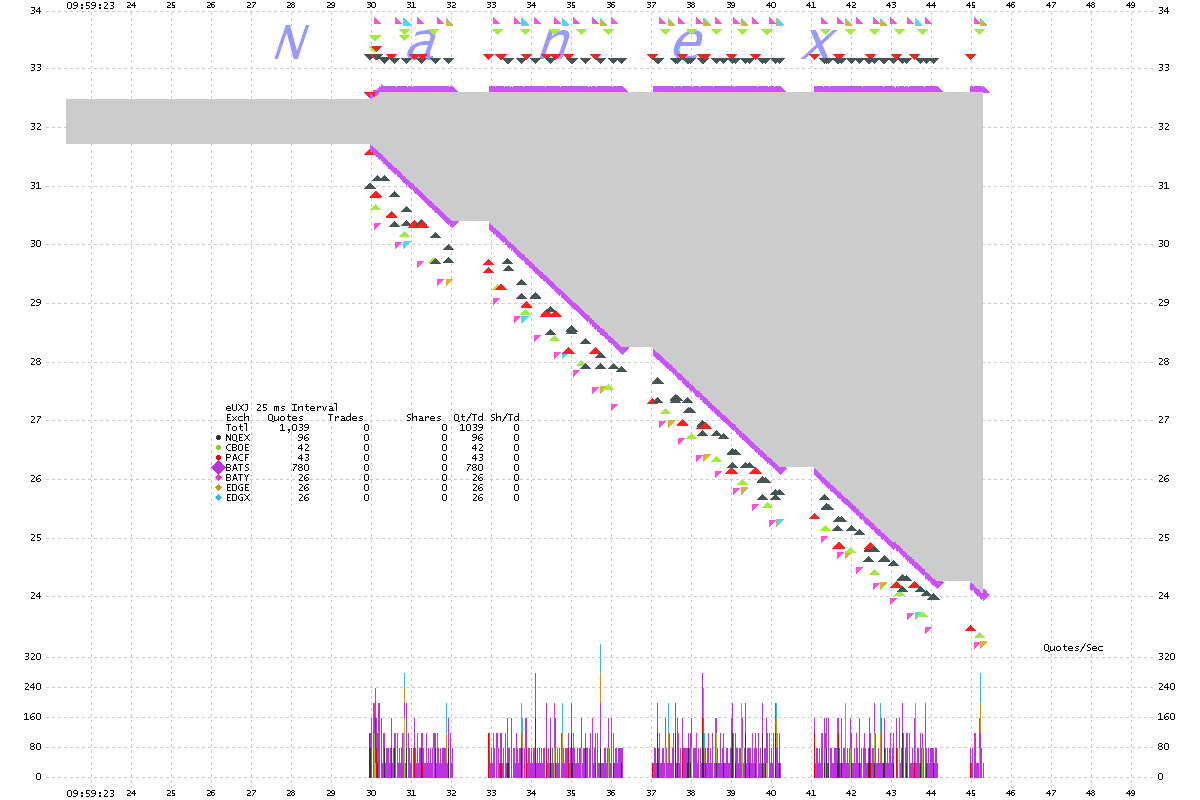
6. Fading the Bid Test
UXJ 25 millisecond interval chart showing quotes color coded by exchange and NBBO (gray shading).
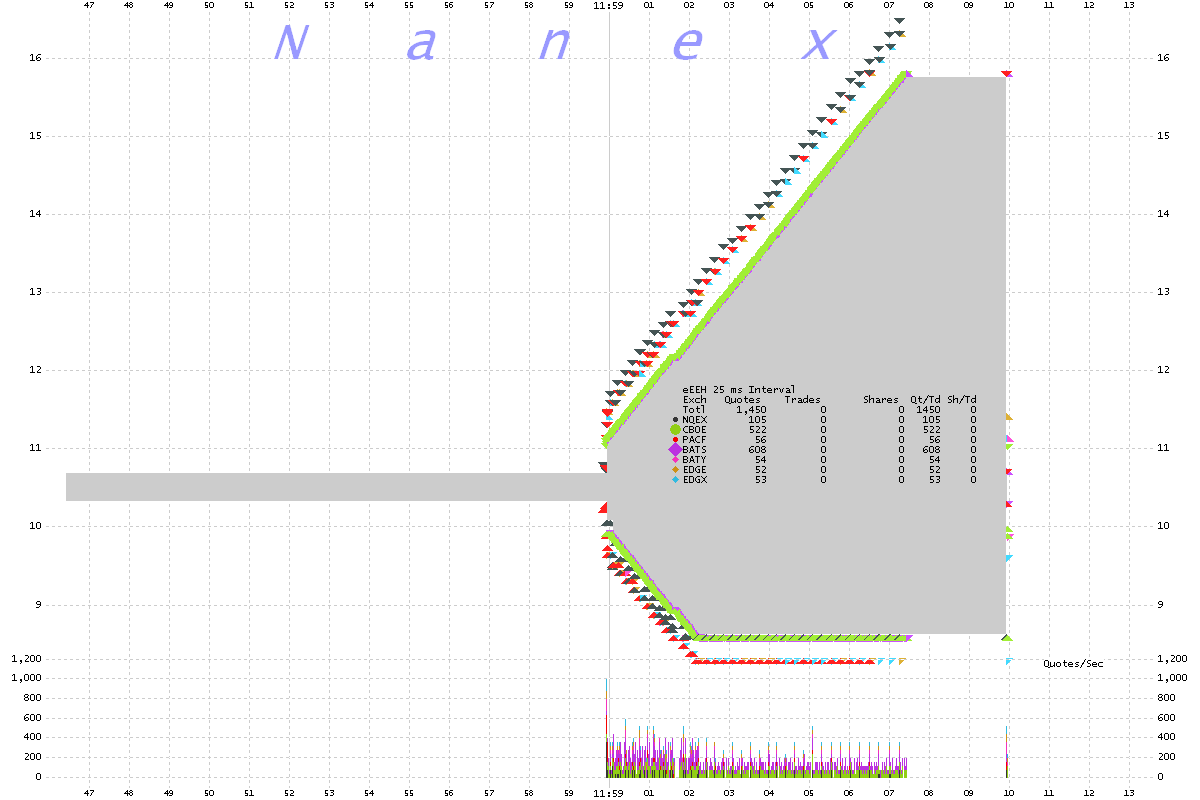
7. Fading the Bid and Offer Test
EEH 25 millisecond interval chart showing quotes color coded by exchange and NBBO (gray shading).
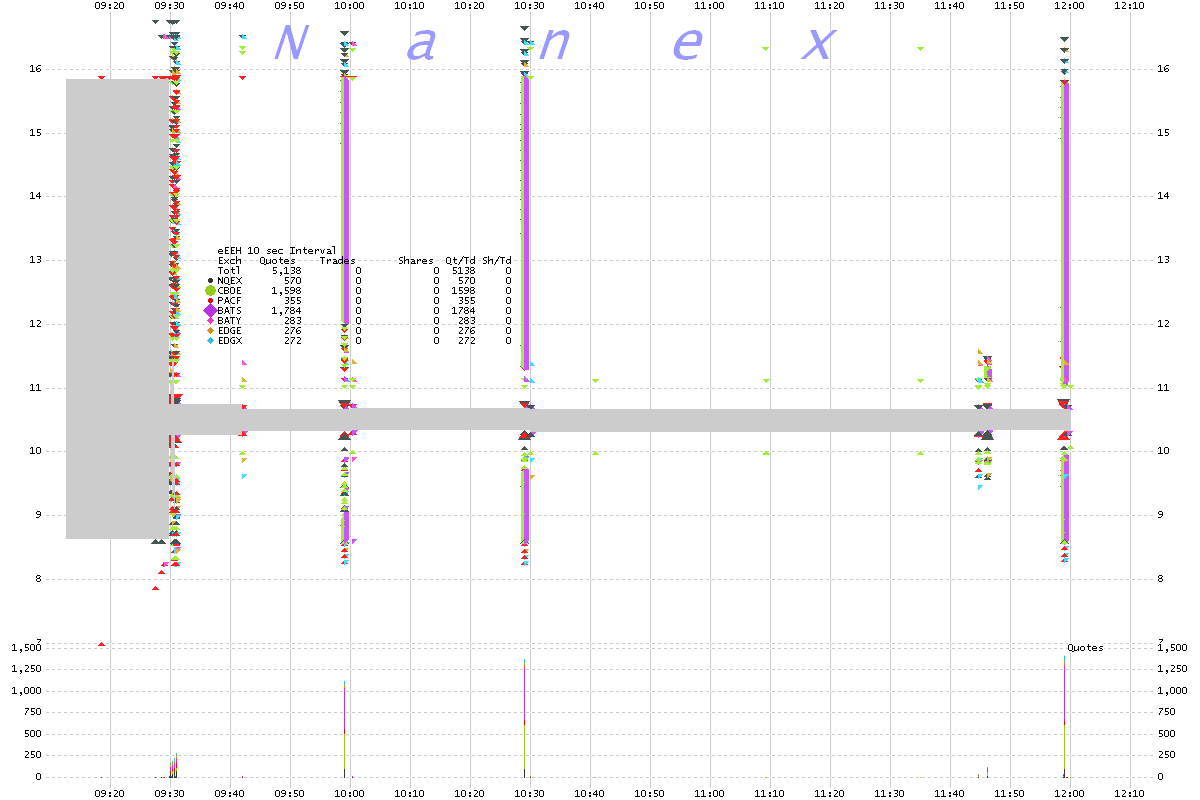
8. Be sure to test often. Especially during critical times, like the open, or just before a scheduled news event
EEH 10 second interval chart showing quotes color coded by exchange and NBBO (gray shading).
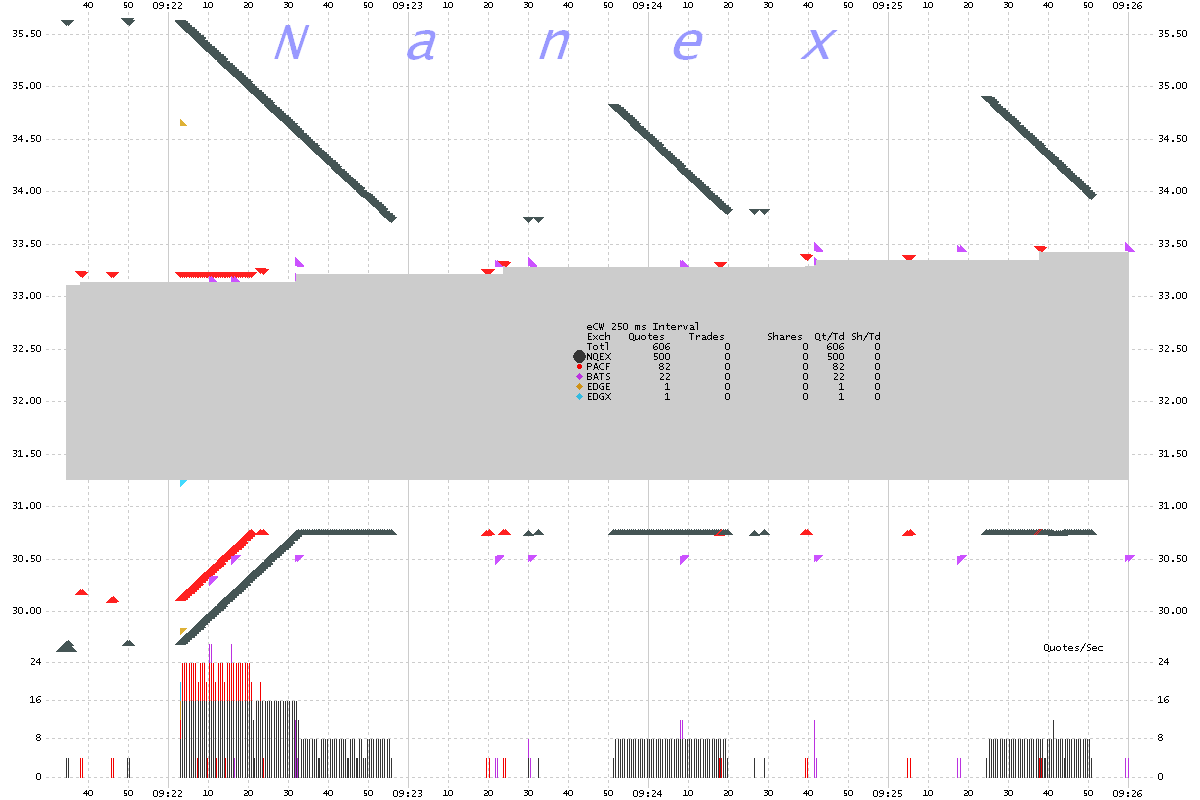
9. Test Giving the Appearance of Narrowing the NBBO Spread
CW 250 millisecond interval chart showing quotes color coded by exchange and NBBO (gray shading).
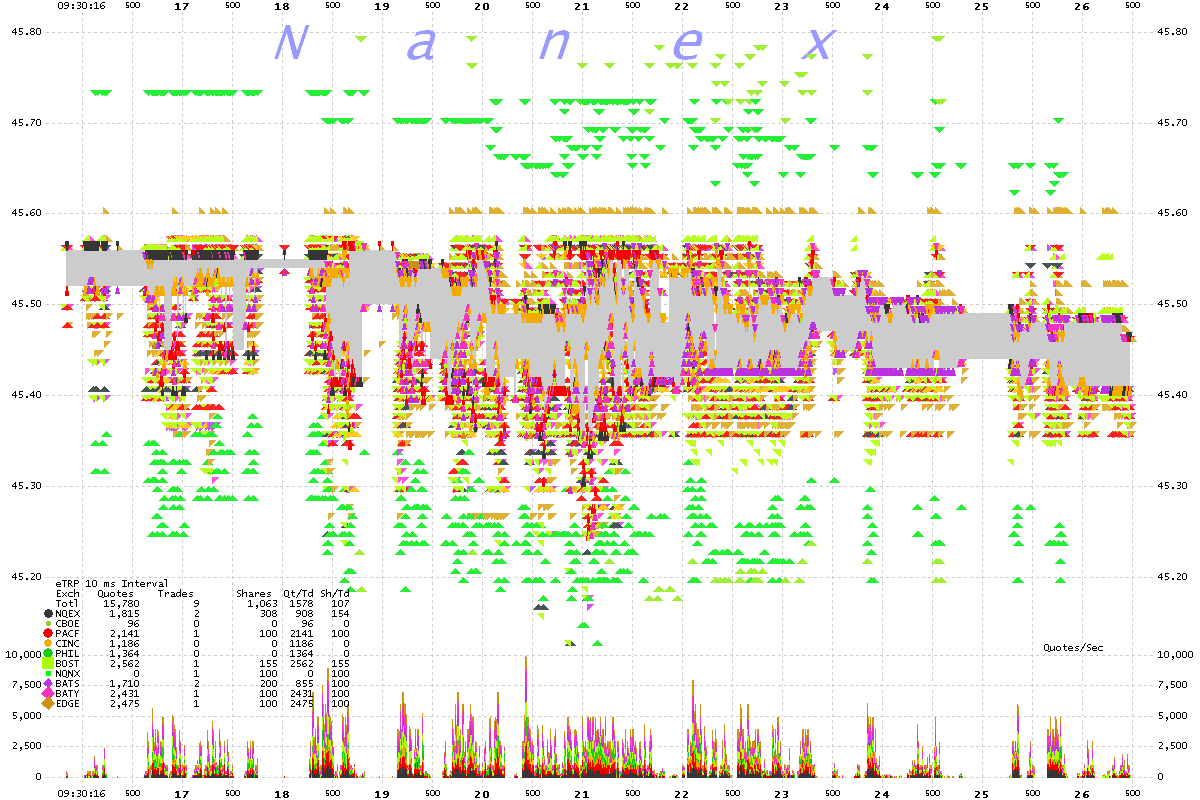
10. Test Hiding Manipulation in a Storm of Data
TRP 10 millisecond interval chart showing quotes color coded by exchange and NBBO (gray shading).
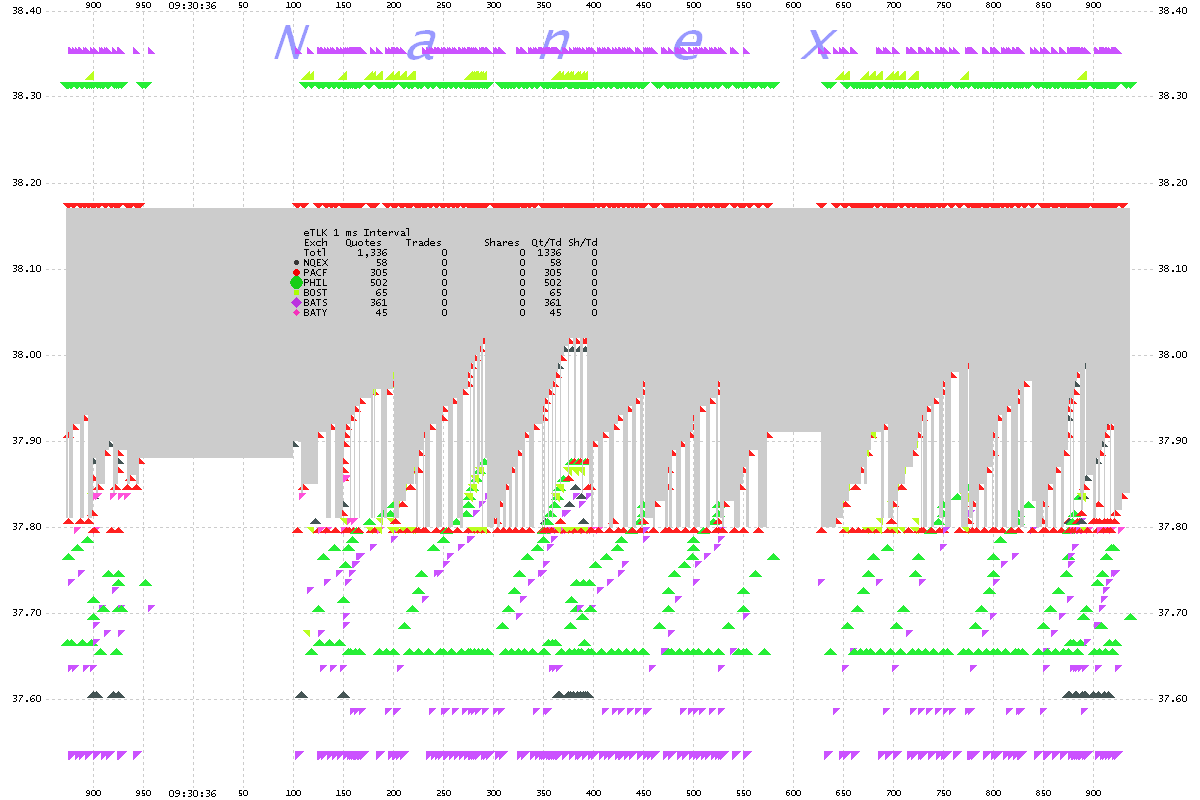
11. Order Layering in Action
TLK 1 millisecond interval chart showing quotes color coded by exchange and NBBO (gray shading).
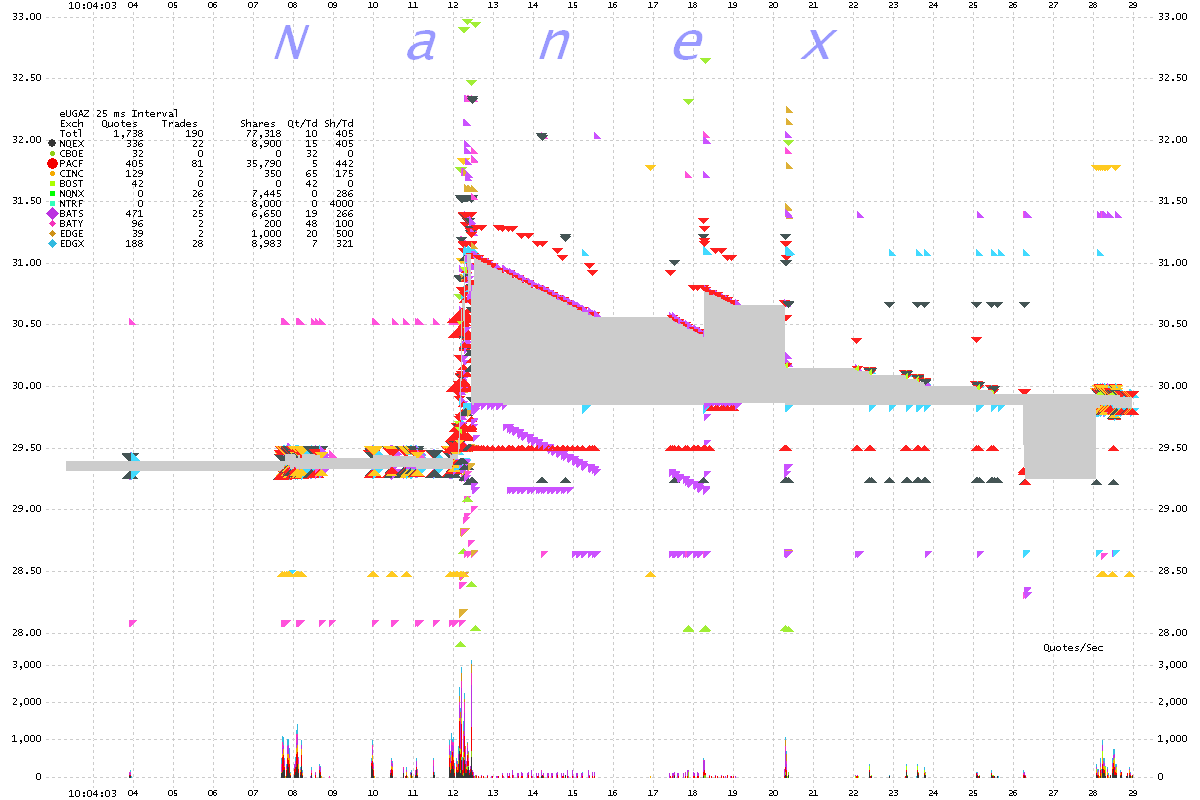
12. More Order Layering in Action
UGAZ 25 millisecond interval chart showing quotes color coded by exchange and NBBO (gray shading).
Nanex Research
Inquiries: pr@nanex.net


