Nanex Research

Nanex ~ 27-Sep-2012 ~ Mesmerizing Manipulation
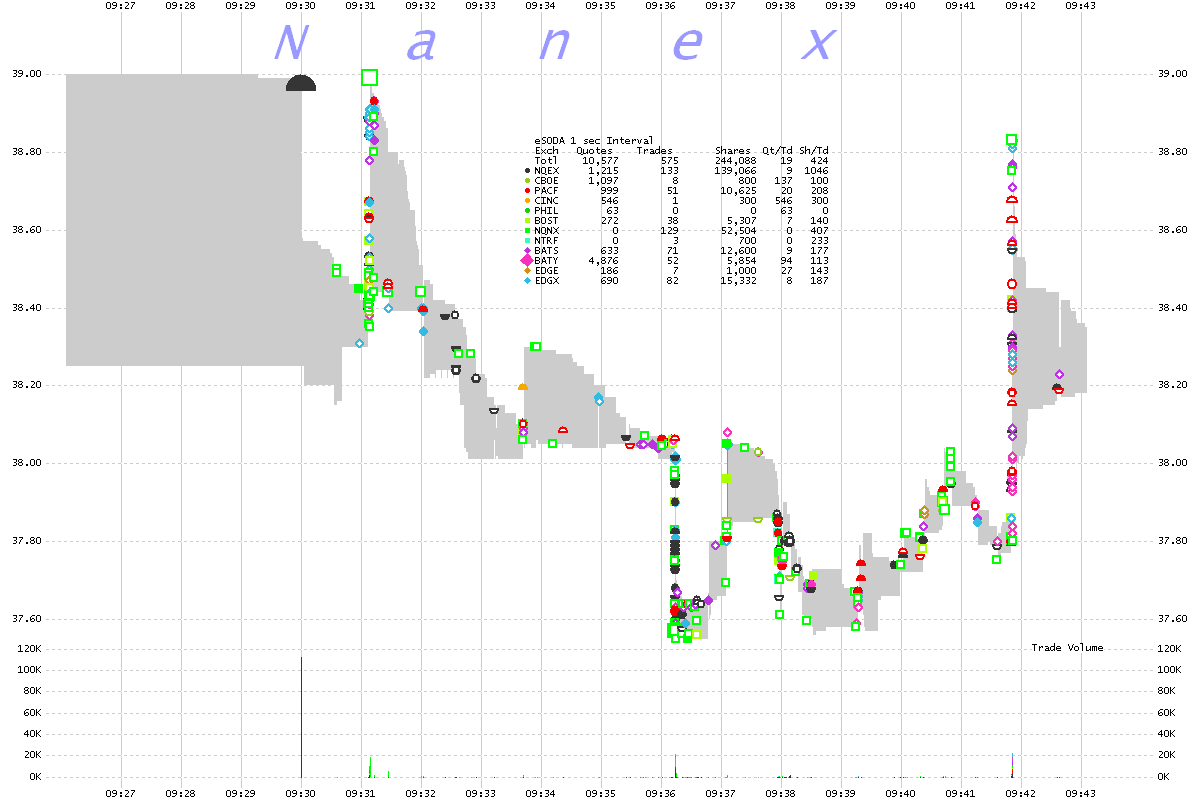
On September 27, 2012 in the common stock of SodaStream International (symbol
SODA), there were three sudden bursts of trading, 2 sending the price higher and 1 sending
it
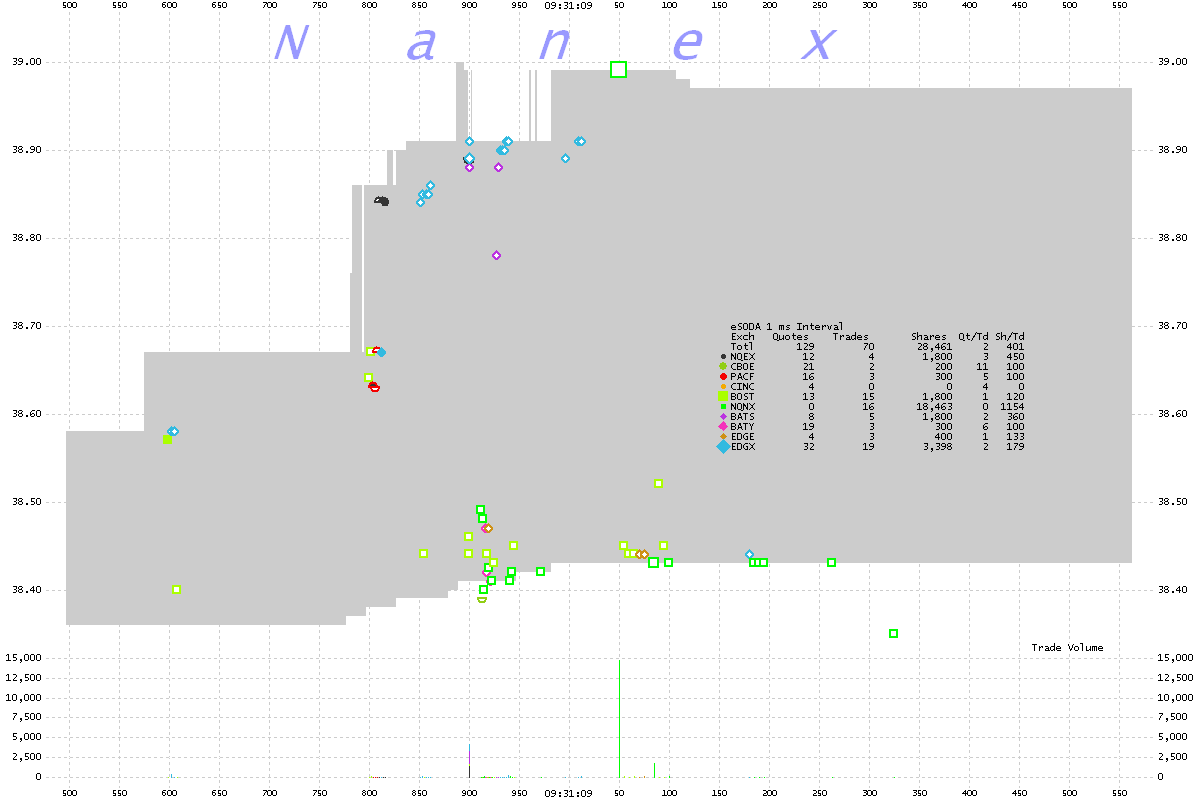
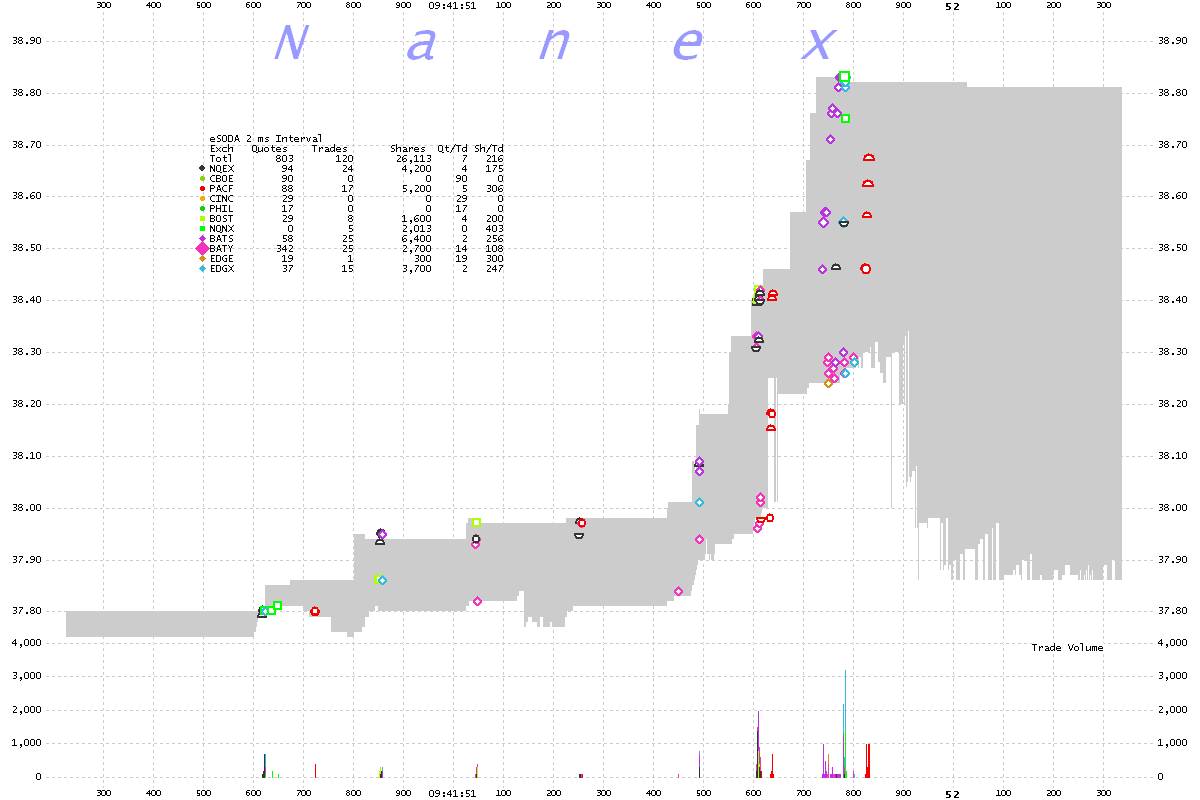
lower. When we looked closely at the two instances where the price rocketed higher,
we found something unexpected. While the buy orders (hitting the offers) were sending
prices higher, sell orders (hitting the bids) were also executing! Across a wide spread.
If only the buyers could be matched with the sellers, we'd have an exchange!
In the charts below, the gray shading is the best bid/ask spread: the top of the gray
shade is the best ask from participating exchanges, and the bottom of the gray shade is the best
bid. Trades are shown as shapes color coded by exchange. Trades near the top of the
shading are most likely aggressive buy orders. Trades near the bottom of the shading
are most likely aggressive sell orders. Normally, when a stock is charging higher, you
only see aggressive buying (what sent the price up in the first place). Not so in this
example. Maybe the SEC is already
on the case.
1. SODA 1 millisecond interval chart showing quotes color coded by exchange and NBBO.
This is 1 second of data.

2. SODA 25 millisecond interval chart showing quotes color coded by exchange and NBBO.

3. SODA 1 second interval chart showing quotes color coded by exchange and NBBO.
Zooming out. Chart 1 is the spike higher on the left, Chart 2 is the spike on the right.

Nanex Research
Inquiries: pr@nanex.net


