Nanex Research

Nanex ~ 28-Sep-2012 ~ Don't Worry, Nobody is Watching
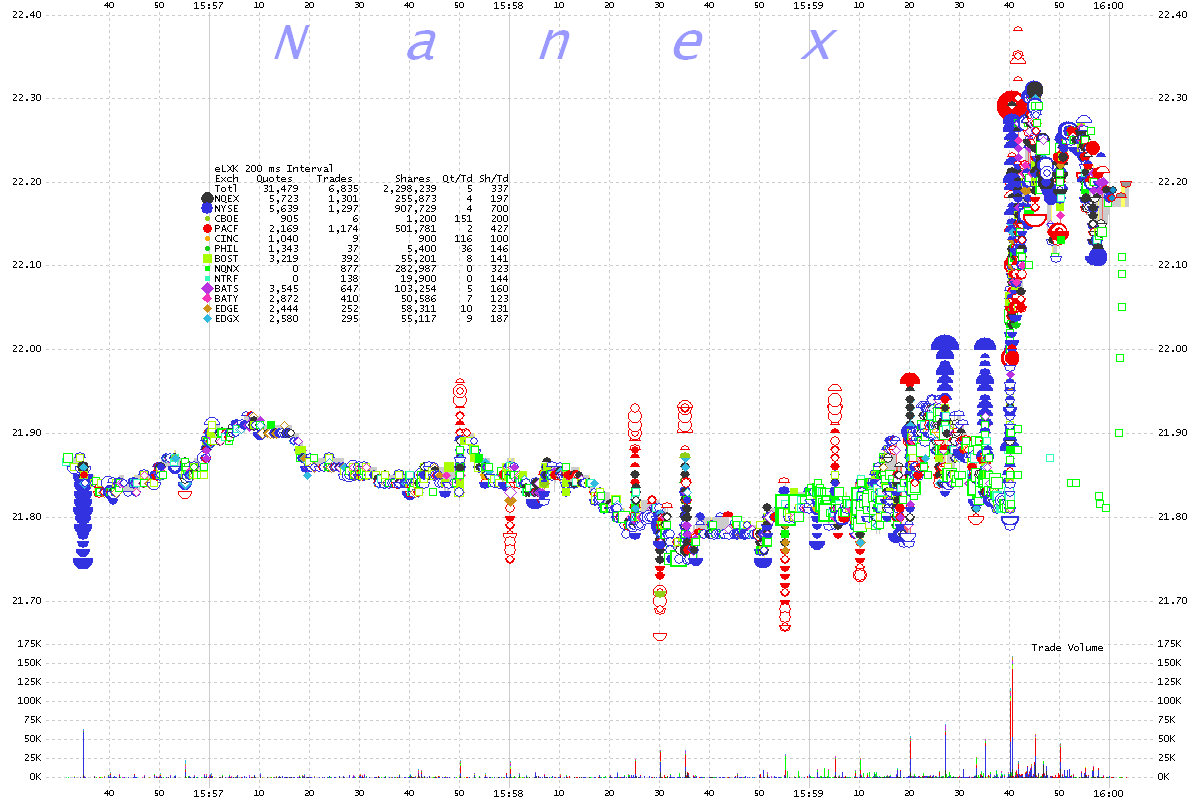
1. LXK 200 millisecond interval chart showing trades color coded by exchange.
Note the many wild spikes up and down.
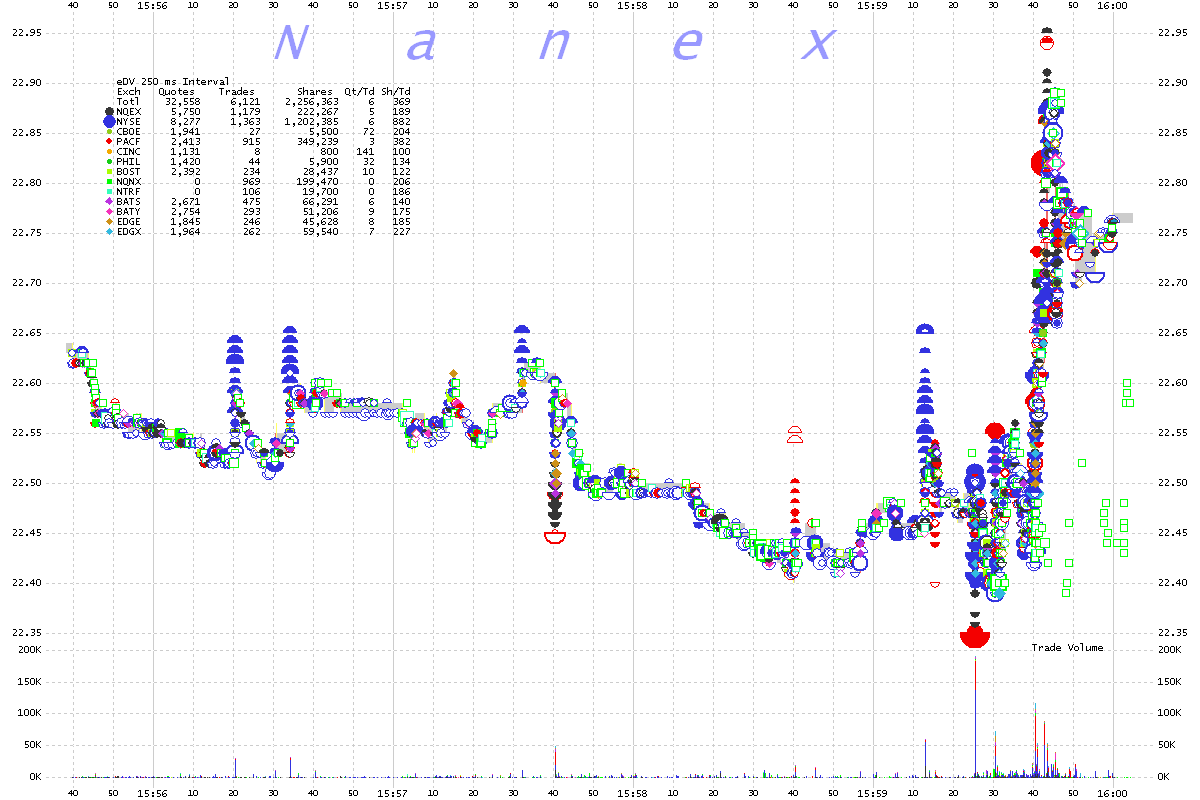
2. DV 250 millisecond interval chart showing trades color coded by exchange.
Note the many wild spikes up and down.
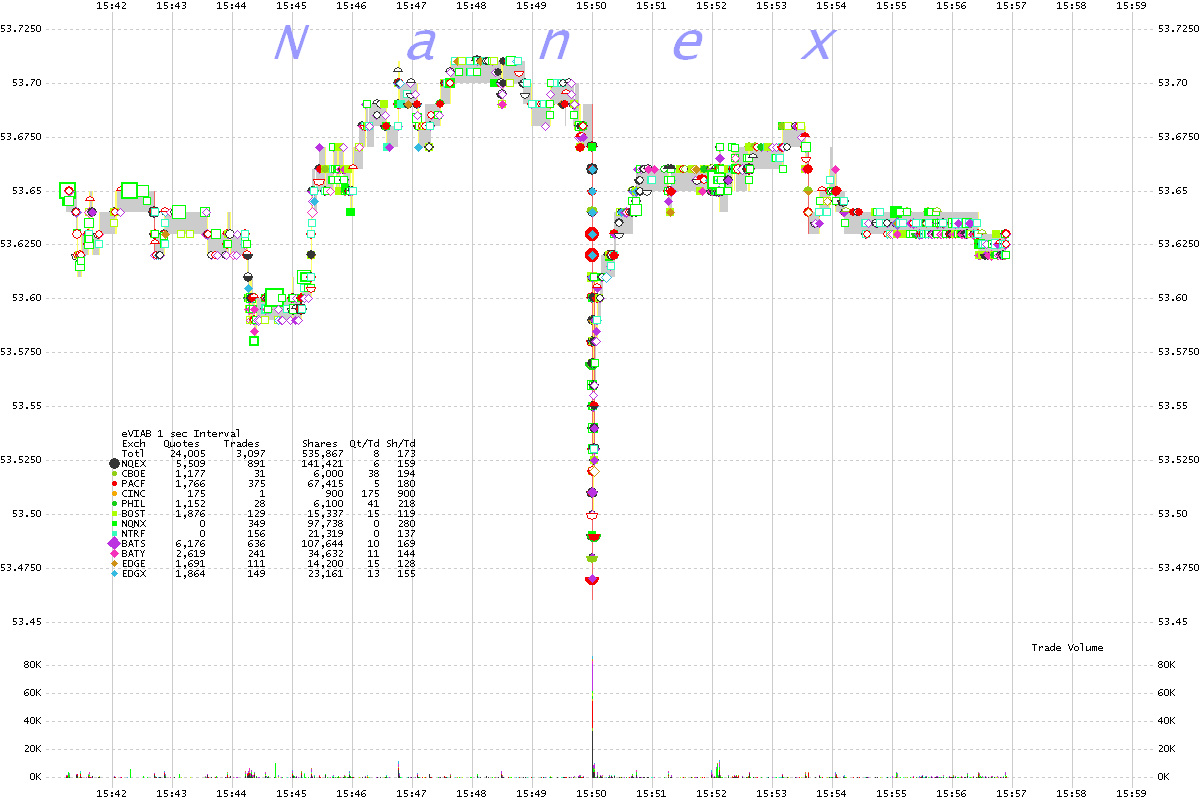
3. VIAB 1 econd interval chart showing trades color coded by exchange.
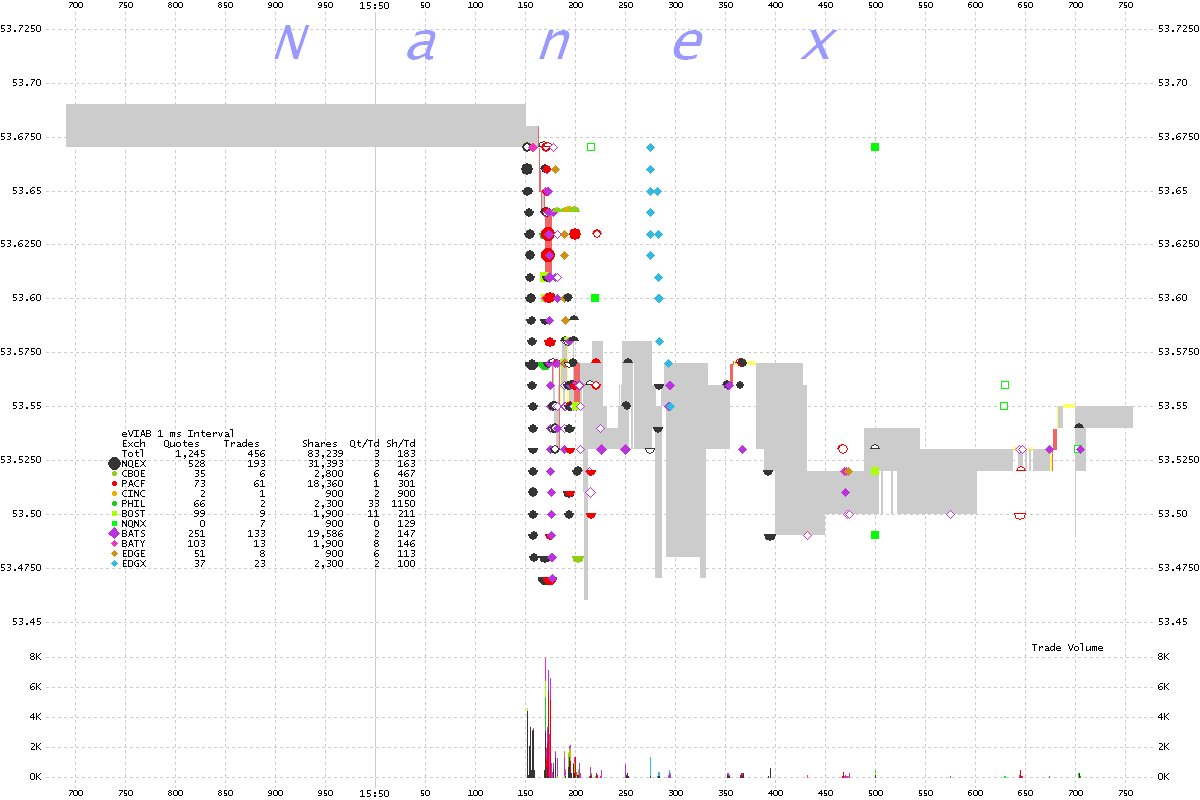
4. VIAB 1 millisecond interval chart showing trades color coded by exchange.
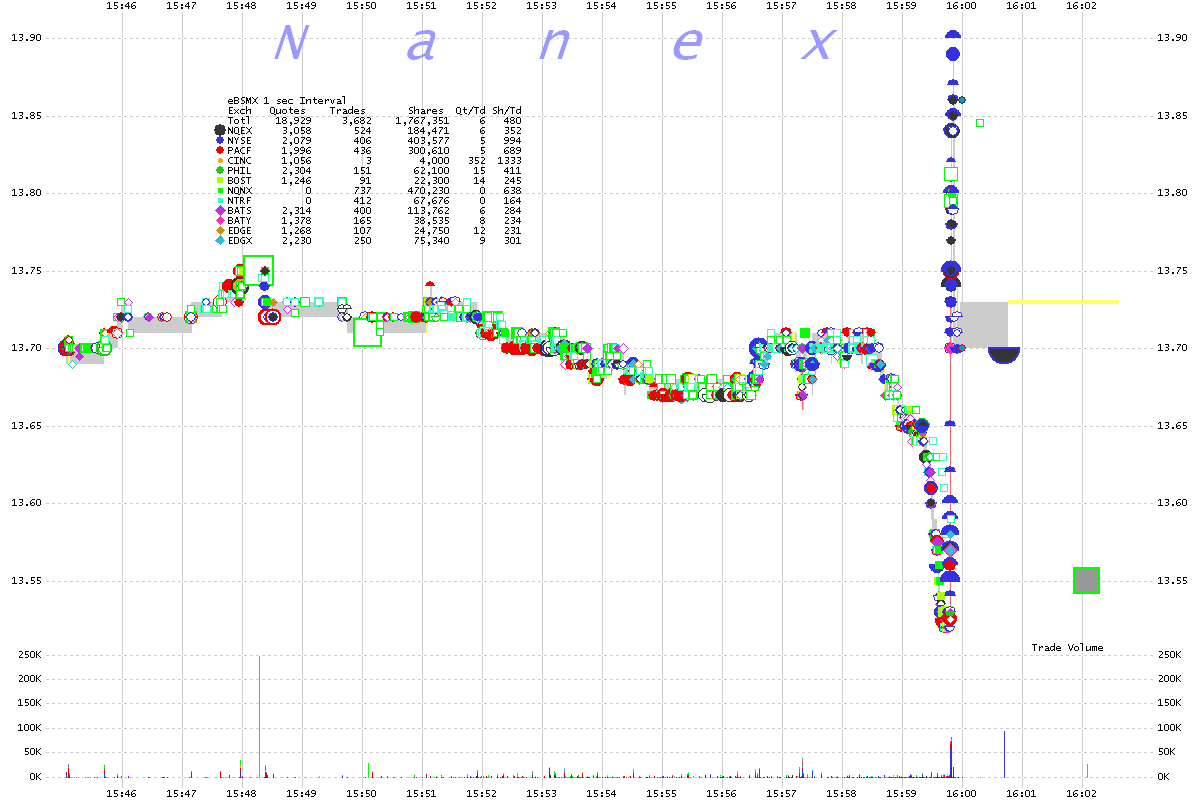
5. BSMX 250 millisecond interval chart showing trades color coded by exchange.
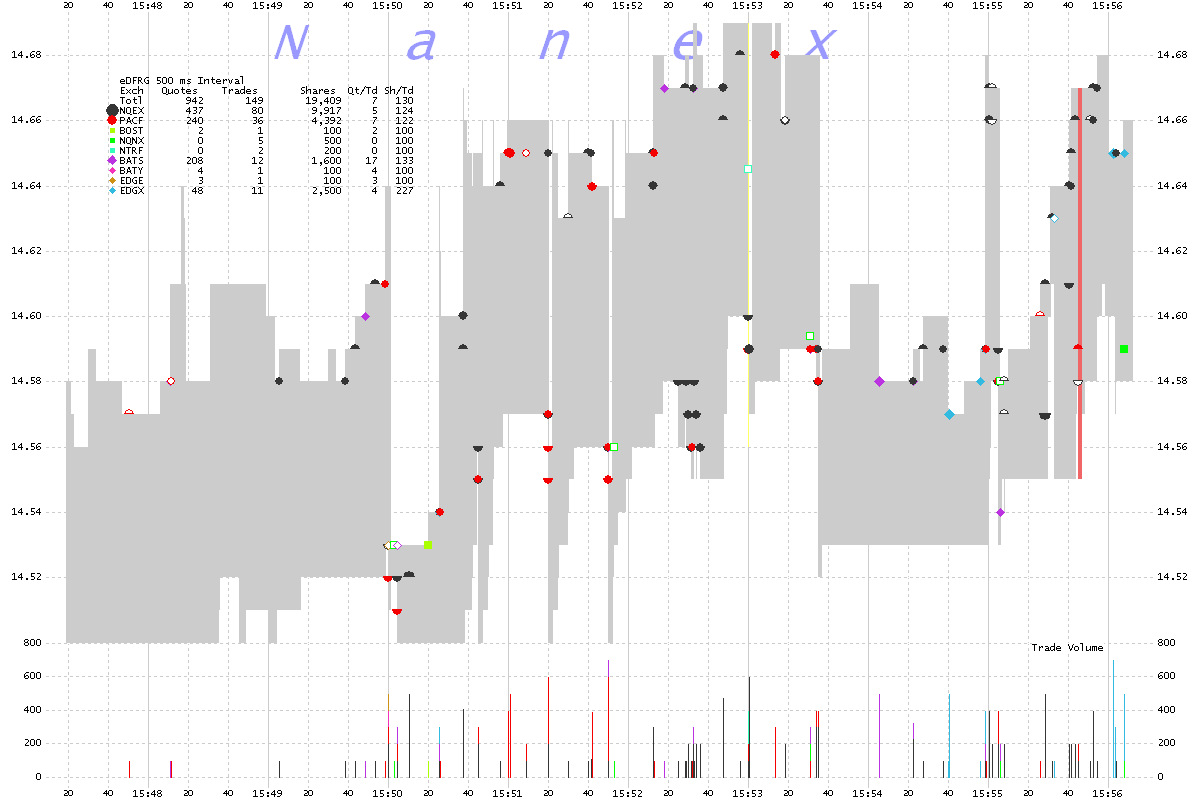
6. DFRG 500 millisecond interval chart showing trades color coded by exchange.
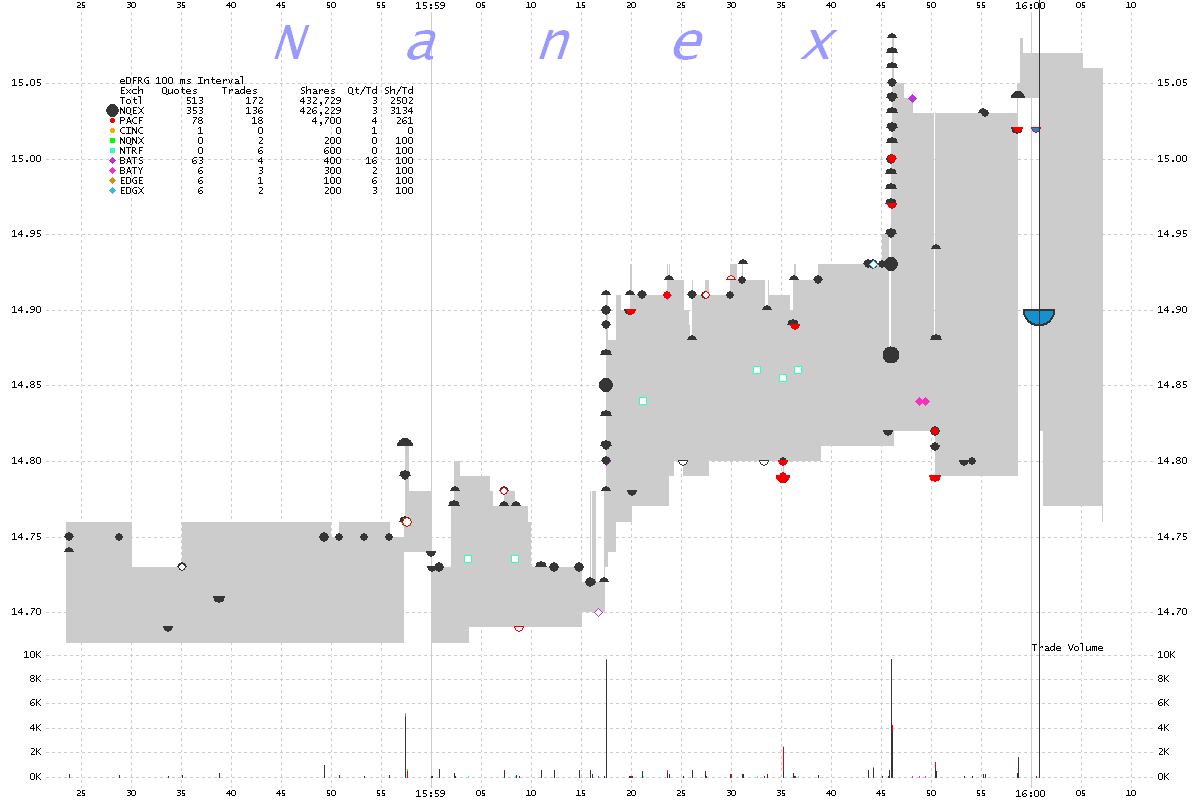
7. DFRG 100 millisecond interval chart showing trades color coded by exchange.
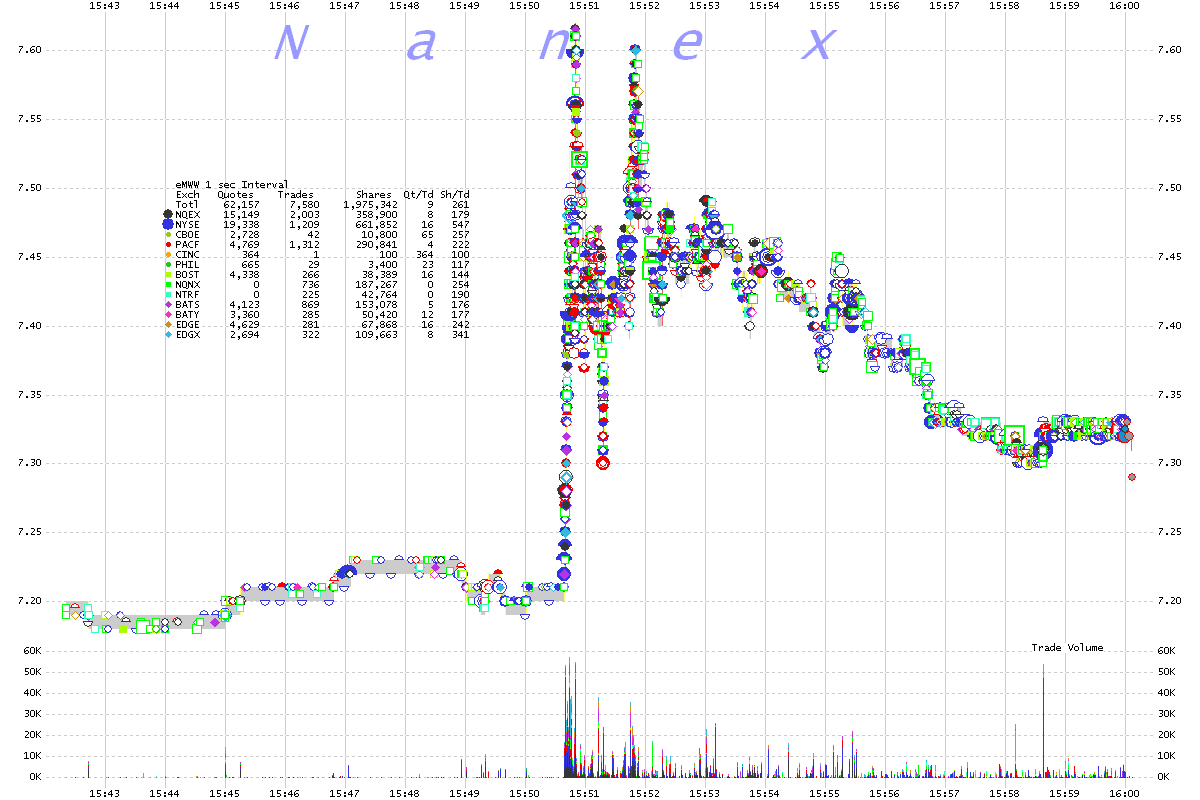
8. MWW 1 second interval chart showing trades color coded by exchange.
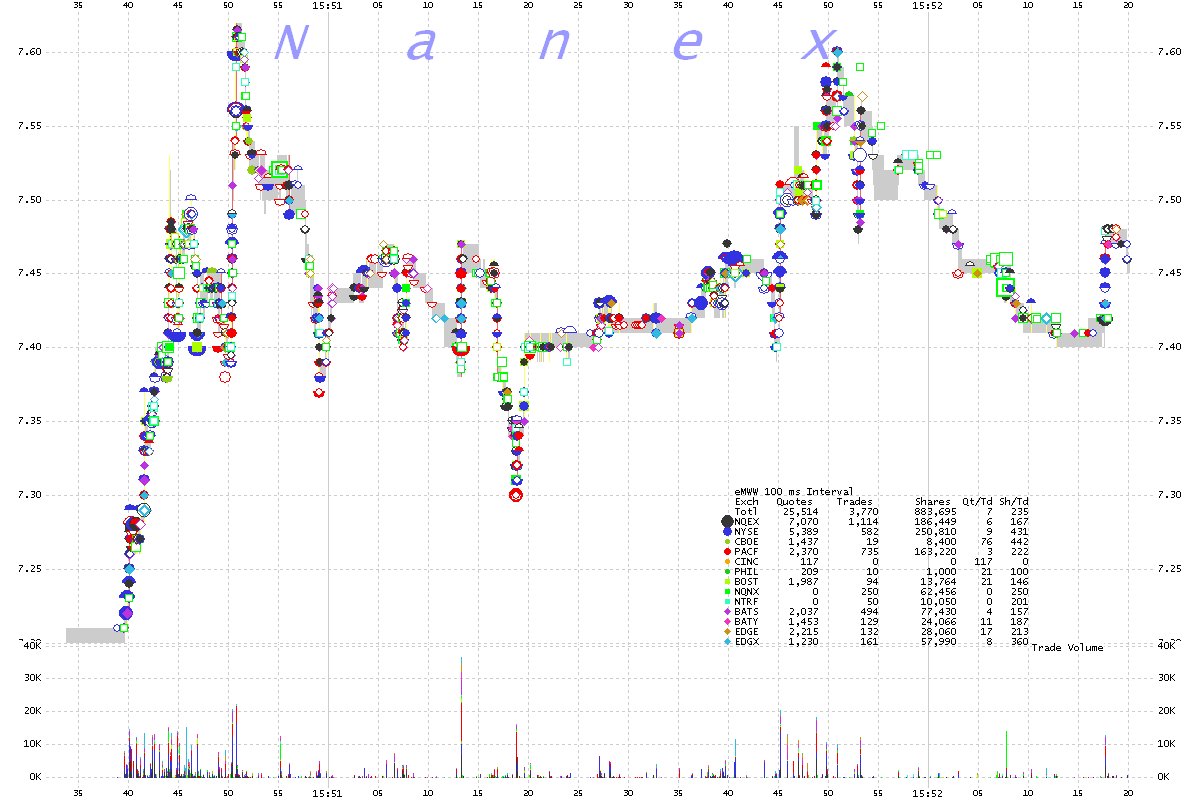
9. MWW 100 millisecond interval chart showing trades color coded by exchange.
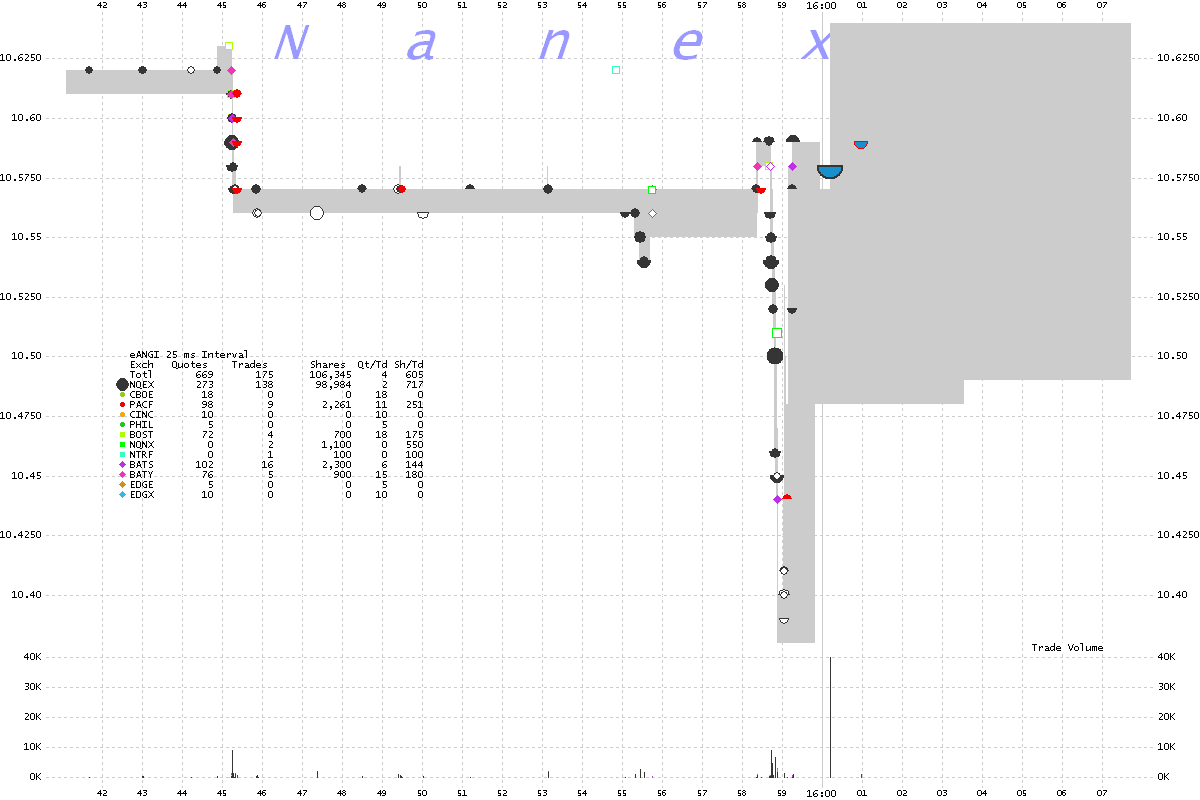
10. ANGI 25 millisecond interval chart showing trades color coded by exchange.
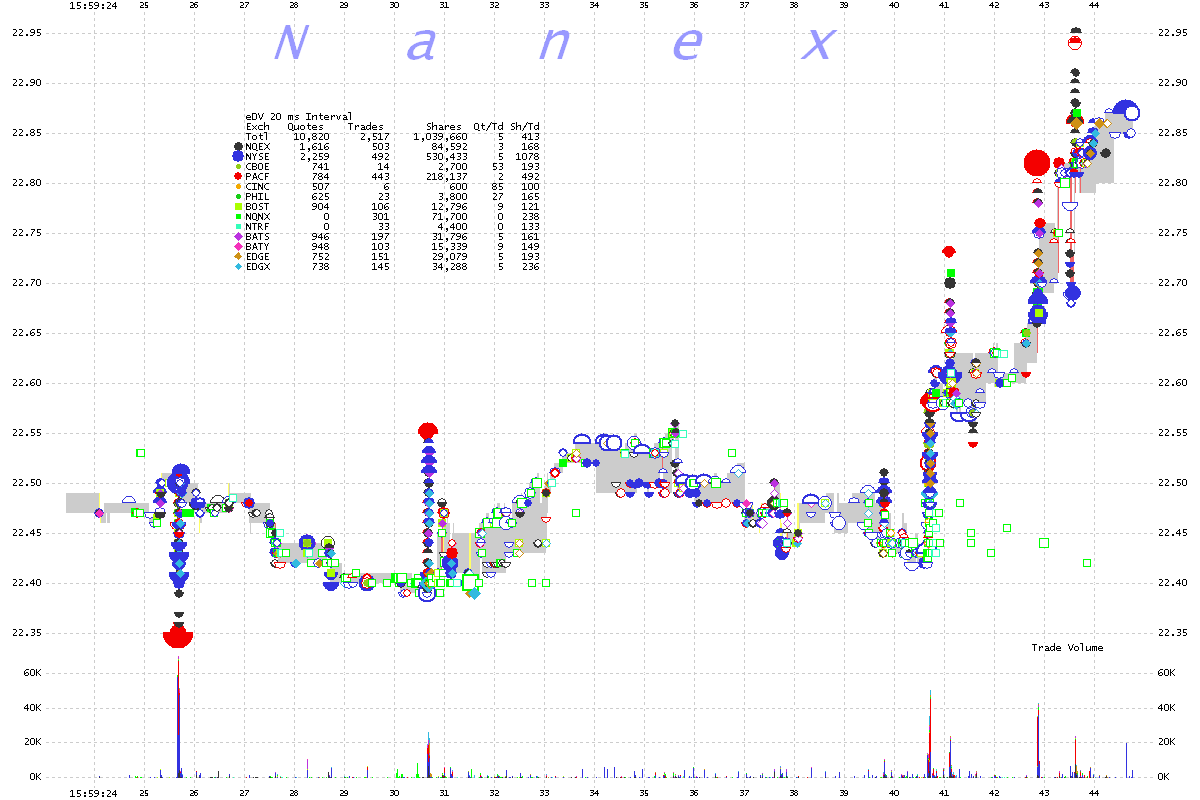
11. DV 20 millisecond interval chart showing trades color coded by exchange.
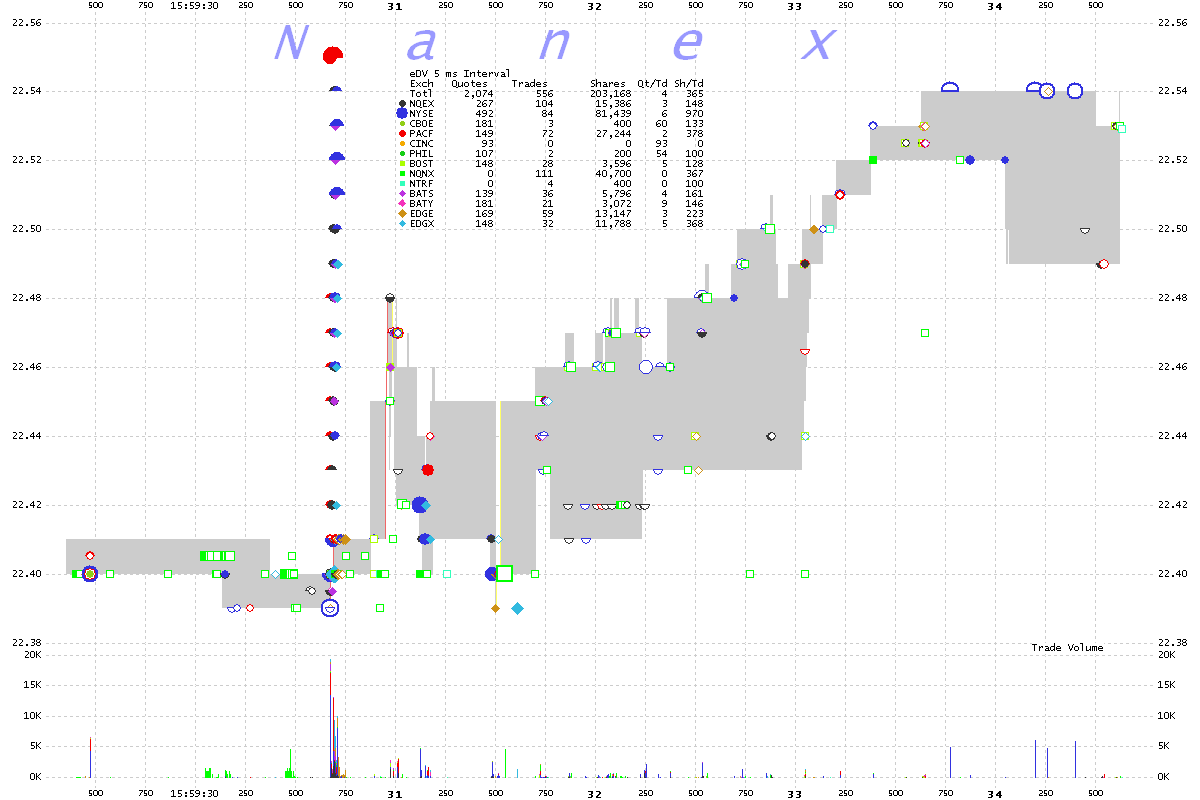
12. DV 5 millisecond interval chart showing trades color coded by exchange.
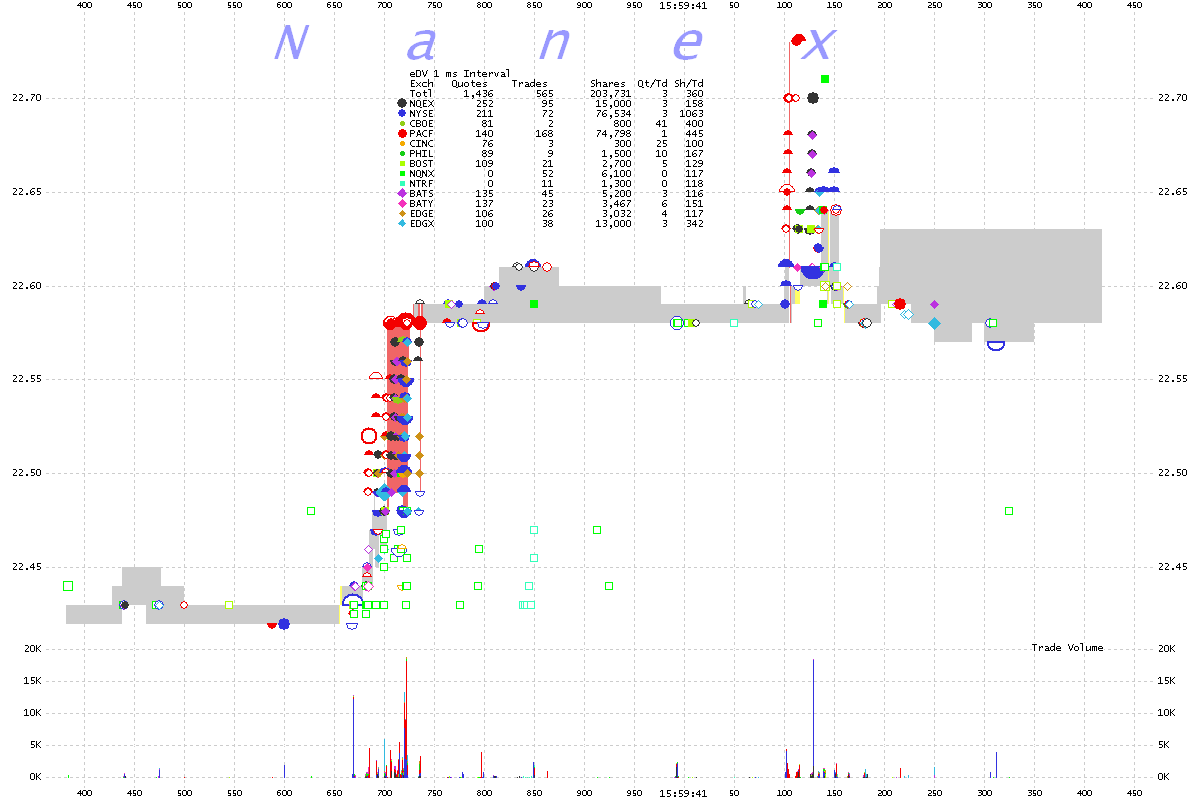
13. DV 1 millisecond interval chart showing trades color coded by exchange.
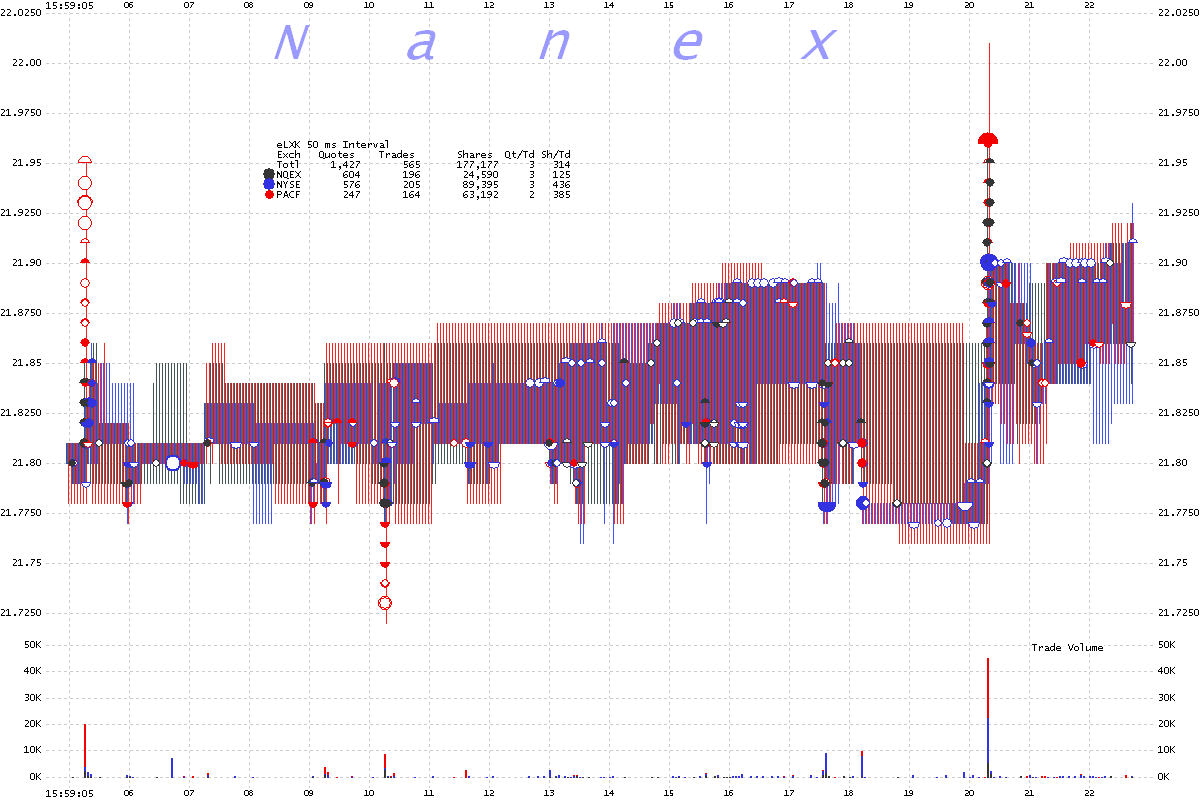
14. LXK 50 millisecond interval chart showing trades color coded by exchange.
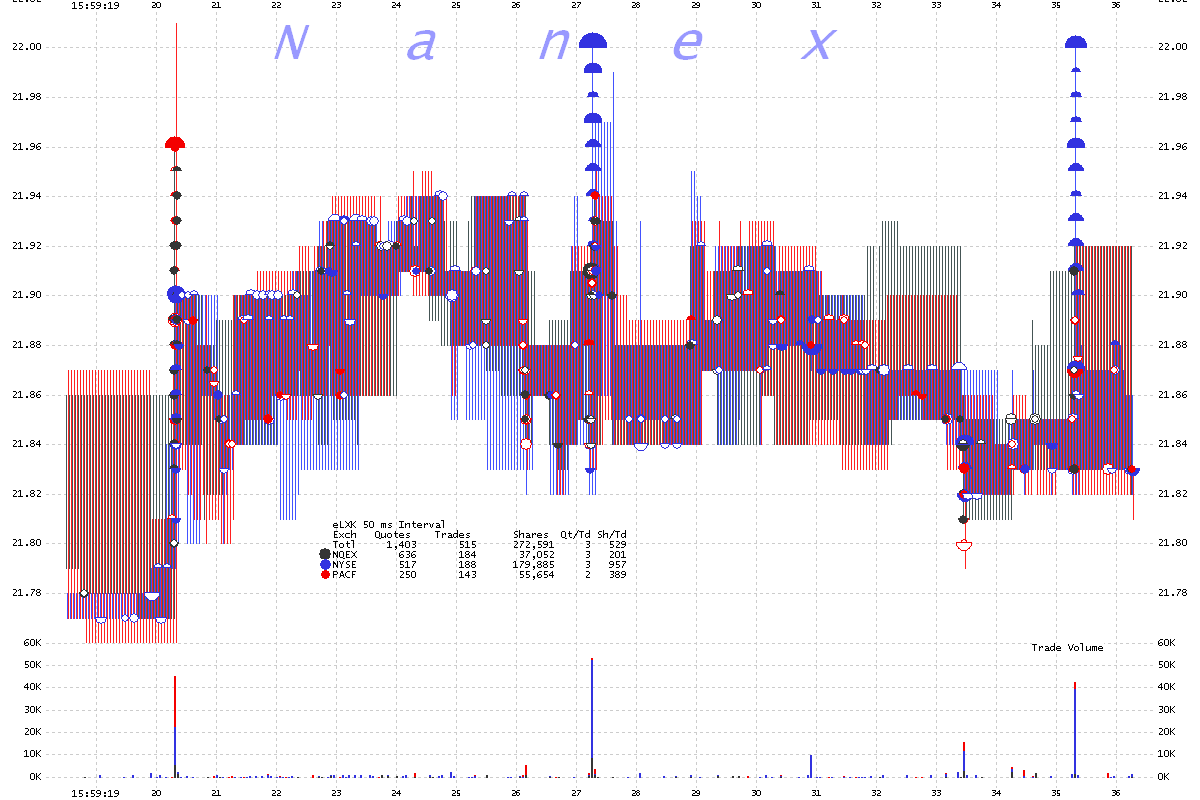
15. LXK 50 millisecond interval chart showing trades color coded by exchange.
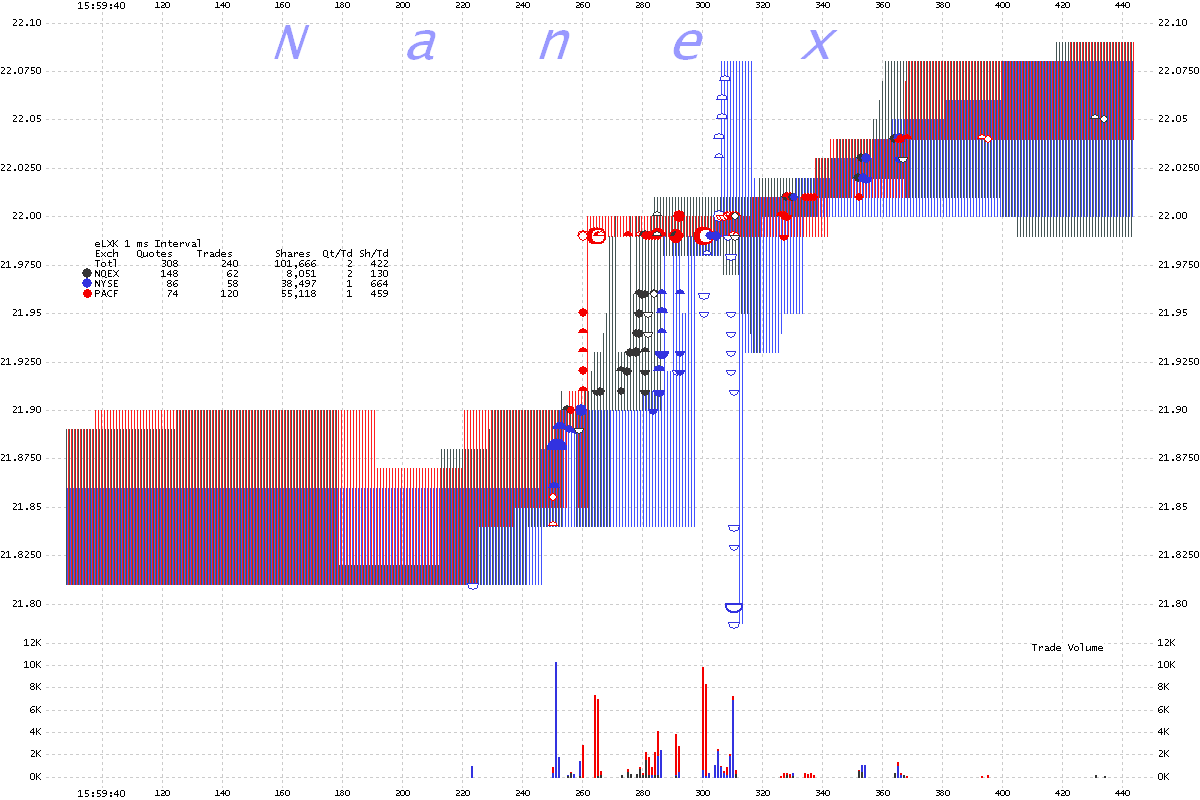
16. LXK 1 millisecond interval chart showing trades color coded by exchange.
17. LXK 1 millisecond interval chart showing trades color coded by exchange.
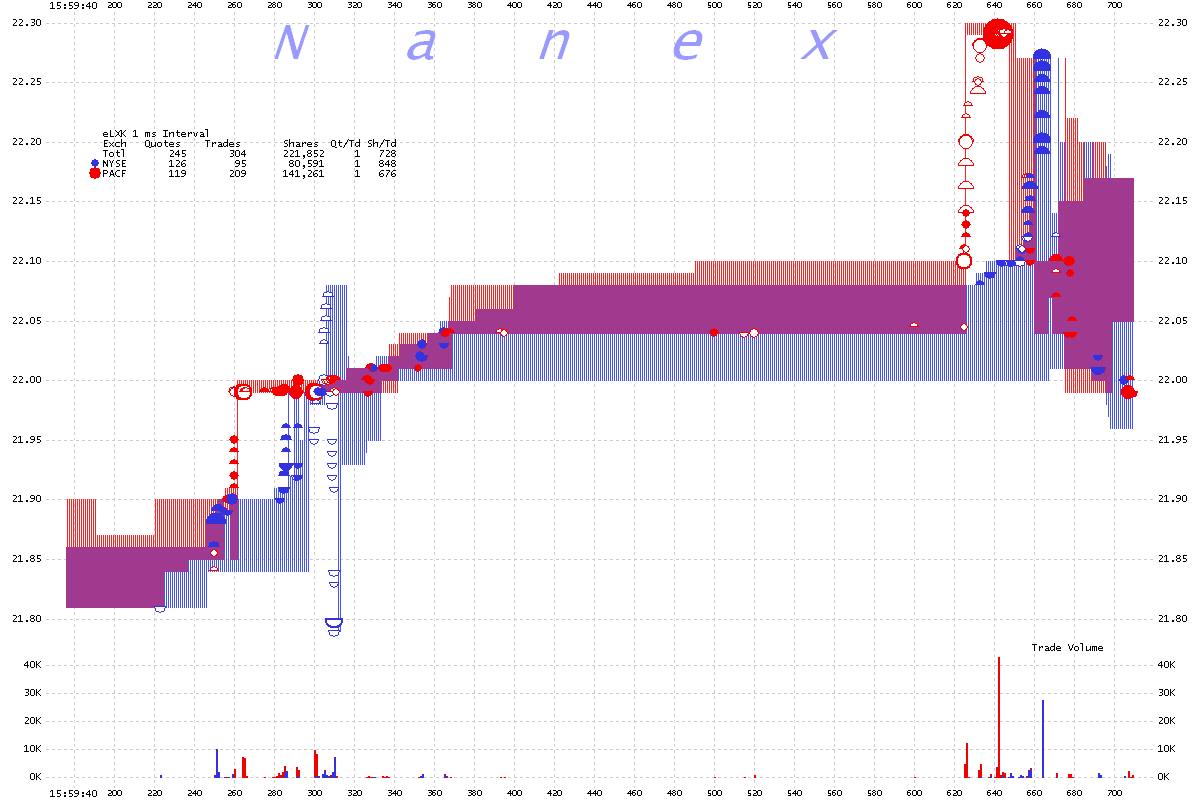
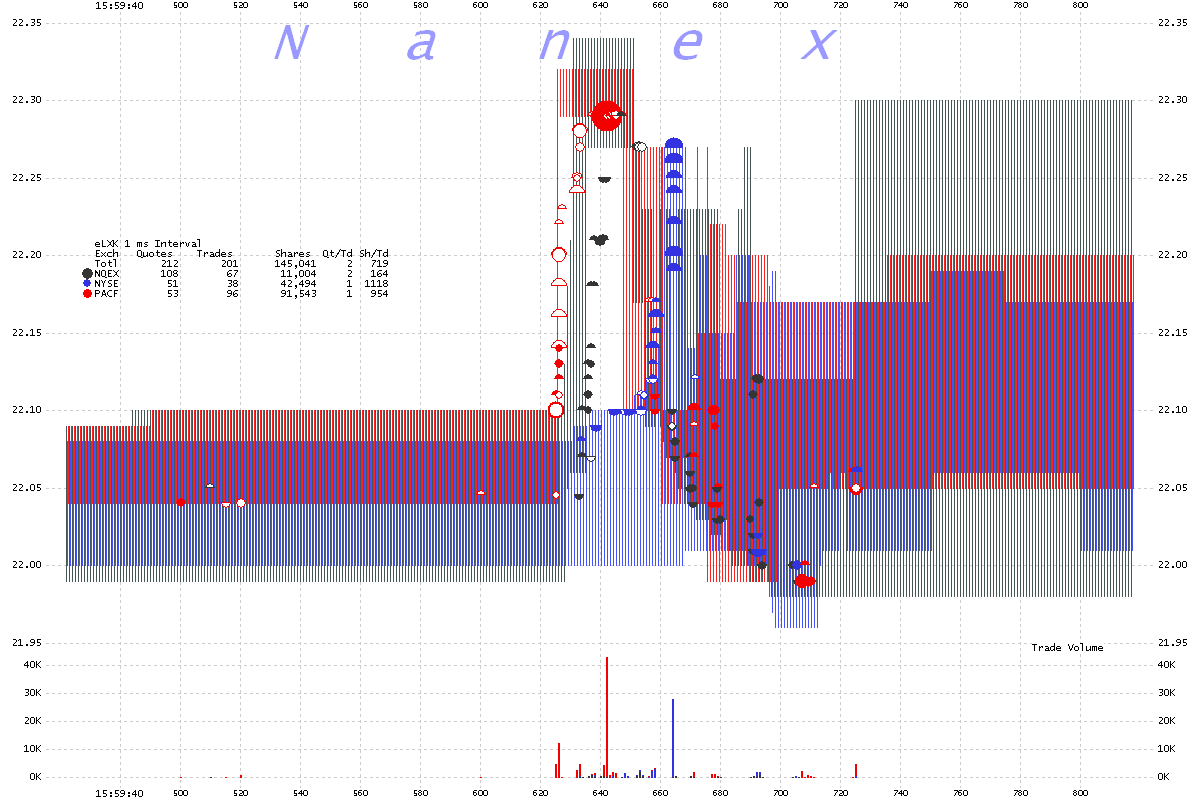
18. LXK 1 millisecond interval chart showing trades color coded by exchange.
Nanex Research
Inquiries: pr@nanex.net


