Nanex Research

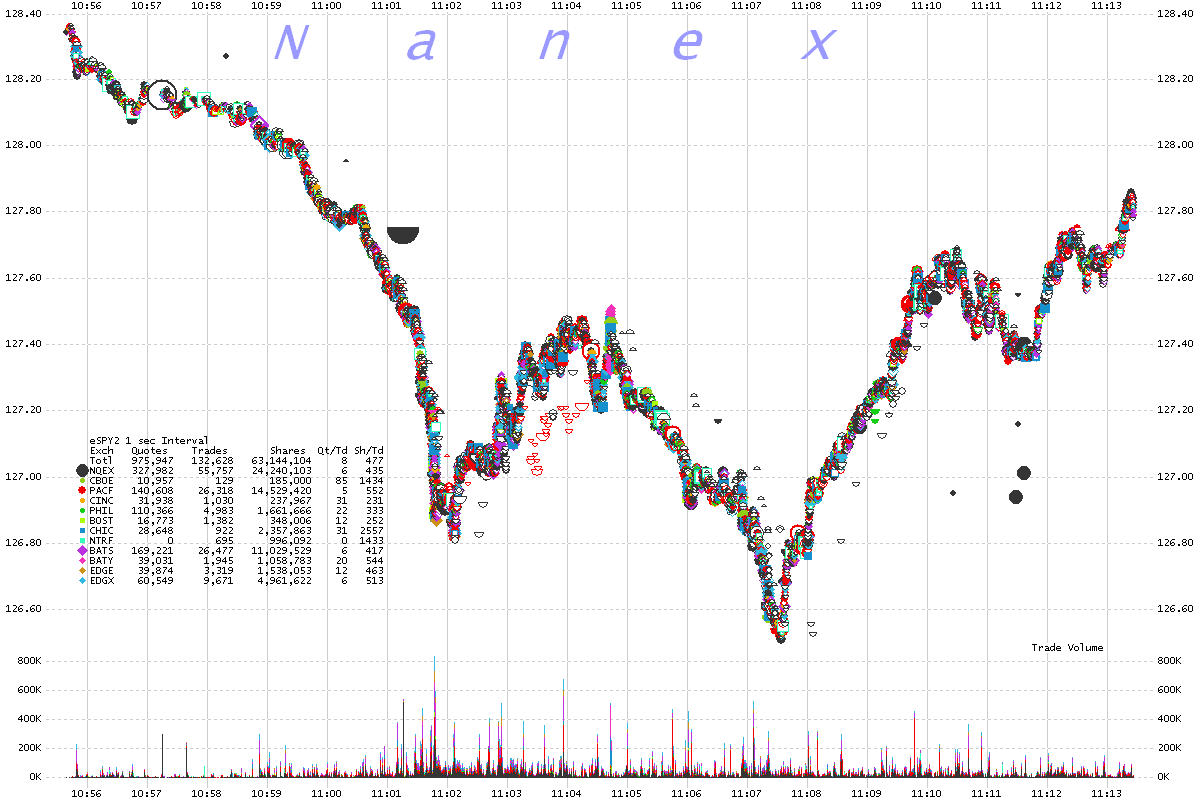
Nanex ~ 04-Oct-2012 ~ SPY Money Gram
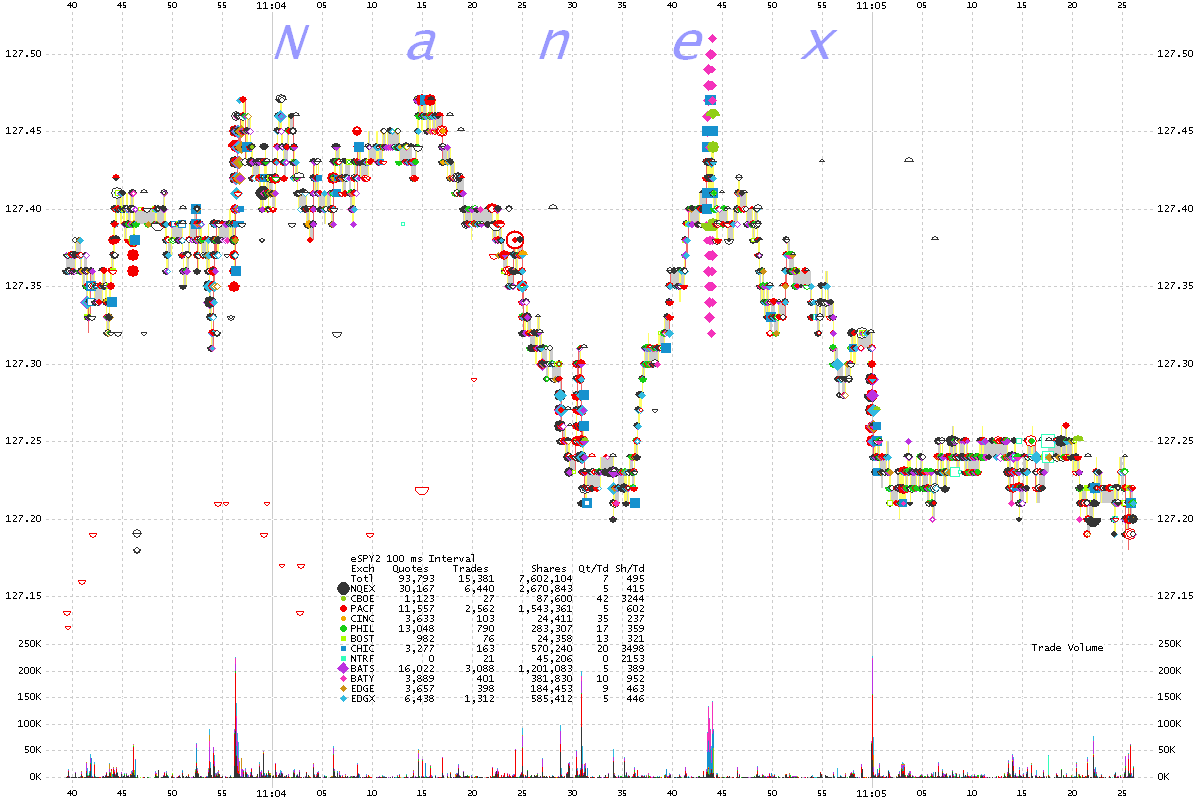
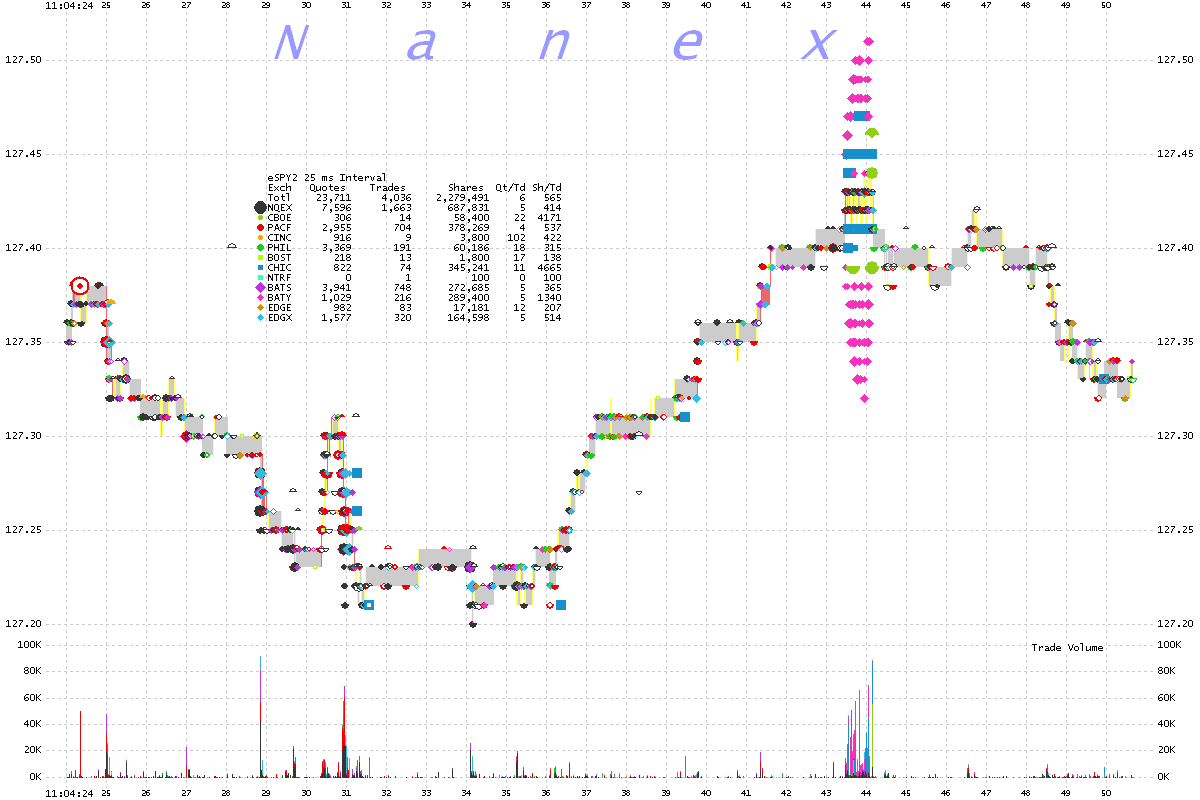
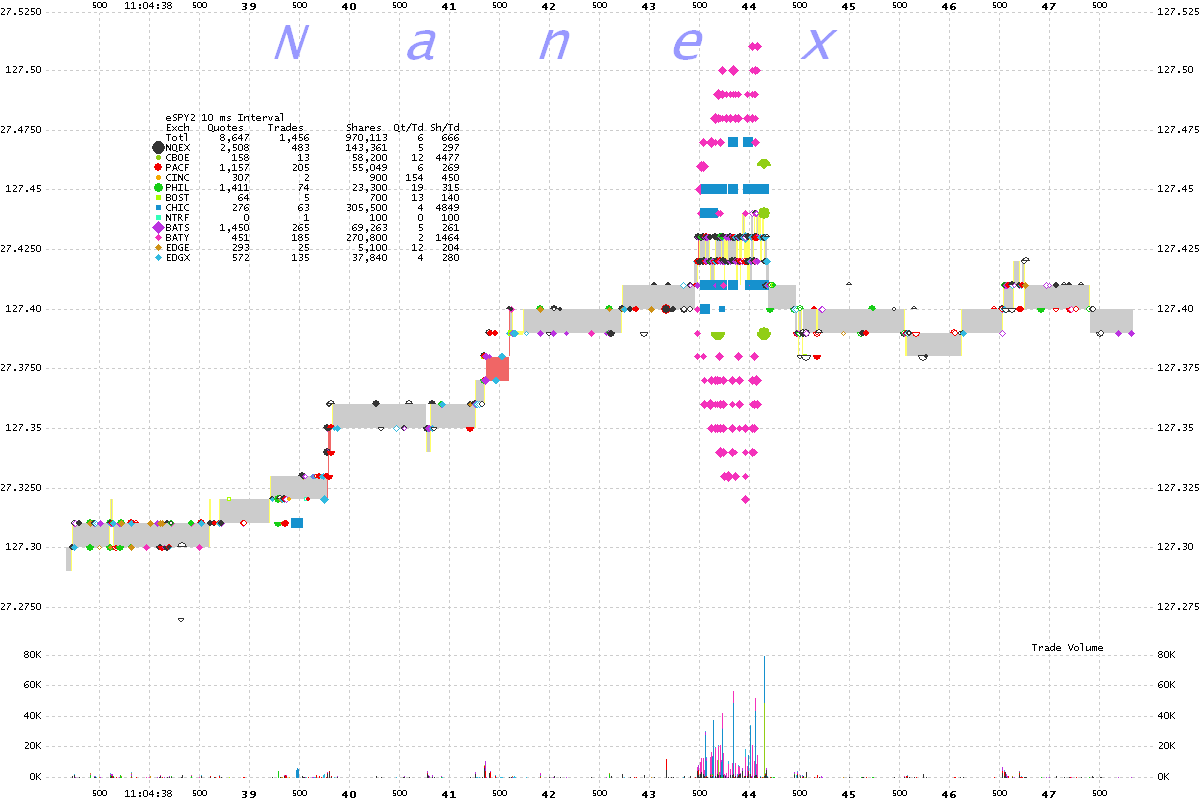
On March 16, 2011 a bizarre formation appeared from the trades in SPY. Upon closer inspection,
this looks like either a new algorithm designed to lose money fast, or a way to transfer
millions of dollars from one account to another.
Here is a link to a google spreadsheet of the trades involved.
1. SPY 1 second interval chart showing trades color coded by reporting exchange
2. SPY 100 millisecond interval chart showing trades color coded by reporting exchange
3. SPY 25 millisecond interval chart showing trades color coded by reporting exchange
4. SPY 10 millisecond interval chart showing trades color coded by reporting exchange
5. SPY 2 millisecond interval chart showing trades color coded by reporting exchange
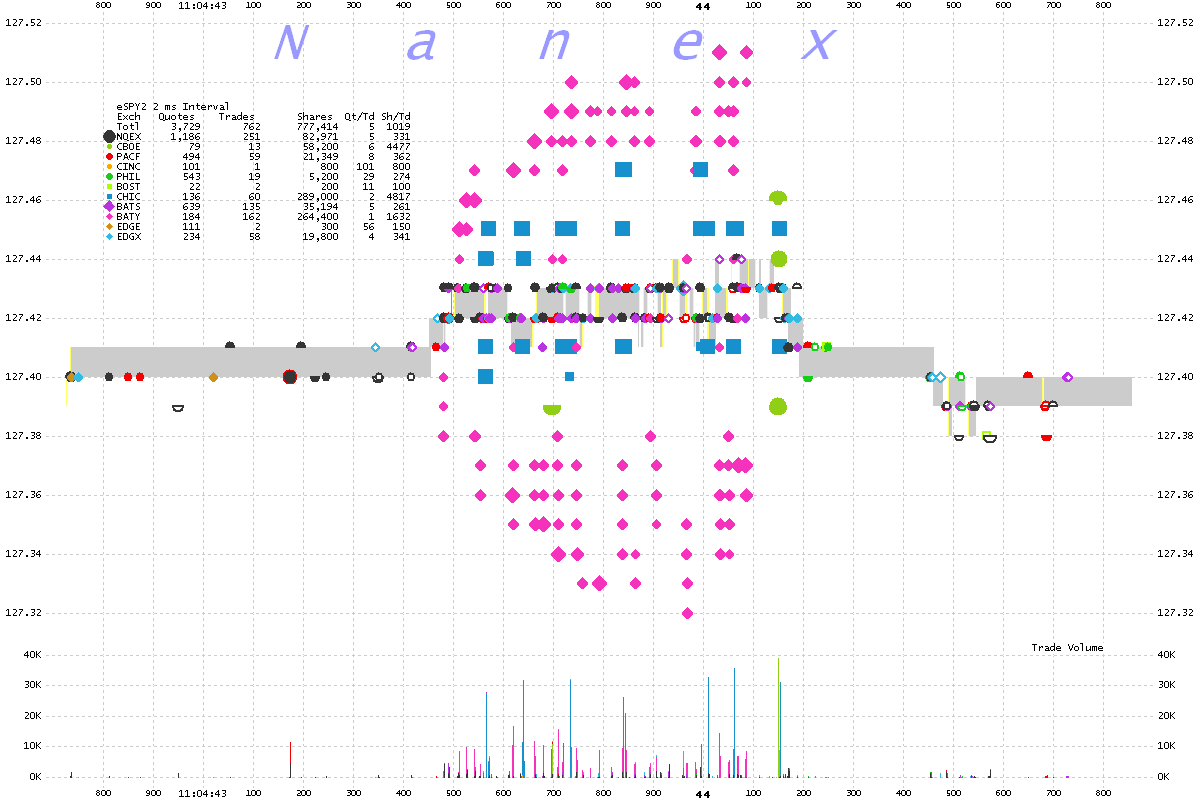
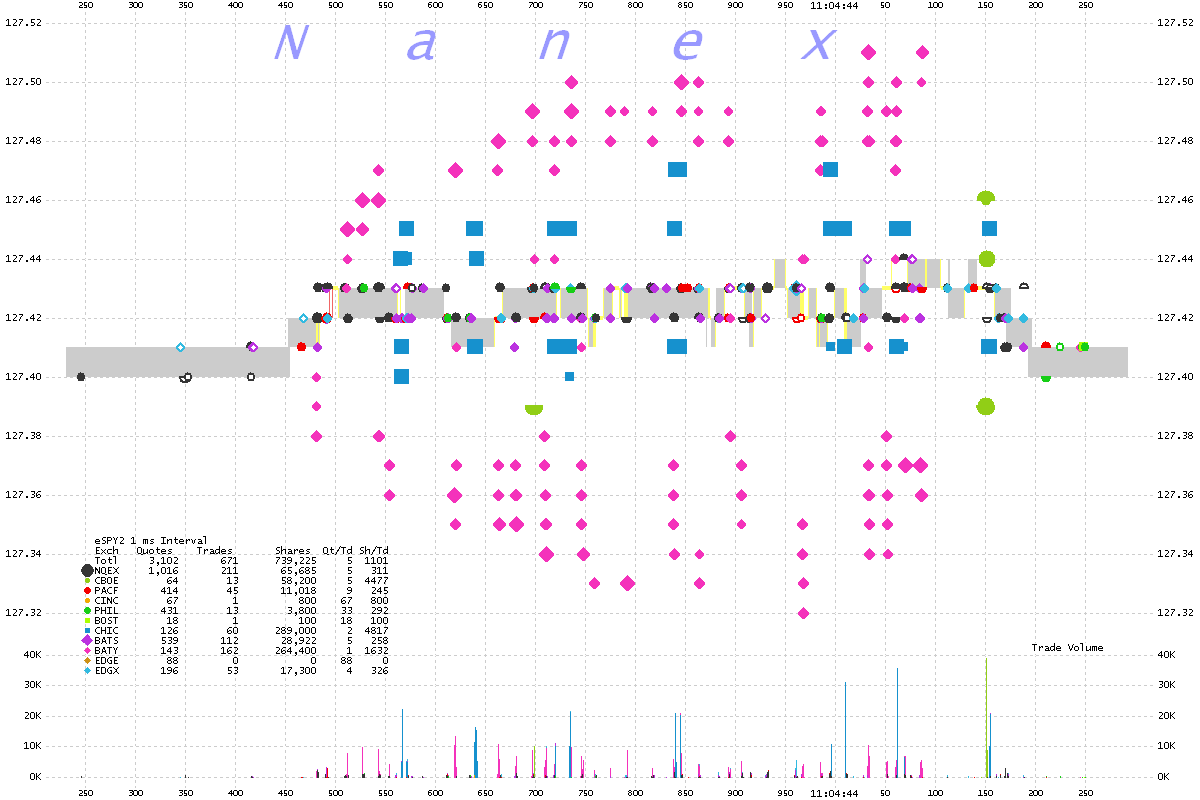
6. SPY 1 millisecond interval chart showing trades color coded by reporting exchange
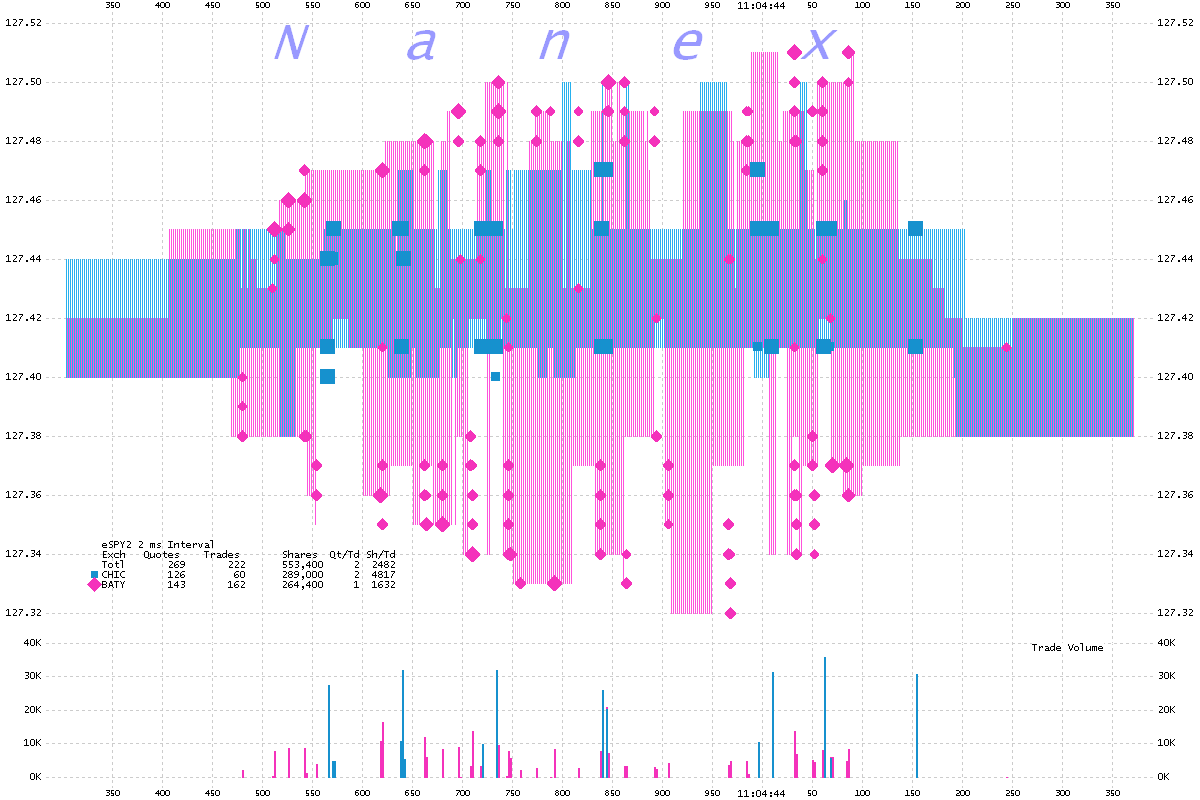
7. SPY 2 millisecond interval chart showing quote spread and trades for BAT-Y
and Chicago
Nanex Research
Inquiries: pr@nanex.net


