Nanex Research

Nanex ~ 10-Oct-2012 ~ PCS Falls 10%, EDGE-X Gets Behind
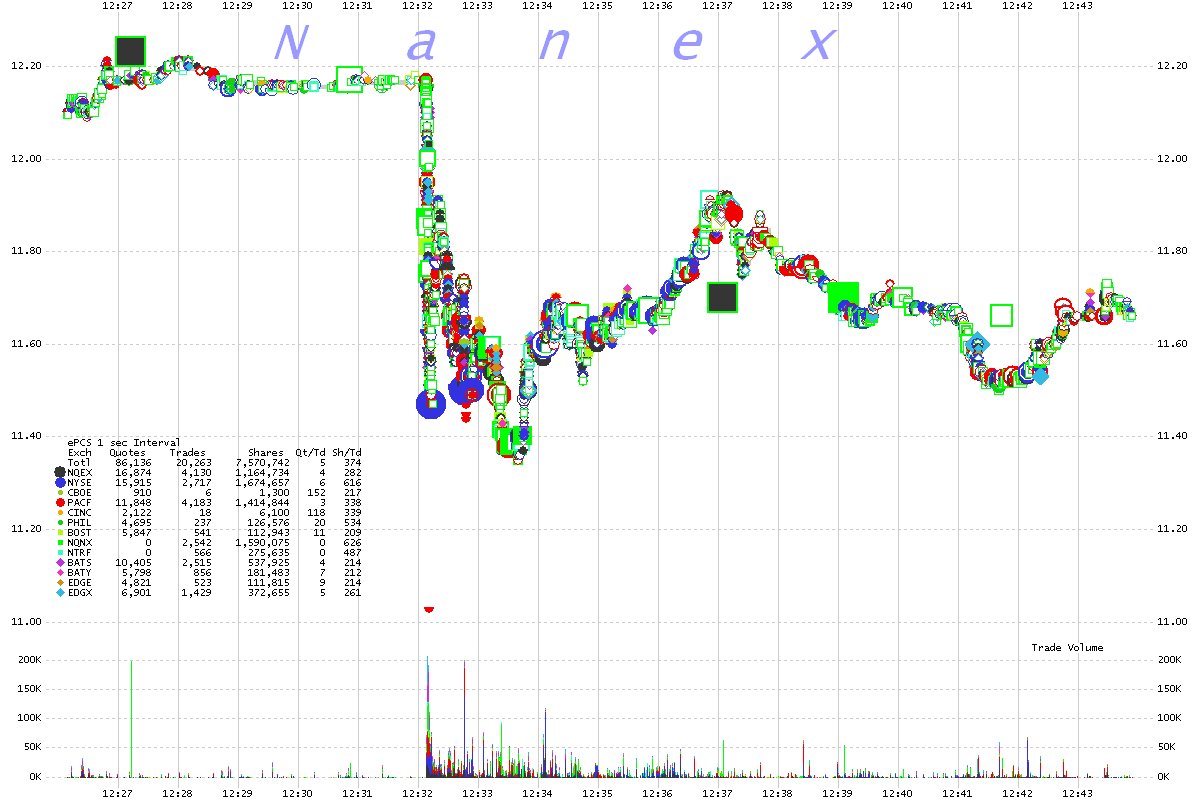
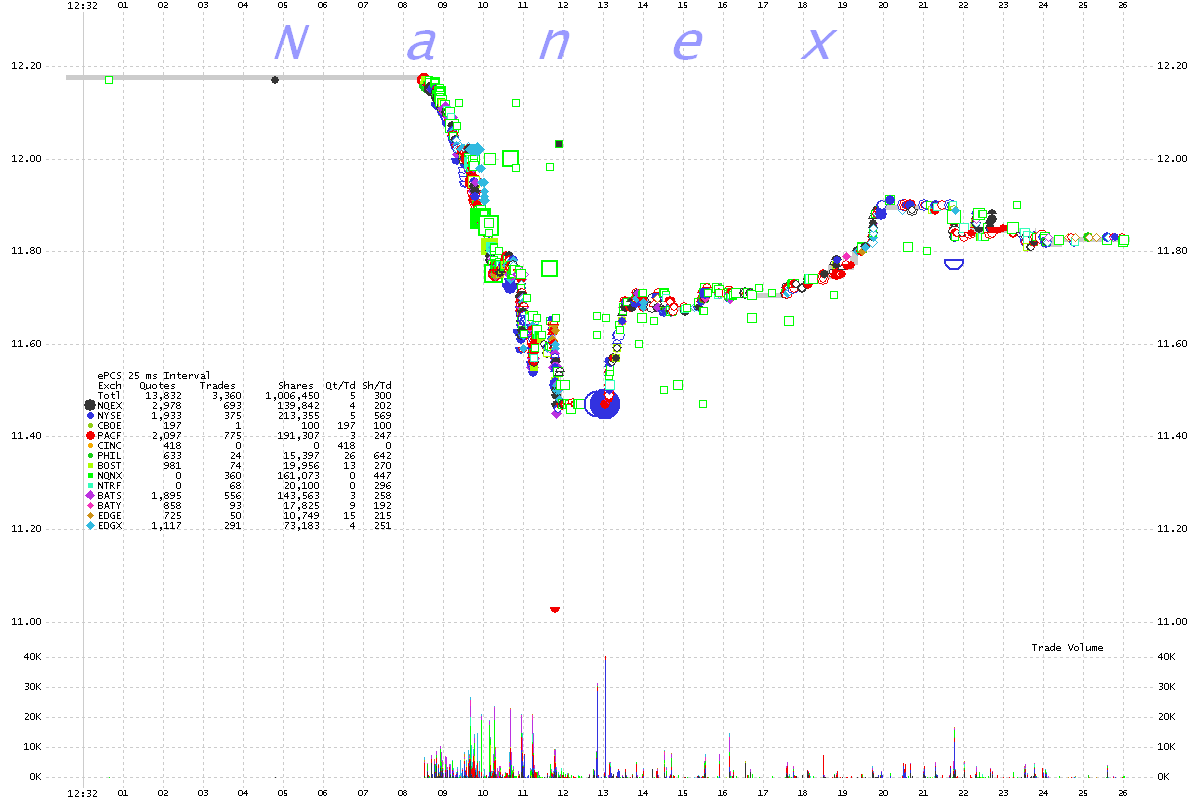
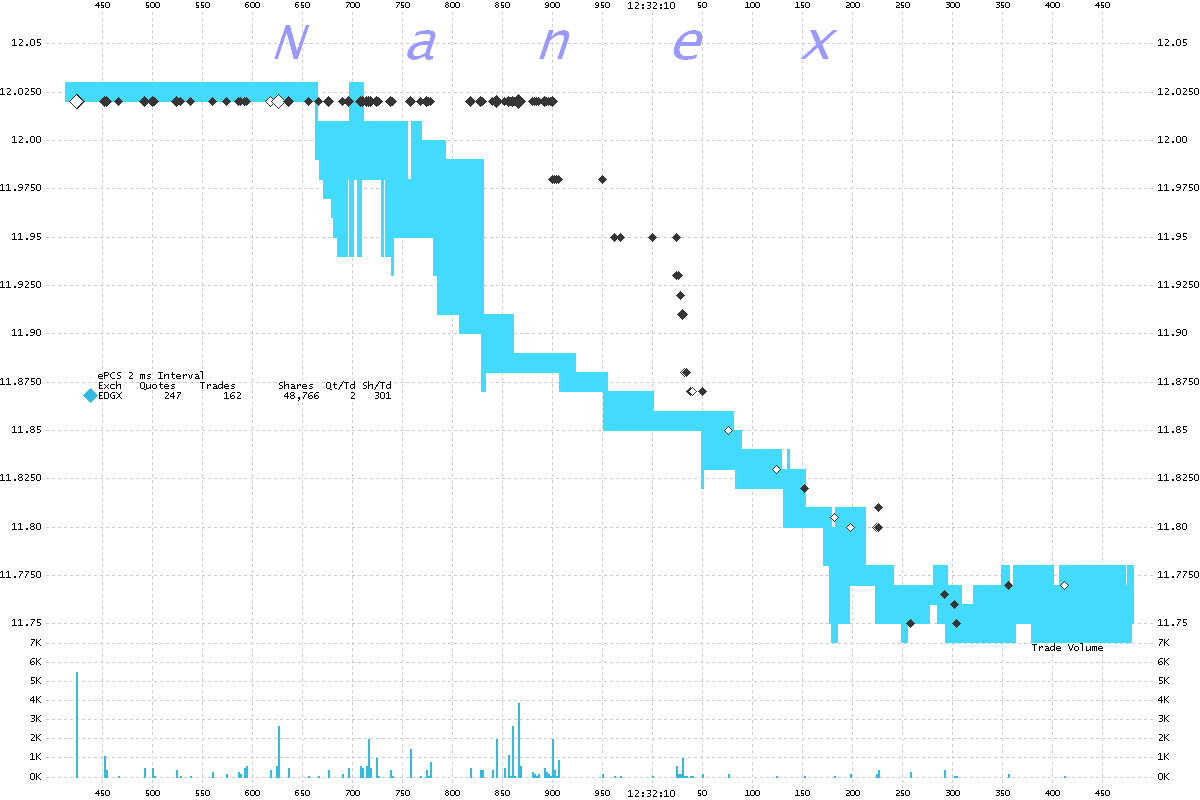
On October 10, 2012 between 12:32:08 and 12:32:12, the stock of PCS dropped about 9.6%.
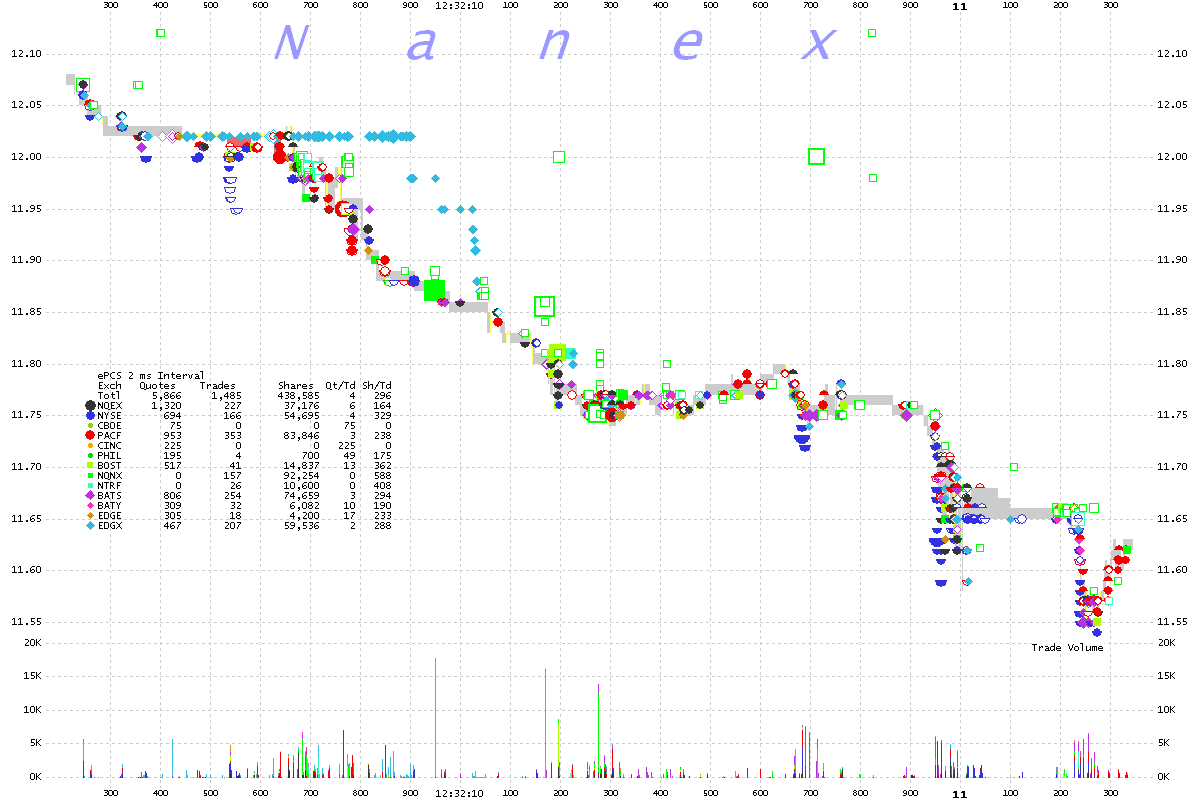
During the drop, it becomes apparent that trade reports from EDGE-X get delayed (charts
4 and 5).
1. PCS 1 second interval chart showing trades color coded by exchange.
Note the one trade from ARCA (red) near $11.
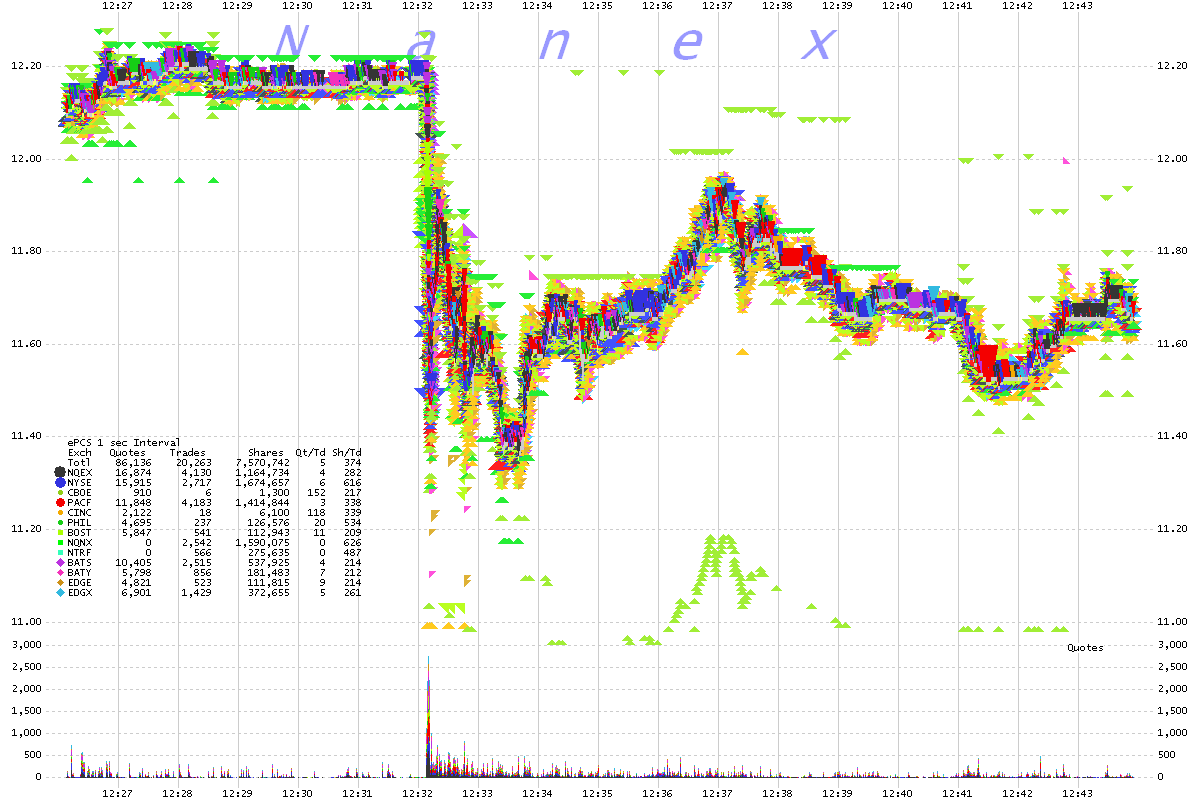
2. PCS 1 second interval chart showing bids and asks color coded by exchange.
3. PCS 25 millisecond interval chart showing trades color coded by exchange
4. PCS 2 millisecond interval chart showing trades color coded by exchange
Note how trades from EDGE-X (light blue), lag behind the others.
5. PCS 2 millisecond interval chart showing trades and quote spread for EDGE-X
Note how the trades lag the quote.
6. PCS Tick Chart

7. PCS Tick Chart

8. PCS Tick Chart

Nanex Research
Inquiries: pr@nanex.net


