Nanex Research

Nanex ~ 23-Oct-2012 ~ Picture Perfect
On October 23, 2012, starting at 9:50:30, an algo began selling blocks
of stock every 3 seconds. Looking closely, we were surprised to see the market behaved
as expected. Only ISO orders executed outside the NBBO, and all other orders within
the NBBO. Not long ago, we would see a much different picture. Chaos. Chaos, everywhere.
These charts also demonstrate that liquidity (in this symbol) recharges after about 3
seconds.
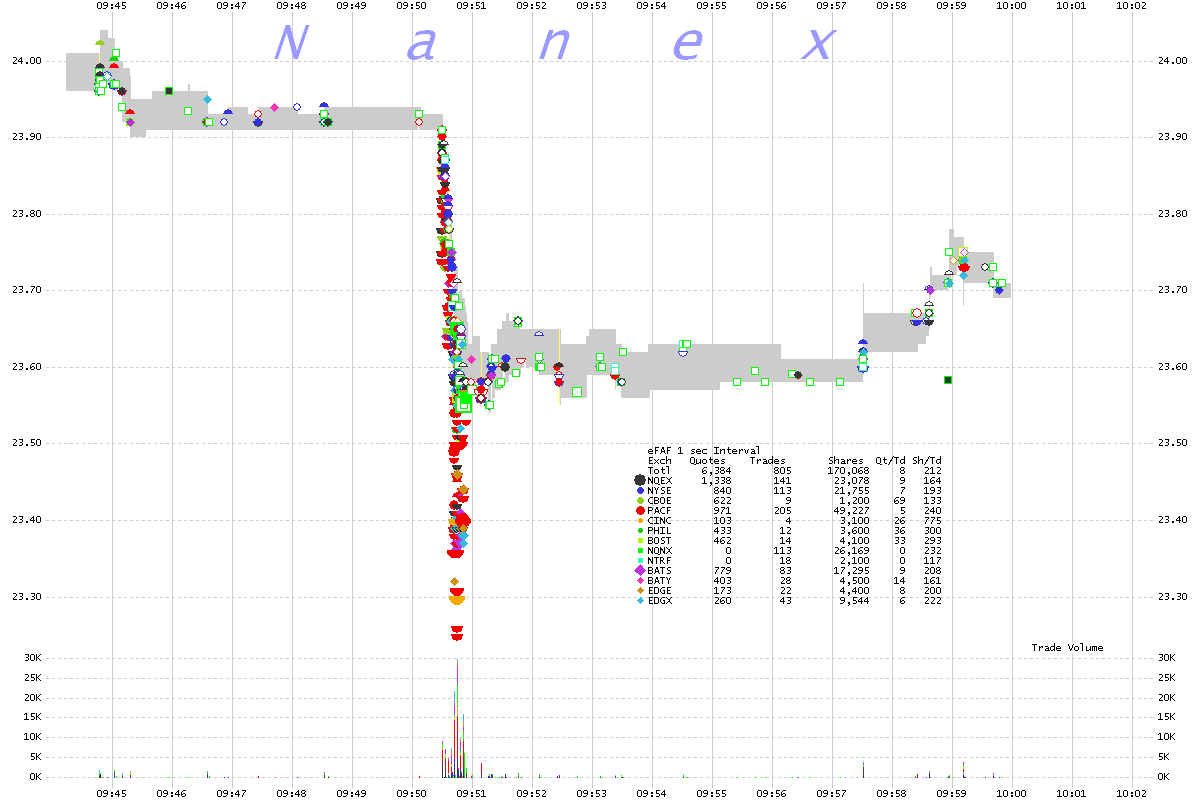
1. FAF 1 second interval chart showing trades color coded by exchange.
At this resolution, the drop looks typical, except for the odd spacing in the lower
volume panel, which is the first indication the order was split up and timed. The multiple
colors indicates wide participation from many exchanges
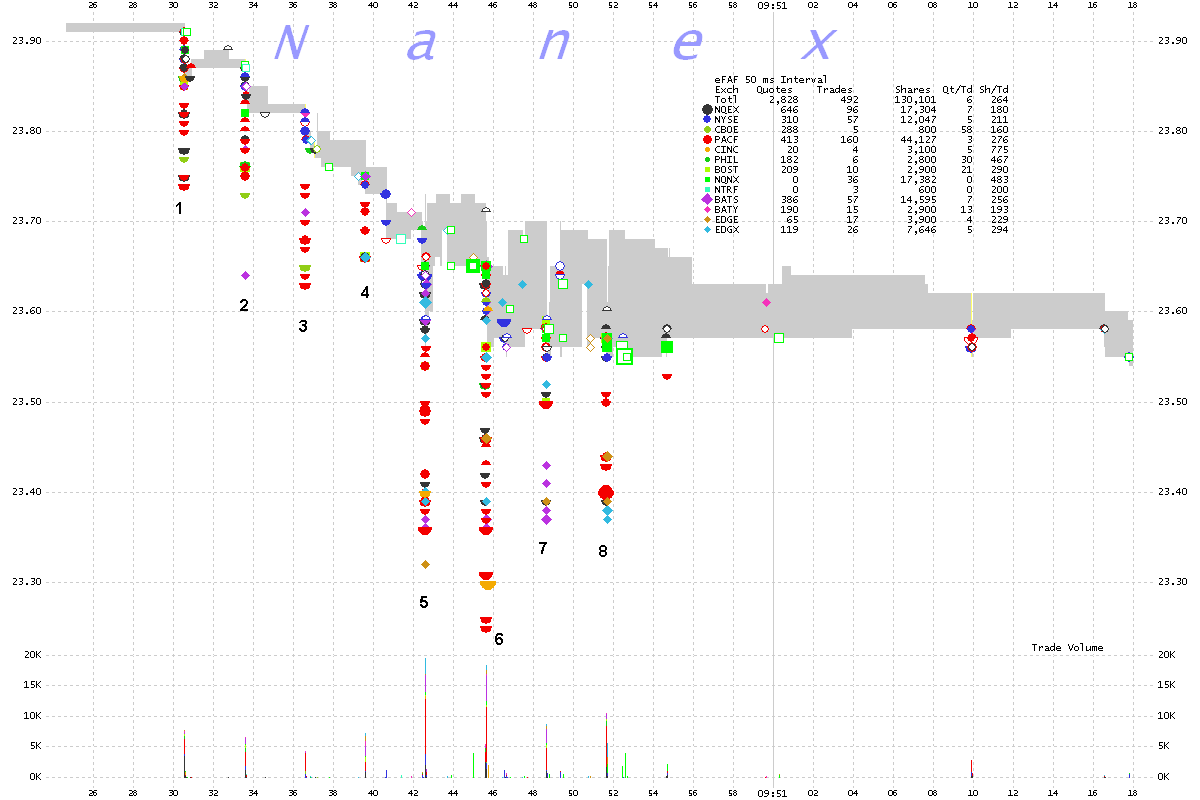
2. FAF 50 millisecond interval chart showing trades color coded by exchange.
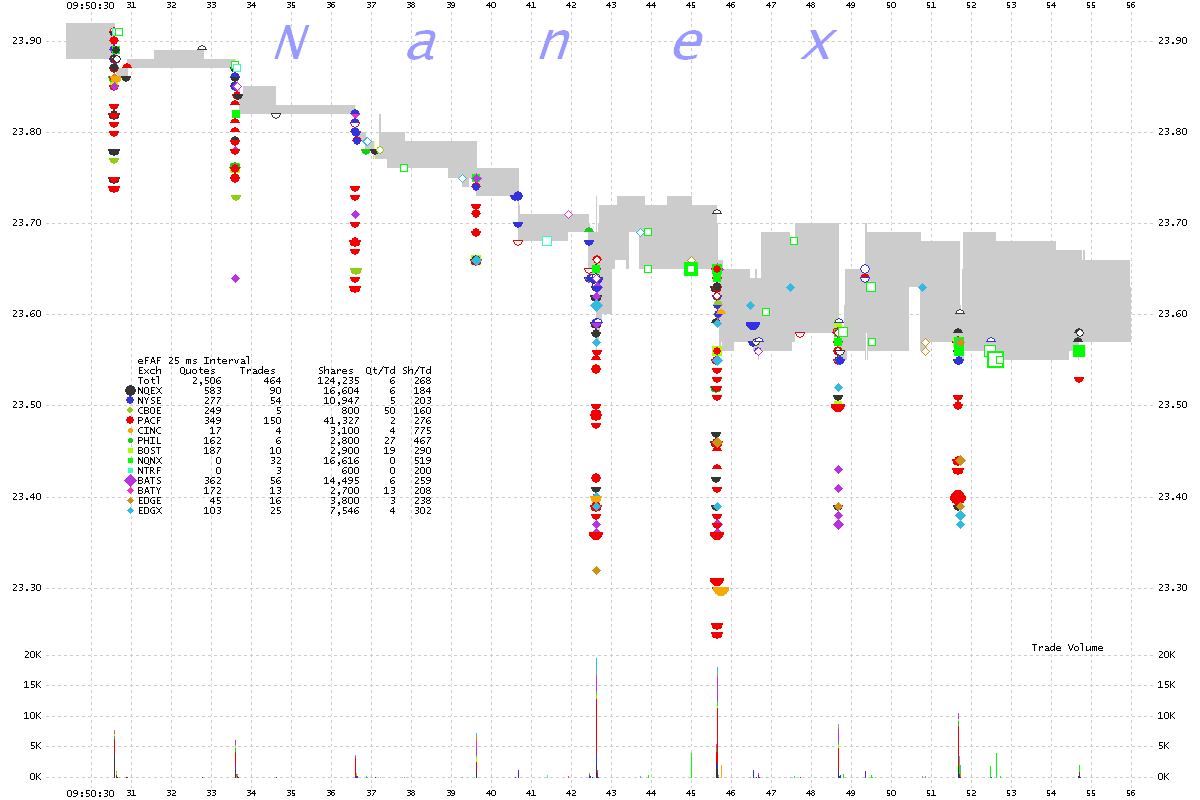
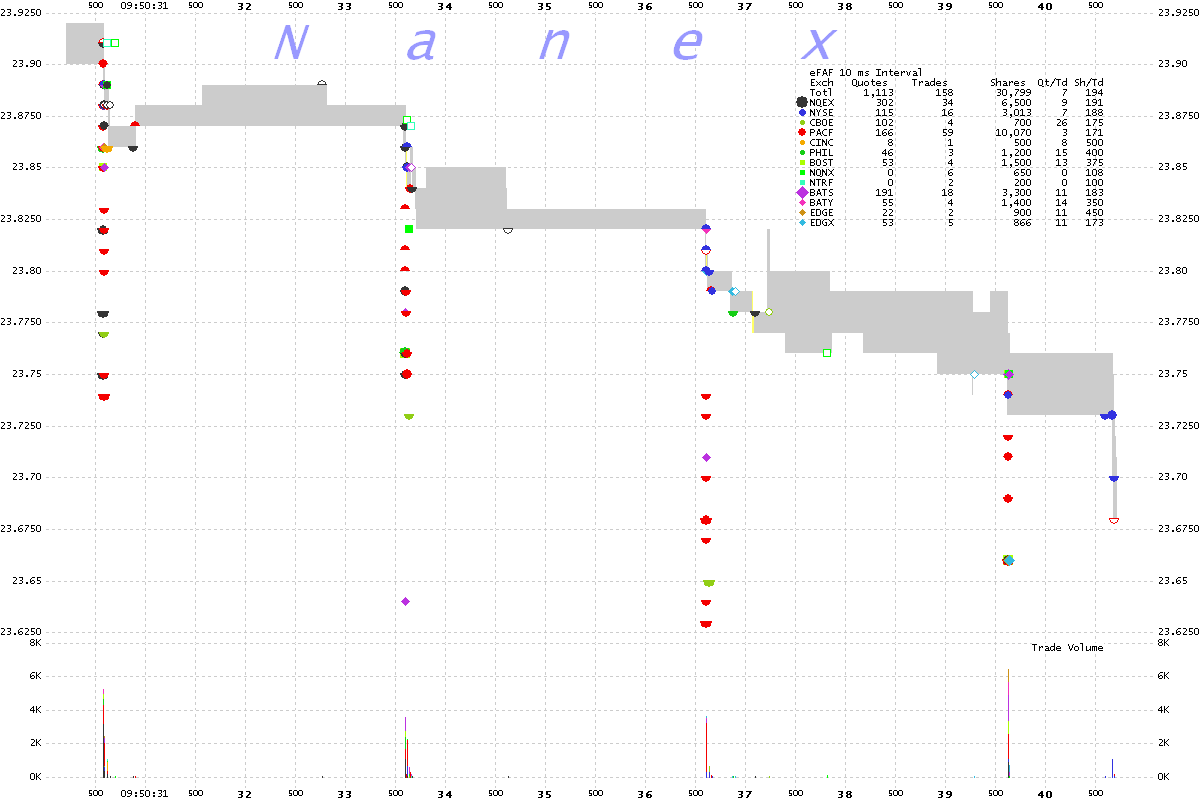
This is a fascinating chart and worth studying. First, note that there are actually
8 price spikes (labelled 1-8), each separated by 3 seconds. Drop 2 indicates that new buy orders must have appeared within the 3 seconds since drop 1. Likewise, drop 3 indicates
new buy orders in the book that didn't exist during drop 2 and so on through drop 8.
Note how the NBBO (gray shading) gradually falls in response to each drop. Liquidity
on a short term basis (under 3 seconds) is much different than liquidity on a longer
term. We wonder why the designers of the sell algo chose a constant timed interval,
rather than waiting for the book to rebuild (by monitoring order add messages to the
books). A likely answer: with so many fake orders appearing in today's marketplace,
a timed approach is far simpler to implement and achieves the desired result.
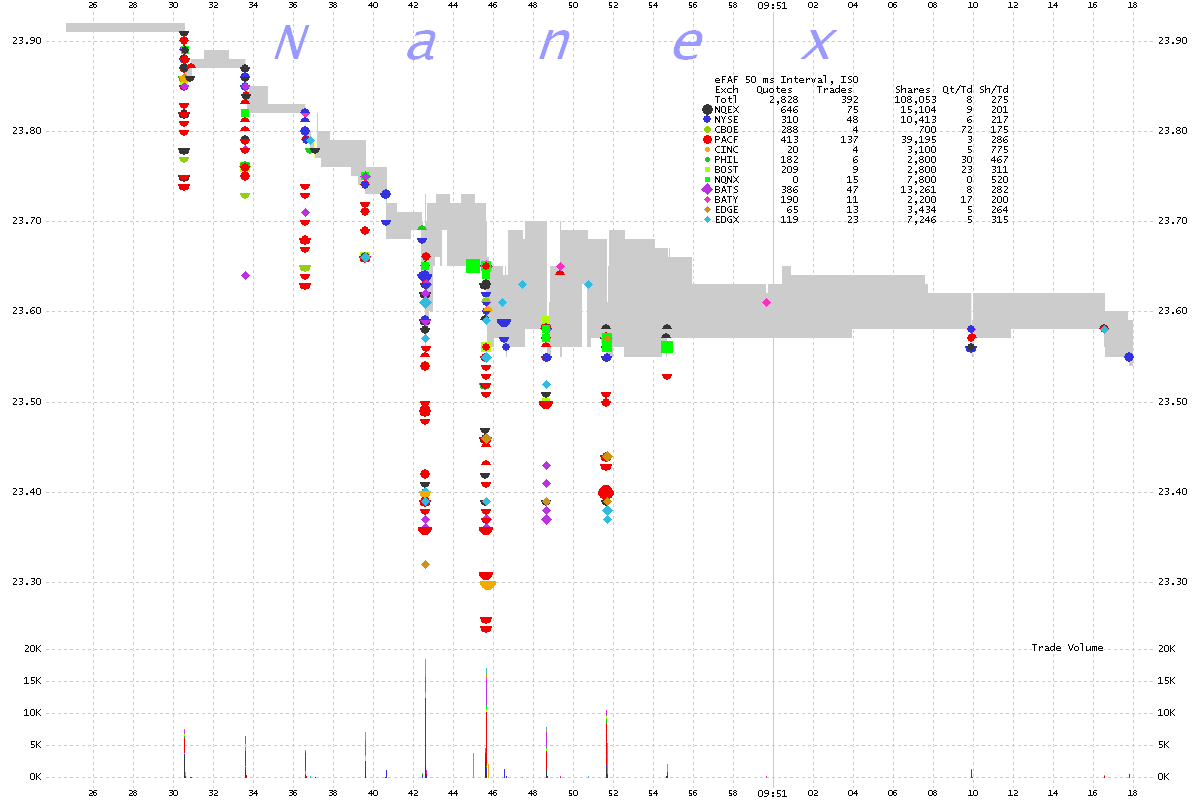
3. FAF 50 millisecond interval chart showing only ISO trades color coded by exchange.
This is exactly what we would expect. The ISO trades trade through the NBBO (gray shade).
ISO stands for Intermarket Sweep Order, and is a tool used by traders to indicated they
are "sweeping" order books at all exchanges so each exchange doesn't need to check the
NBBO for trade through price protection.
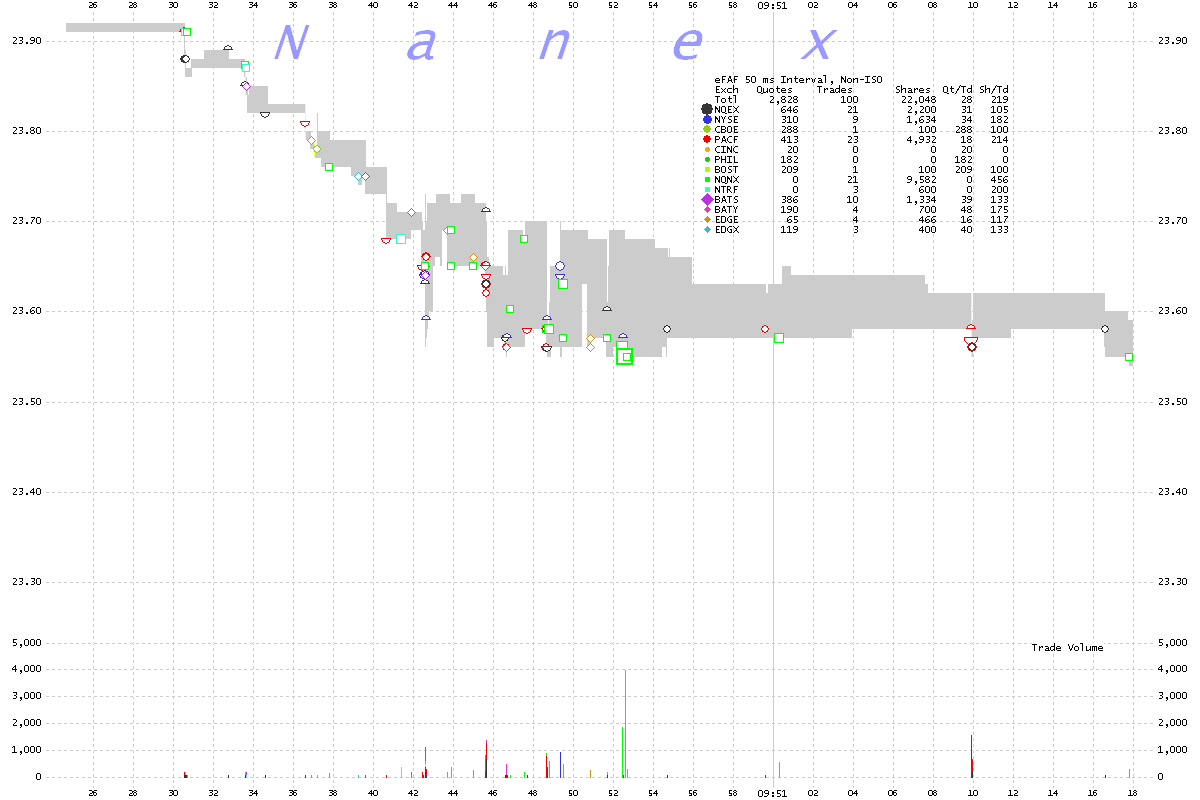
4. FAF 50 millisecond interval chart showing only non-ISO trades color coded by exchange.
Again, this is exactly what we would expect. The non-ISO trades trade at the NBBO (gray shade)
5. FAF 25 millisecond interval chart showing trades color coded by exchange.
6. FAF 10 millisecond interval chart showing trades color coded by exchange.
Nanex Research
Inquiries: pr@nanex.net


