Nanex Research

Nanex ~ 06-Nov-2012 ~ OCN Patience
On November 6, 2012, the stock
of Ocwen Financial (symbol OCN) illustrates
the cost of patience.
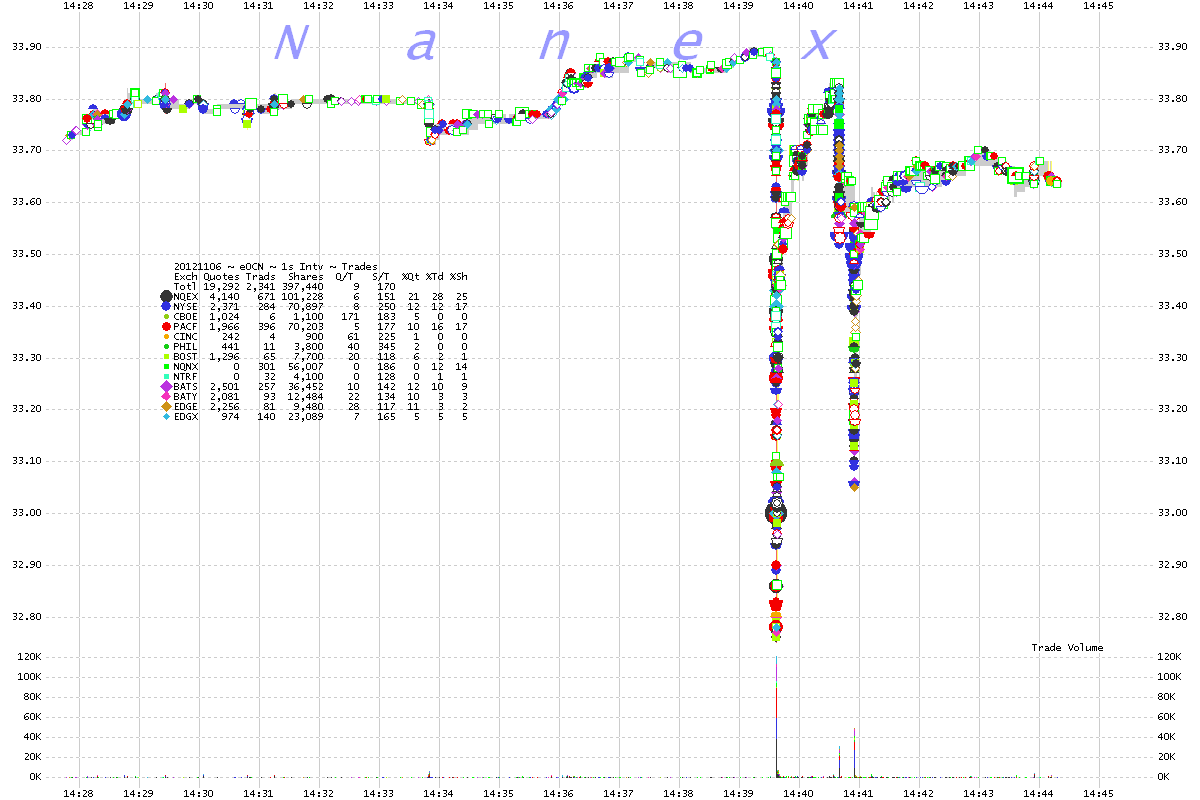
1. OCN ~ 1 second interval showing trades color coded by exchange.
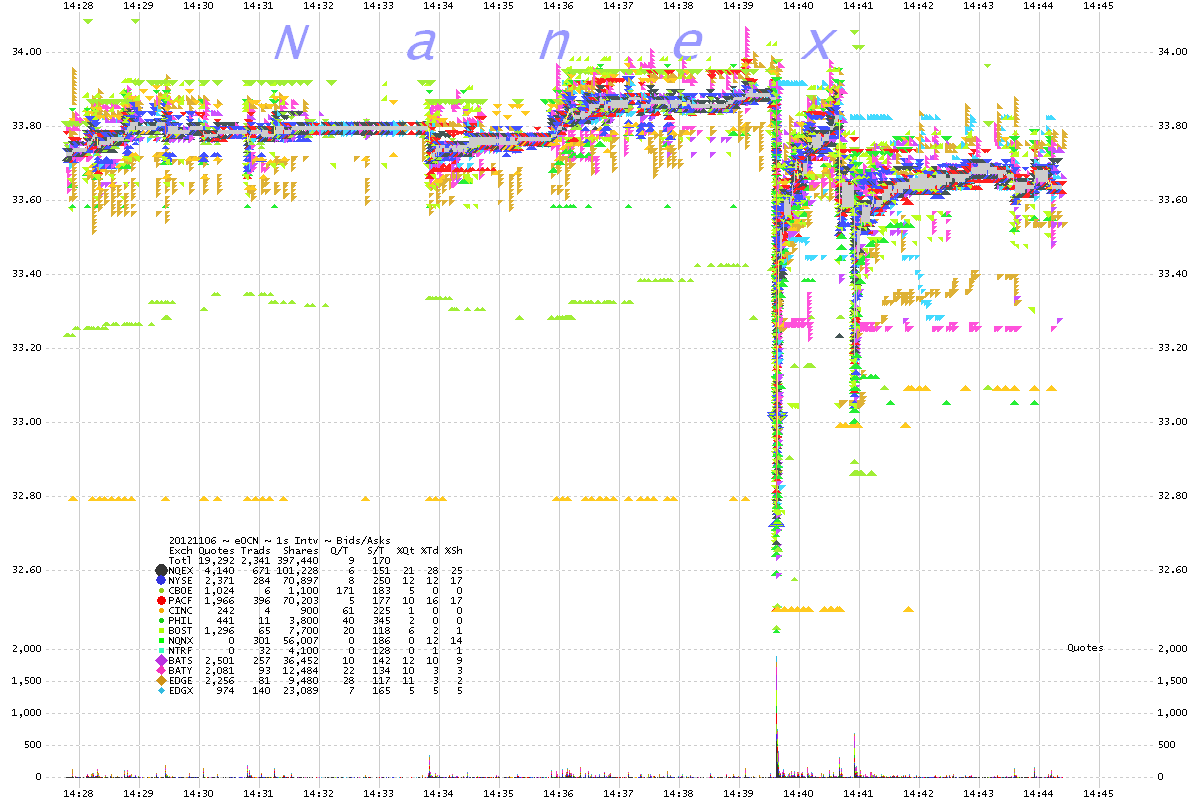
2. OCN ~ 1 second interval showing bids and asks color coded by exchange.
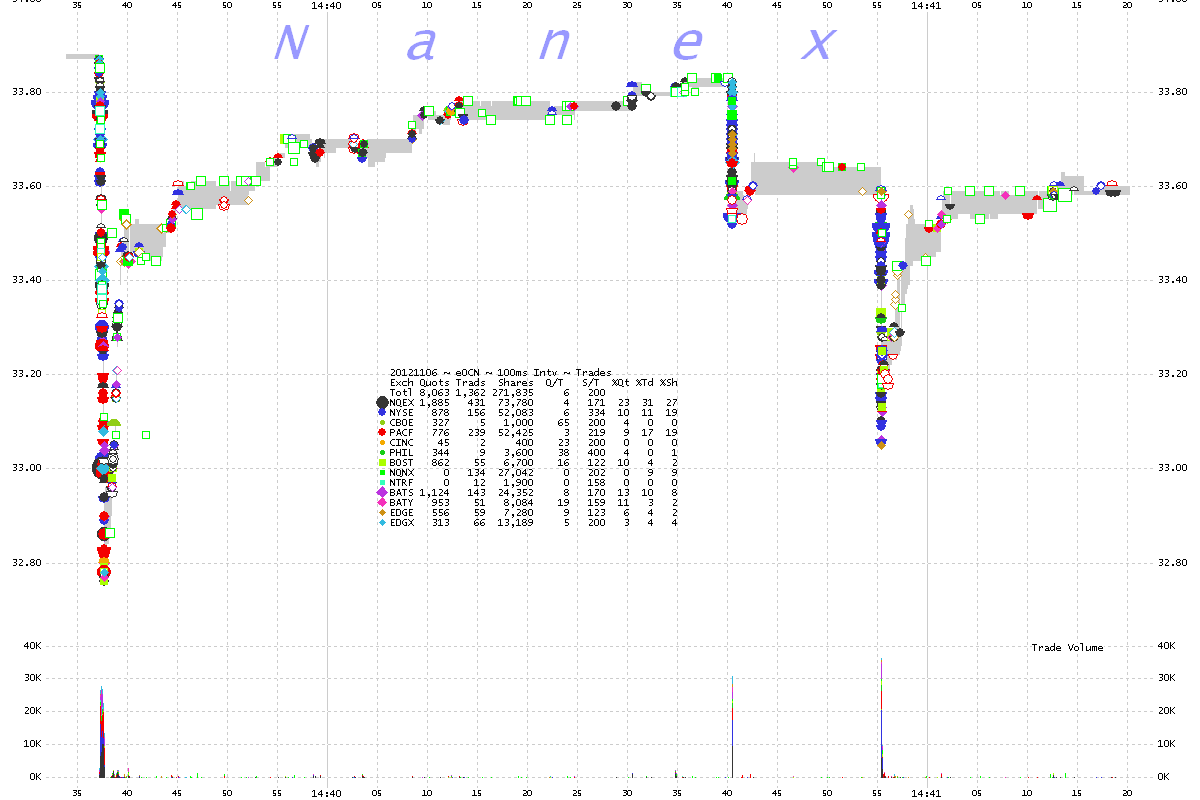
3. OCN 100 millisecond interval showing trades color coded by exchange.
You need a resolution below 1 second to clearly see the 3 price drops.
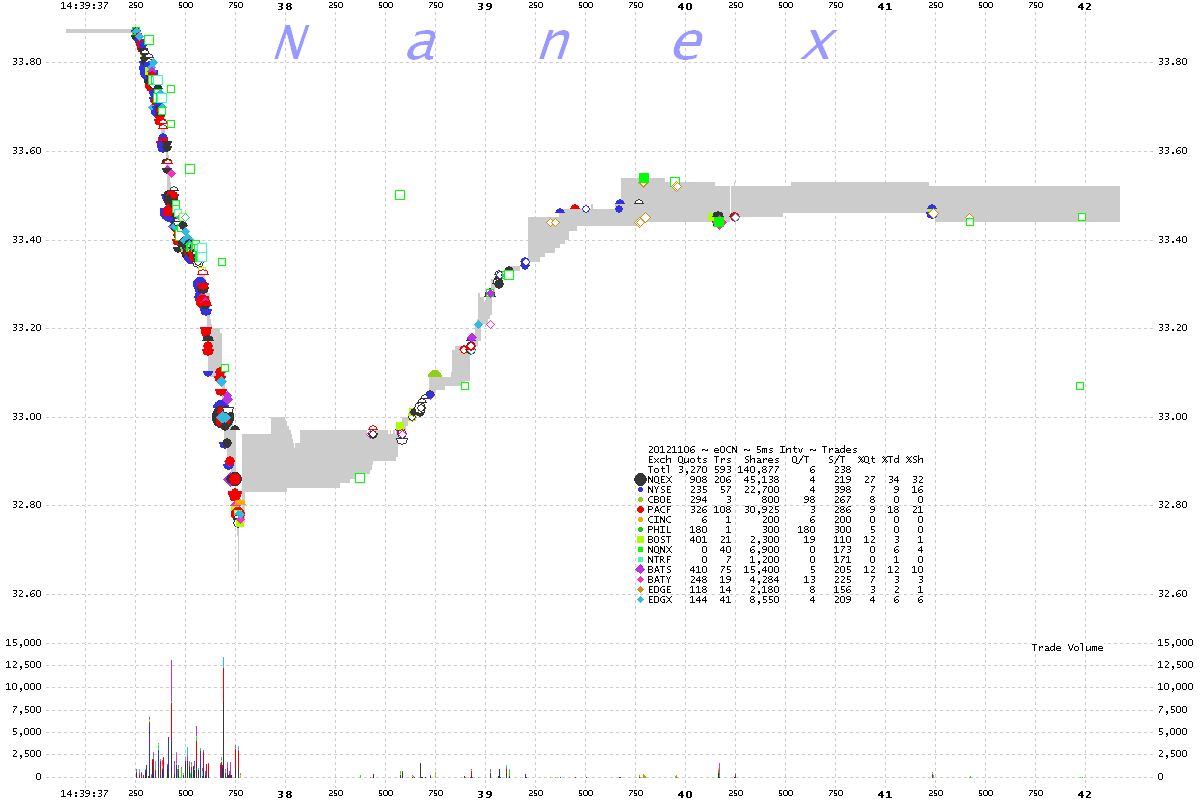
4. OCN 5 millisecond interval showing trades color coded by exchange.
First drop.
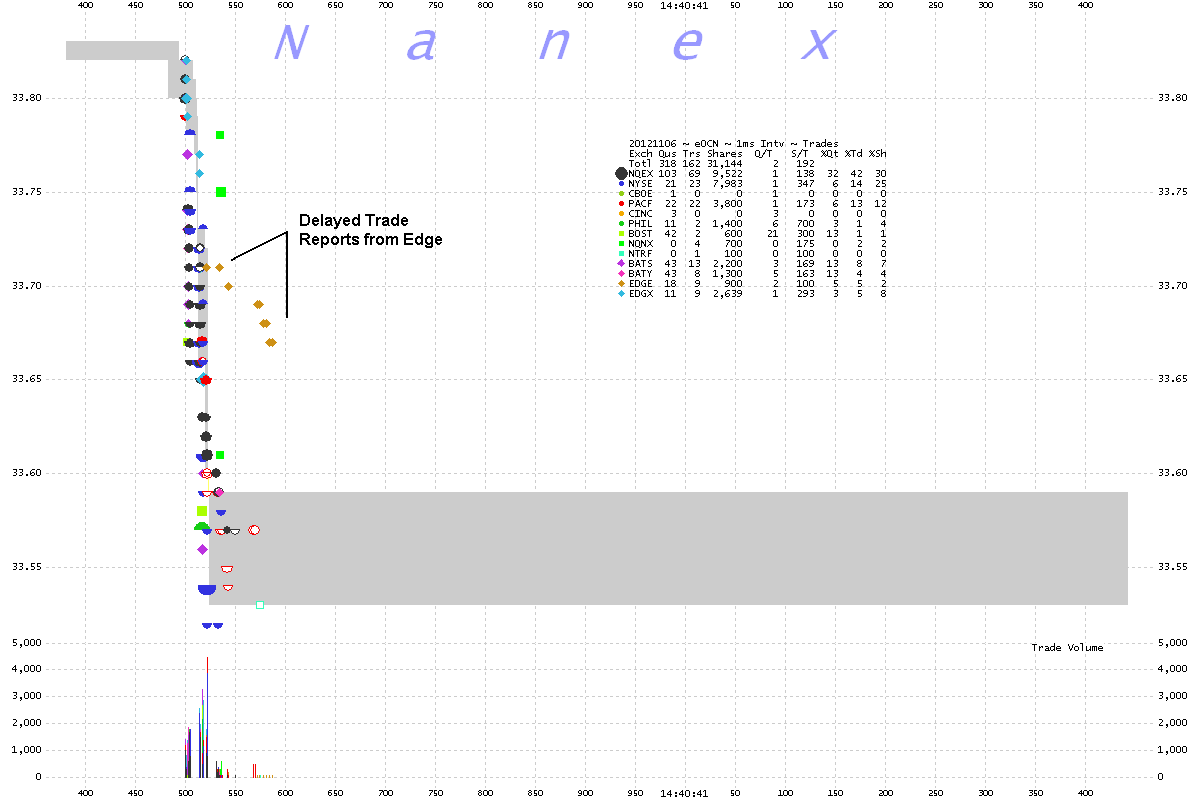
5. OCN 1 millisecond interval showing trades color coded by exchange.
Second drop. Note the delayed trade reports coming from Edge: this is common when trading
activity gets too fast.
The exchange will have to fix this or risk being
fined by the SEC.
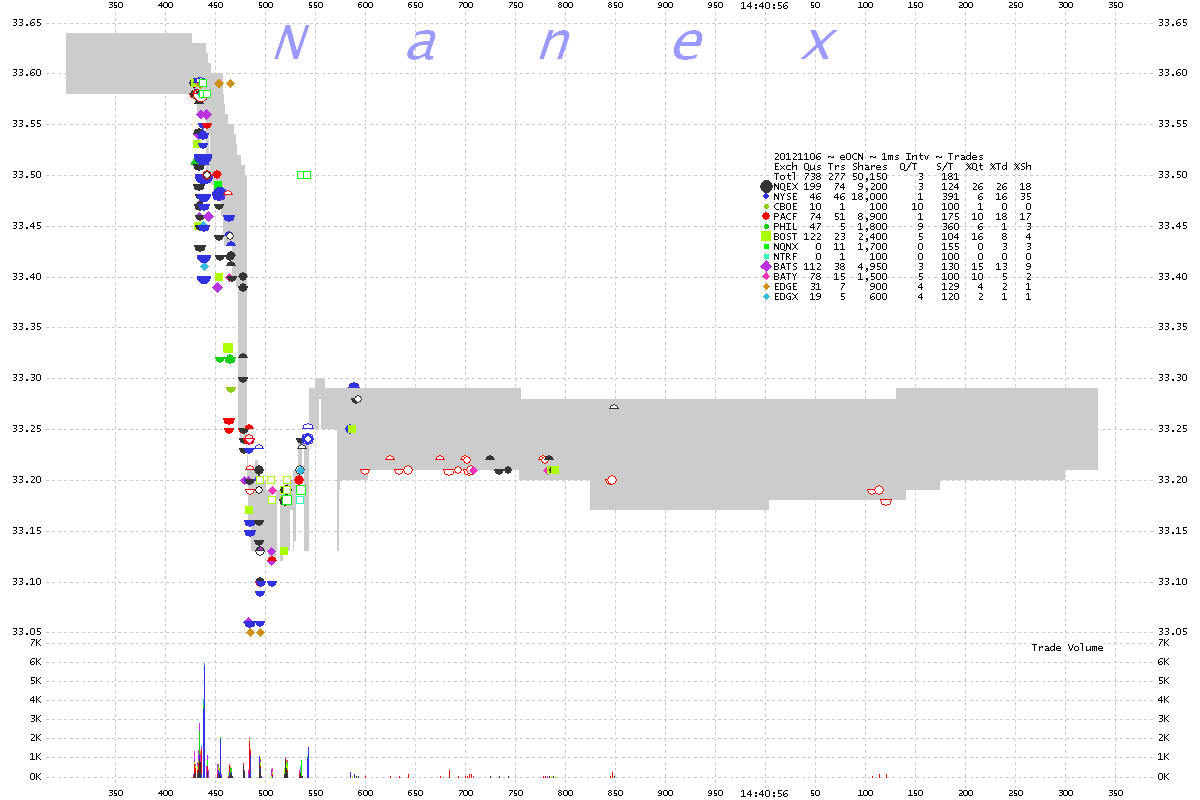
6. OCN 1 millisecond interval showing trades color coded by exchange.
Third drop. Chart shows 1 second of data.
Nanex Research
Inquiries: pr@nanex.net


