Nanex Research

Nanex ~ 07-Nov-2012 ~ Apple Crosses Over to the Dark Side
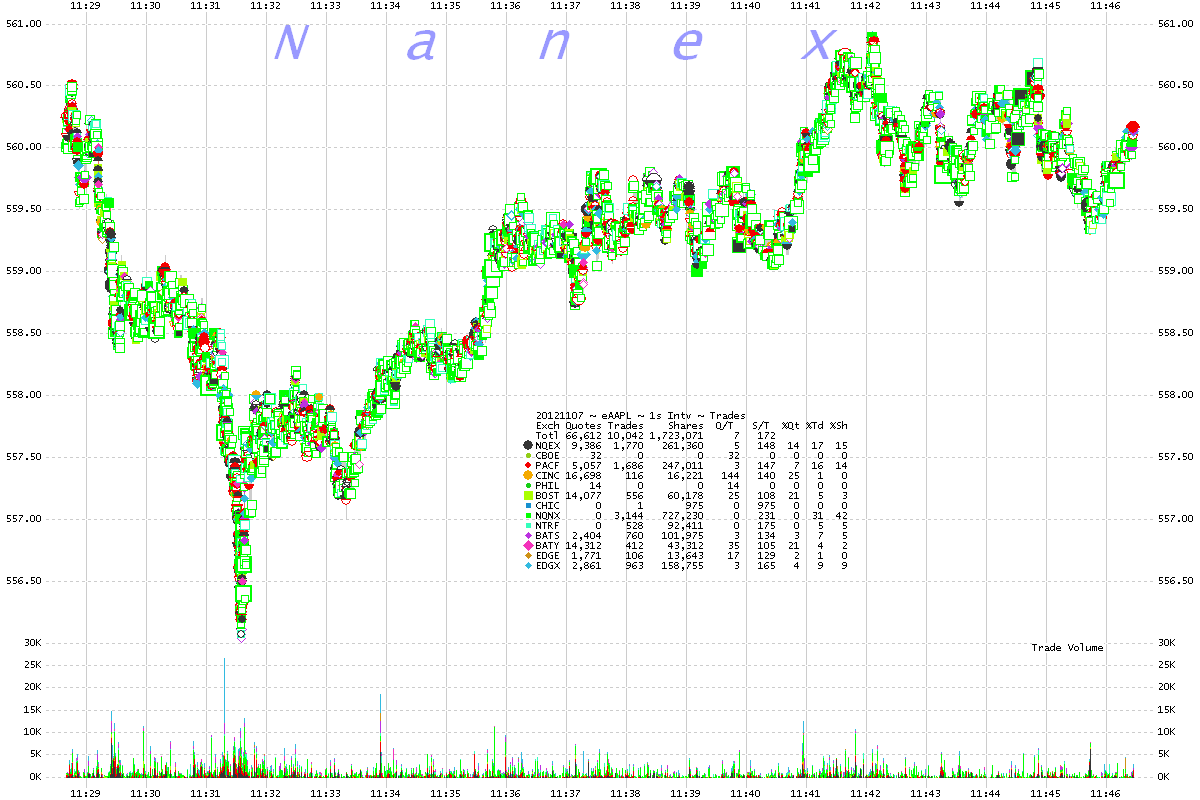
Dark pool trading in Apple during its sell off and recovery accounted for 36% of trades
and 47% of shares. In the charts below, the legend entries for NQNX and NTRF represent
trades reported from non-lit markets (dark pools and internalizers).
1. AAPL ~ 1 second interval showing all trades color coded by exchange.
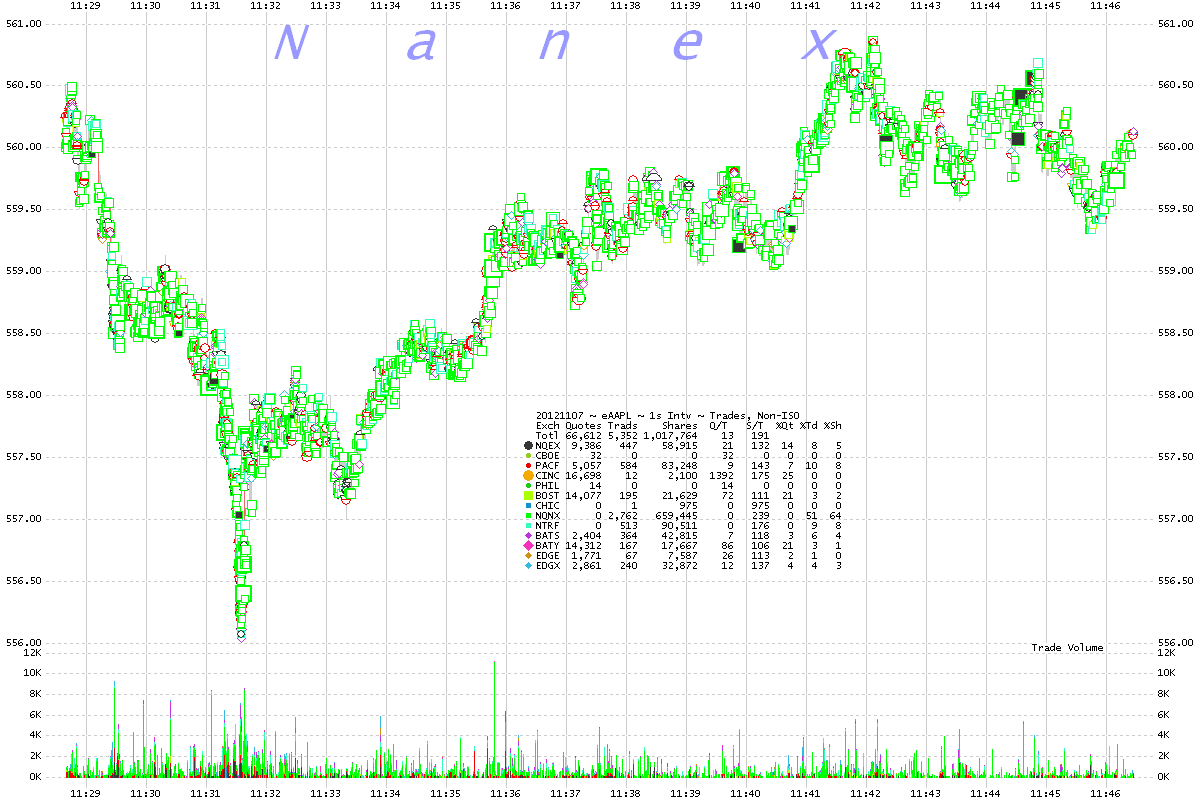
2. AAPL ~ 1 second interval showing non-ISO trades color coded by exchange.
For non-ISO trading, a full 60% of trades and 72% of shares were executed in non-lit
markets!
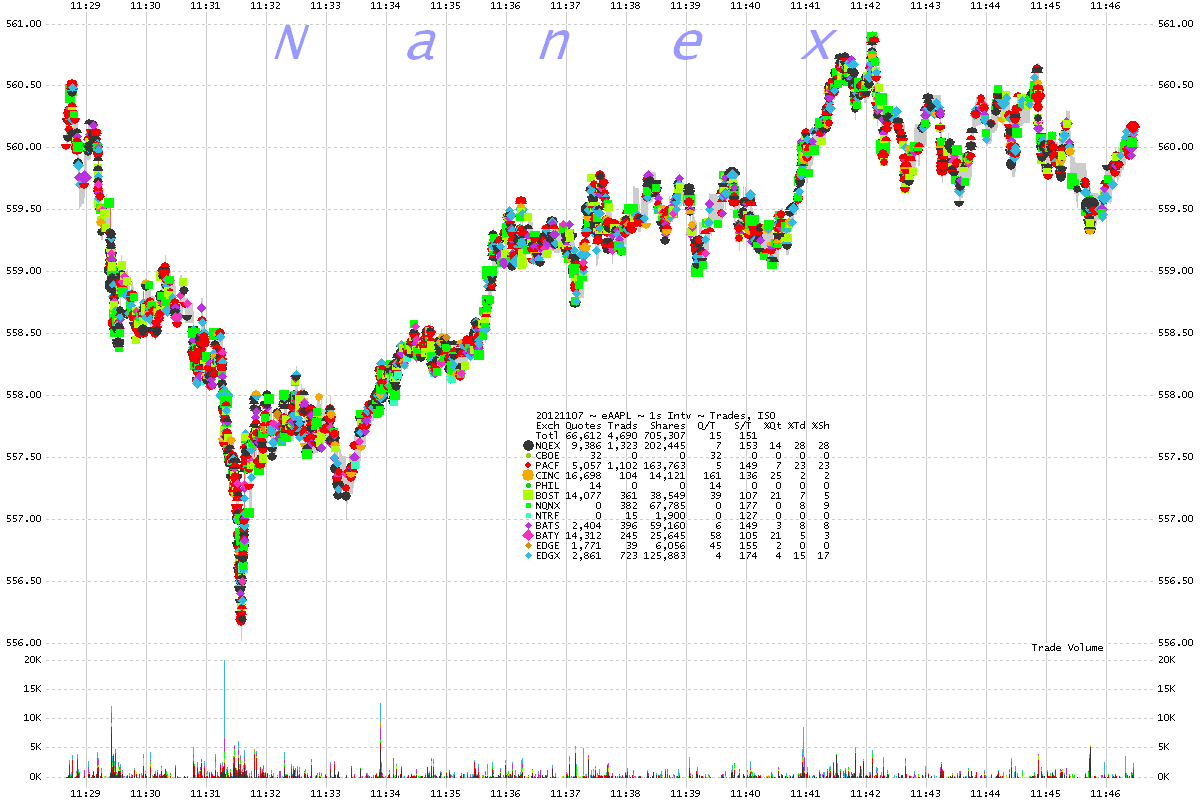
3. AAPL ~ 1 second interval showing ISO trades color coded by exchange.
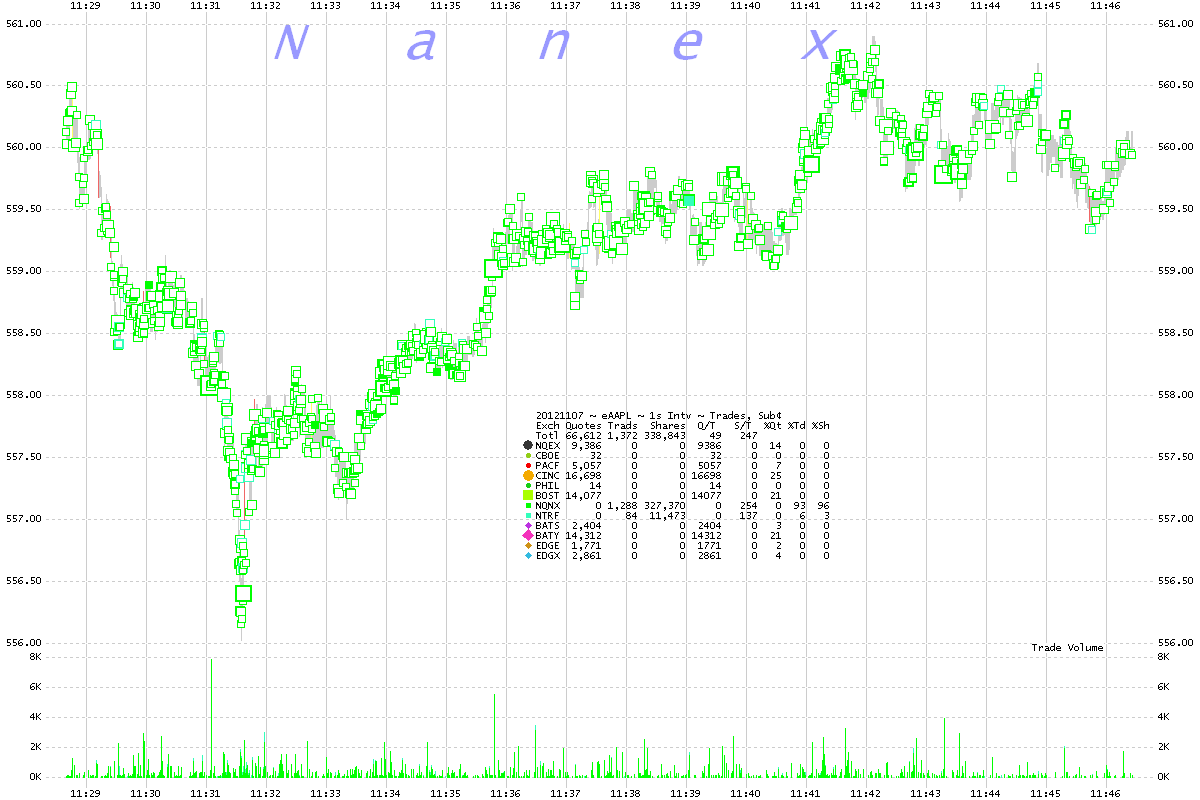
4. AAPL ~ 1 second interval showing sub-penny trades color coded by exchange.
Sub-penny trades
are mostly executed by internalizers. About 14% of trades and 20% of shares executed
at sub-penny prices.
5. AAPL ~ 1 second interval showing trades color coded by exchange.
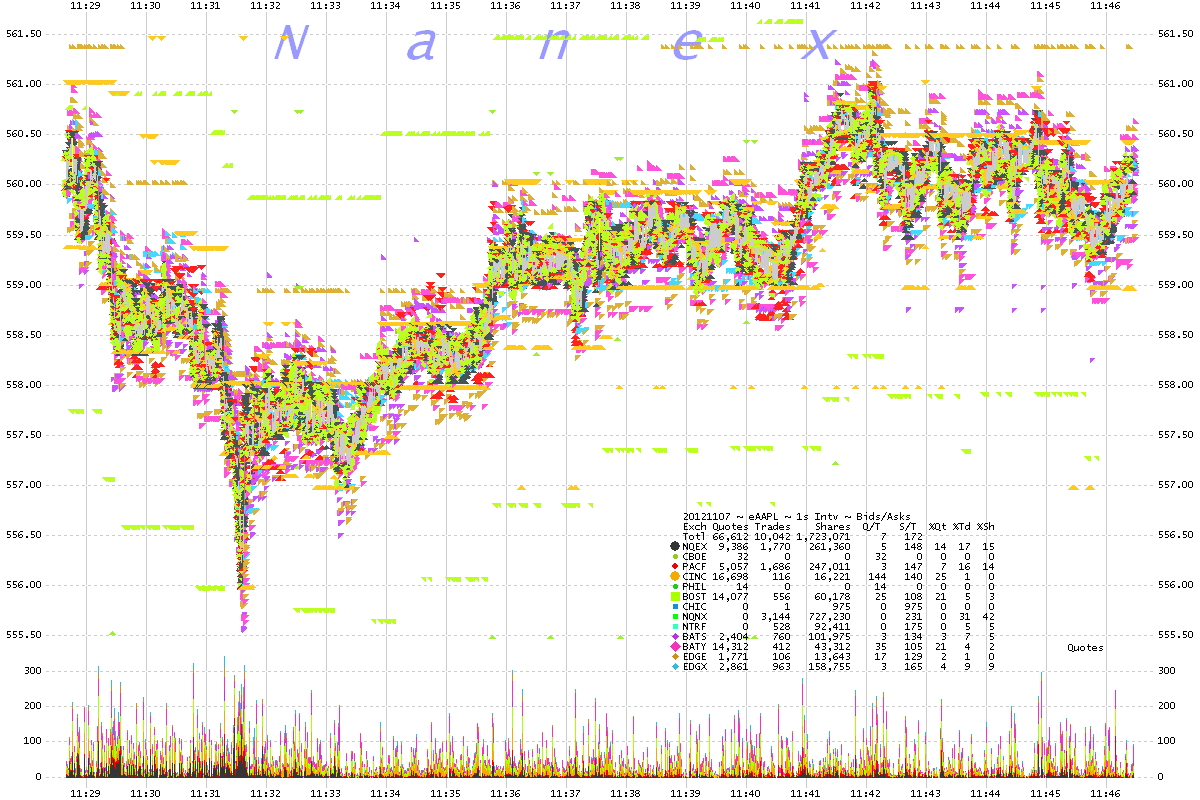
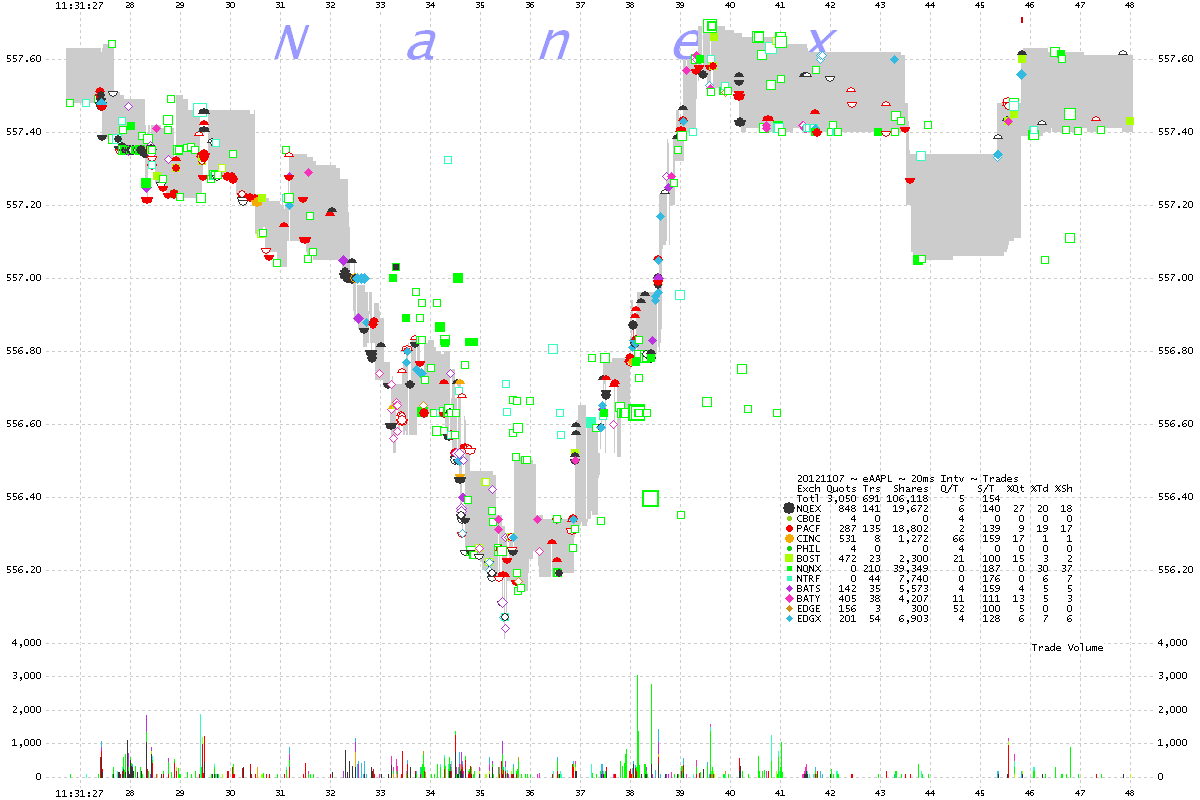
6. AAPL ~ 20 millisecond interval showing trades color coded by exchange.
Trades from Dark Pools are allowed to be reported up to 90 seconds late, which makes
it difficult to analyze prices.
Nanex Research
Inquiries: pr@nanex.net


