Nanex Research

Nanex ~ 12-Nov-2012 ~ Intentional or Stupid?
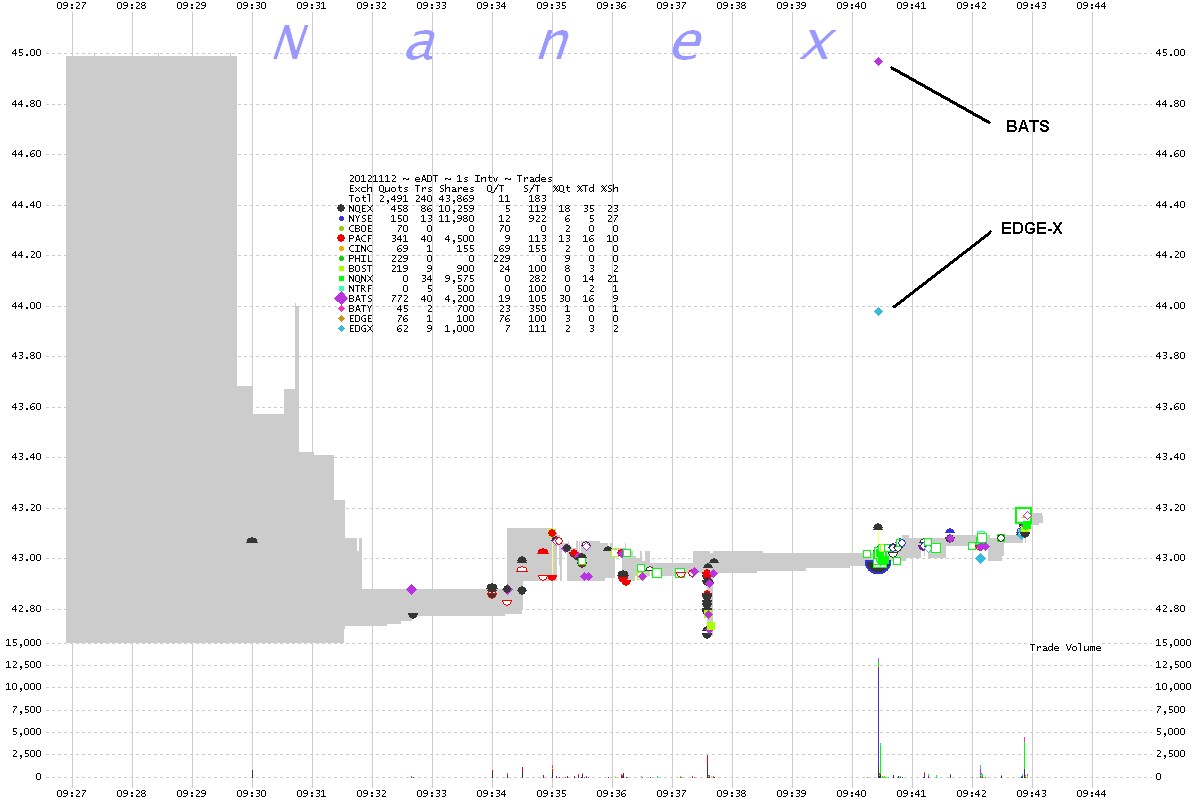
On November 12, 2012 at 09:40:26, the price of the stock of The ADT Corporation (symbol
ADT) jumped 4.3% on a 100 share trade executed at BATS. Milliseconds later, it jumped
2.2% on a 100 share trade executed at Direct Edge-X. Both of these price jumps occurred
on a trade from an ISO order (Intermarket Sweep Order). ISO orders are used by High
Frequency Traders (HFT) to tell the exchange to execute it without checking for better
prices at other exchanges. The intent of an ISO order is to tell the exchange that the
user of this order is taking on the responsibility of ensuring trade through price protection.
Basically, the order says to the exchange "we understand the rules, are following them,
and know what we are doing". The last part, we aren't so sure.
Table of trades executed at 9:40:26.
| Exg | Price | Shares | Seq# | Condition | Notes |
| NYSE | 42.99 | 10580 | 38005 | Open Report | |
| NQEX | 43.01 | 100 | 38006 | ISO | |
| NQEX | 43.02 | 100 | 38007 | ISO | |
| NQEX | 43.03 | 100 | 38008 | ISO | |
| BATS | 43.02 | 100 | 38009 | ISO | |
| NQEX | 43.11 | 100 | 38010 | ISO | |
| NQEX | 43.12 | 100 | 38011 | ISO | |
| BATS | 44.97 | 100 | 38012 | ISO | Price Jumps $1.85 |
| NY-ARCA | 43.02 | 100 | 38013 | Regular | |
| EDGX | 43.98 | 100 | 38014 | ISO | Price Jumps $0.96 |
| NQEX | 43.02 | 100 | 38015 | ISO | |
| NQ-TRF | 43.01 | 100 | 38016 | Regular | |
1. ADT ~ 1 second interval chart showing trades color coded by exchange.
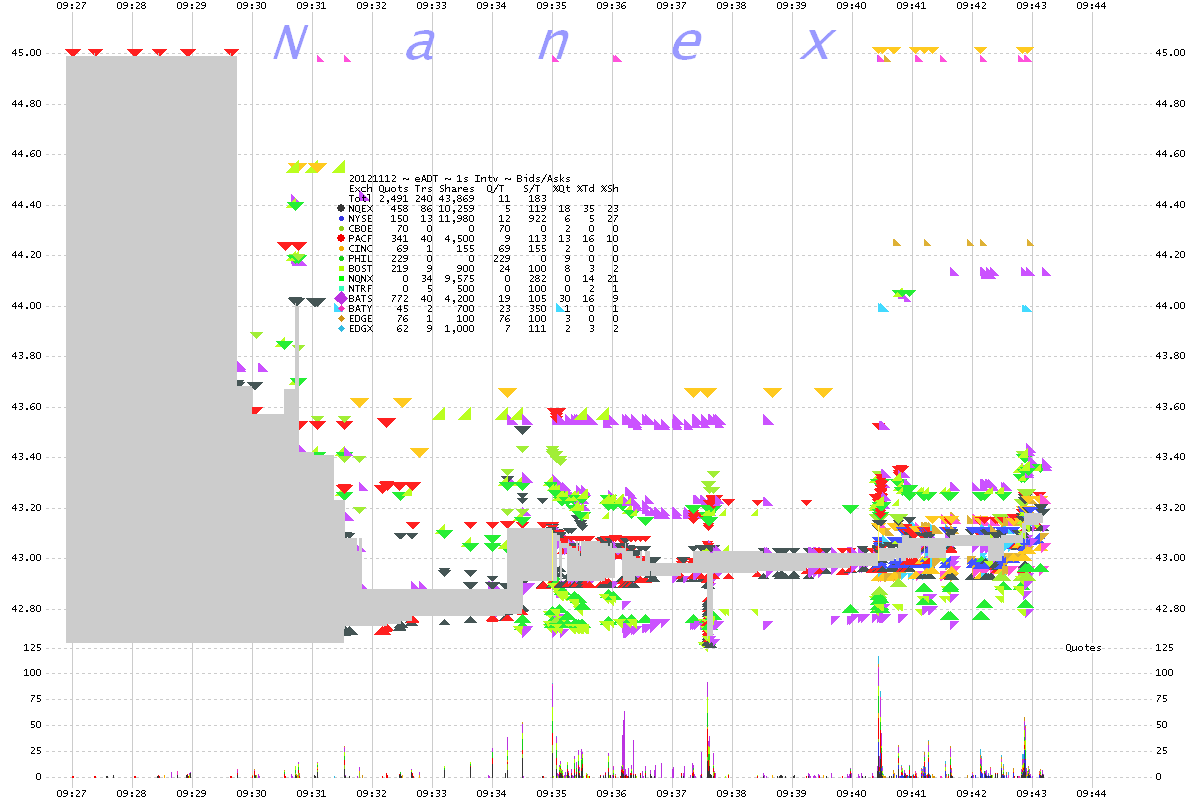
2. ADT ~ 1 second interval chart showing bids and asks color coded by exchange.
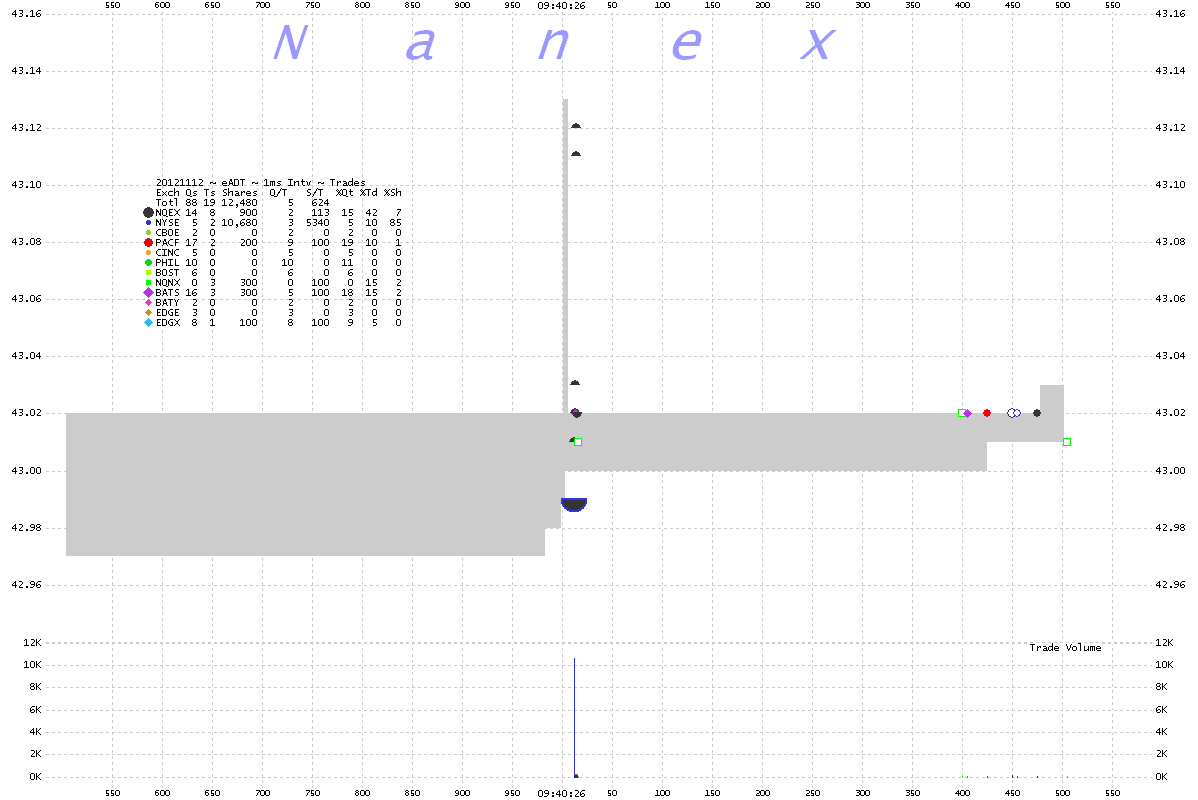
The gray shading is the NBBO (National Best Bid and Offer).
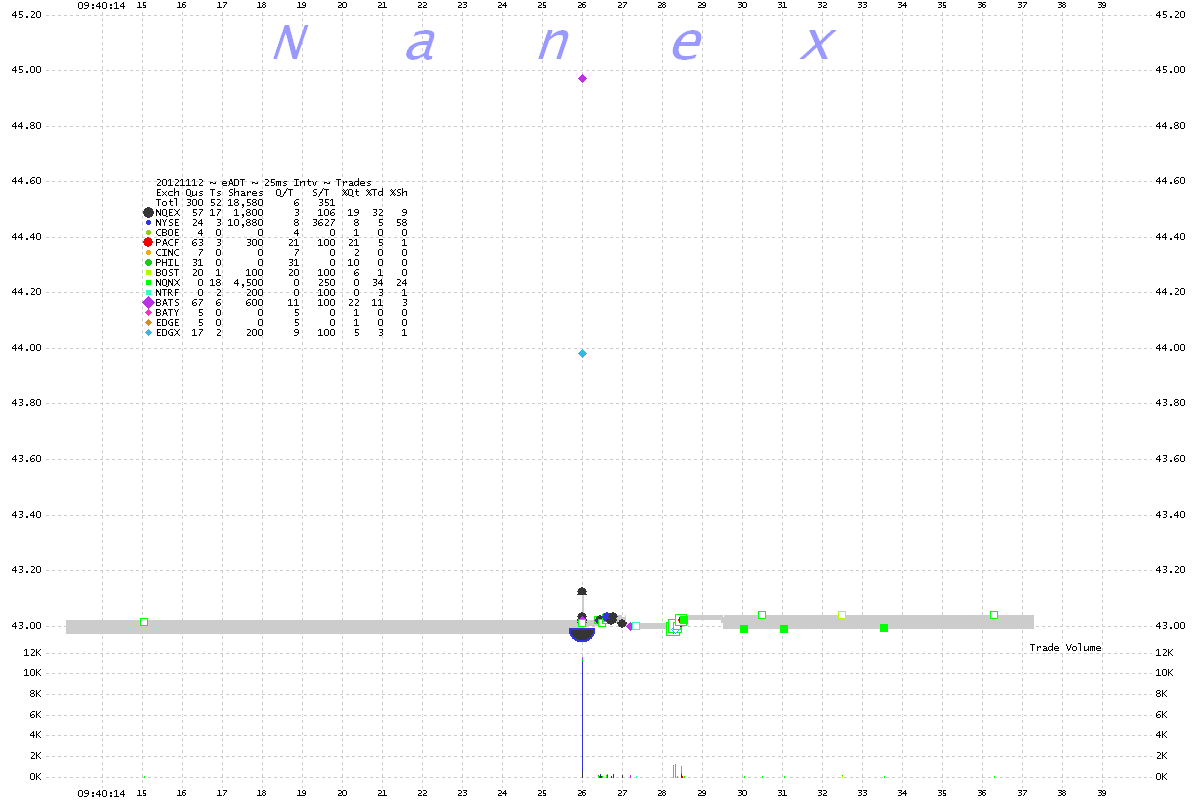
3. ADT ~ 25 millisecond interval chart showing trades color coded by exchange.
4. ADT ~ 1 millisecond interval chart showing trades, bids, and asks color coded by exchange.
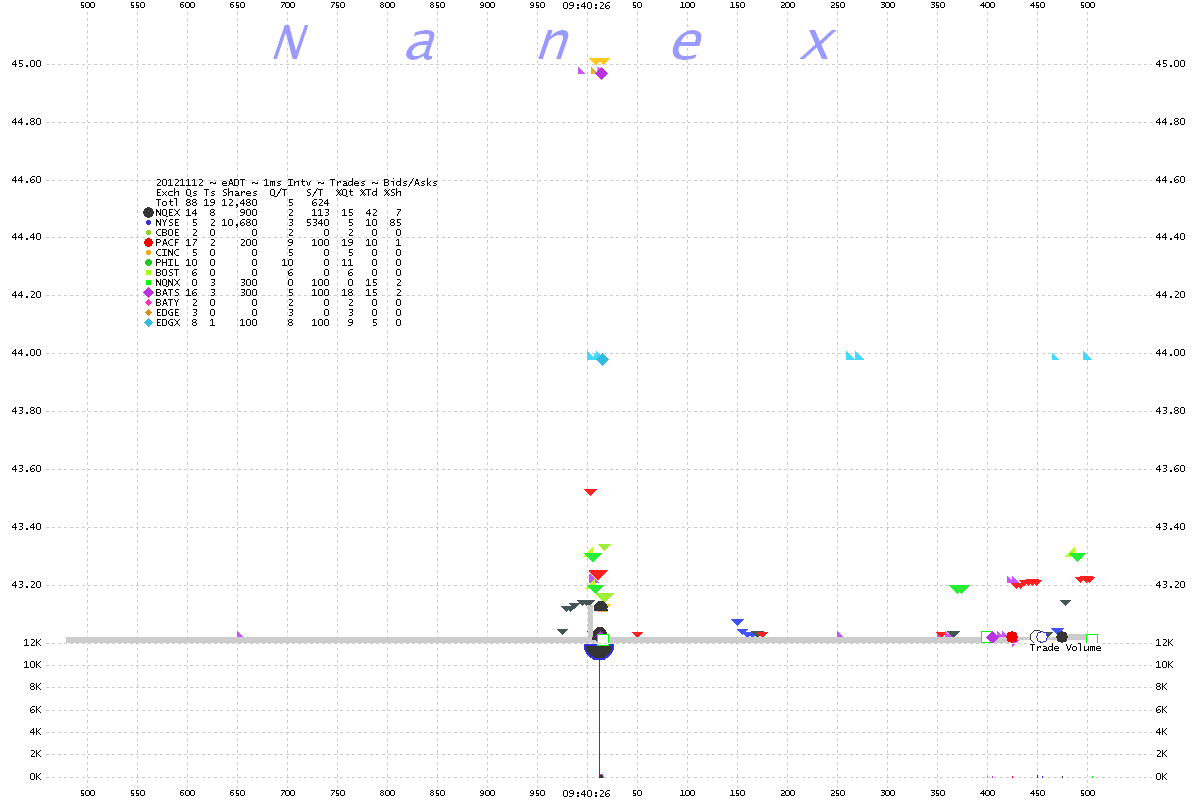
5. ADT ~ 1 millisecond interval chart showing trades color coded by exchange.
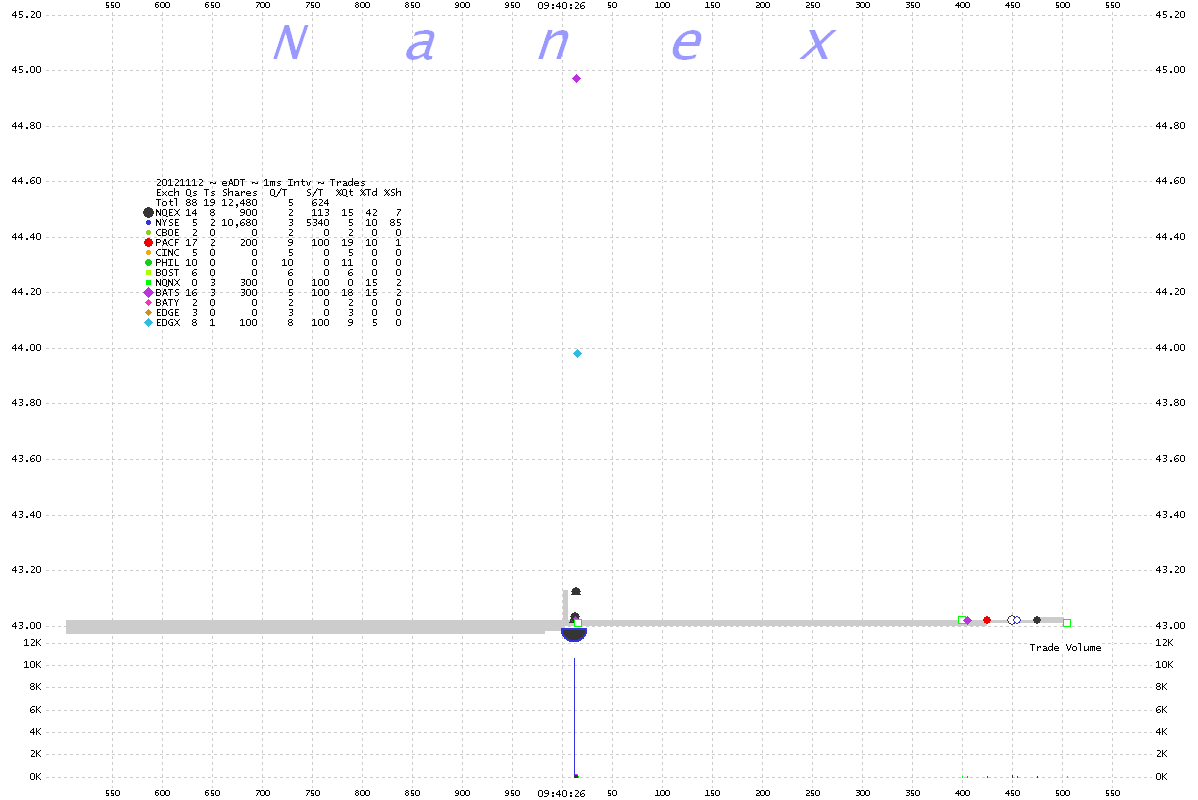
6. ADT ~ 1 millisecond interval chart showing trades, bids and asks color coded by exchange.
Zooming in on price.
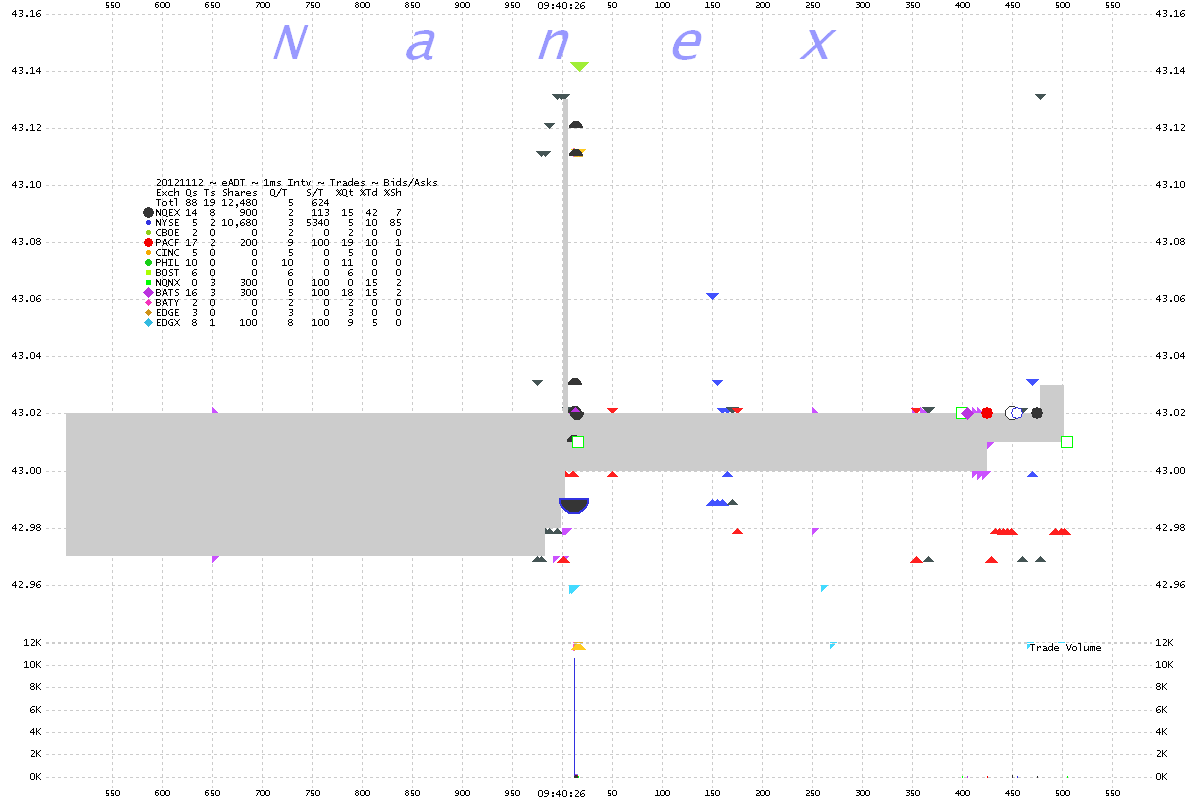
7. ADT ~ 1 millsecond interval chart showing trades color coded by exchange.
Nanex Research
Inquiries: pr@nanex.net


