Nanex Research

Nanex ~ 14-Nov-2012 ~ Muni-Bond ETFs
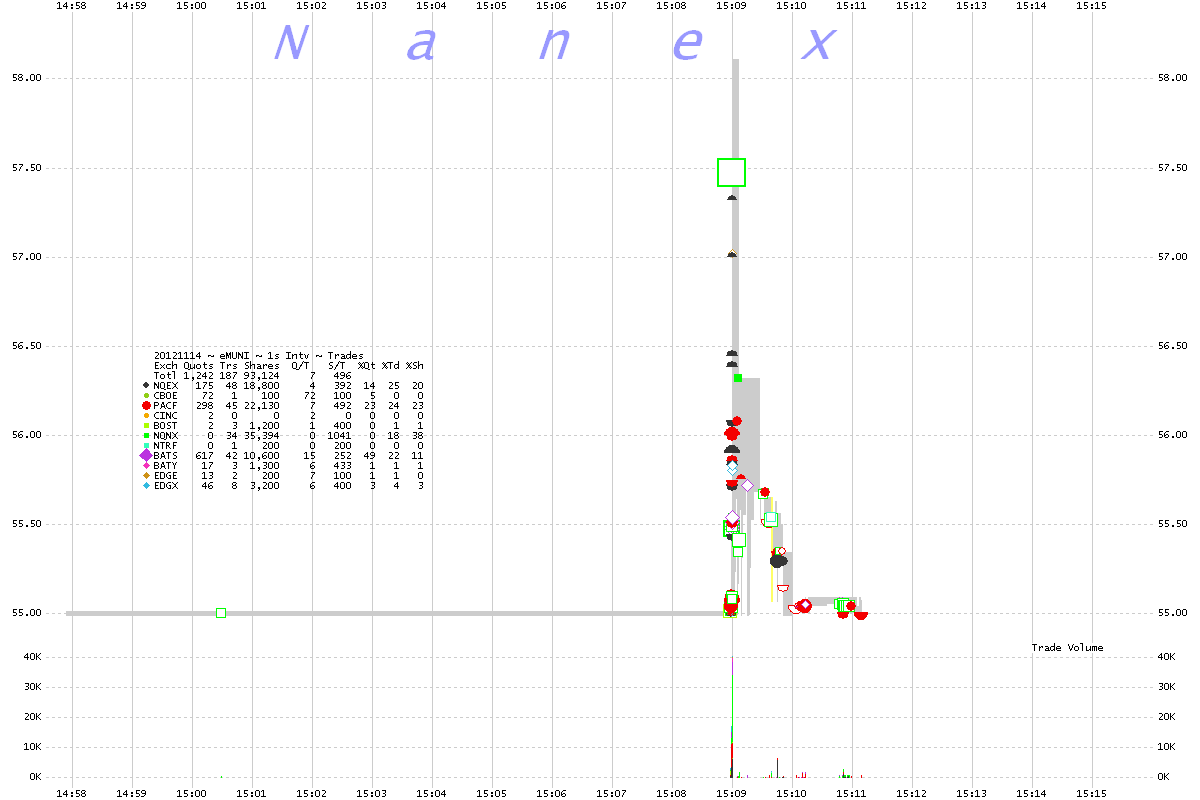
1. MUNI ~ 1 second interval chart showing trades color coded by exchange.
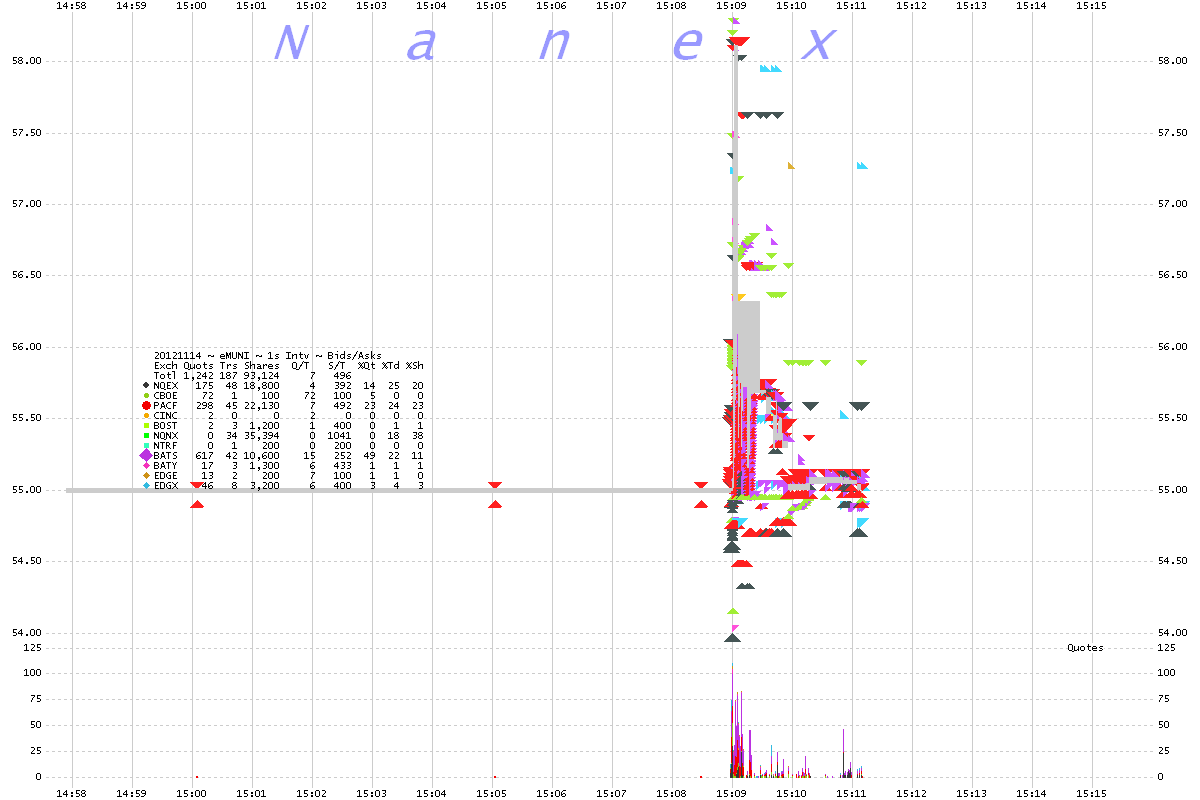
2. MUNI ~ 1 second interval chart showing bids and asks color coded by exchange.
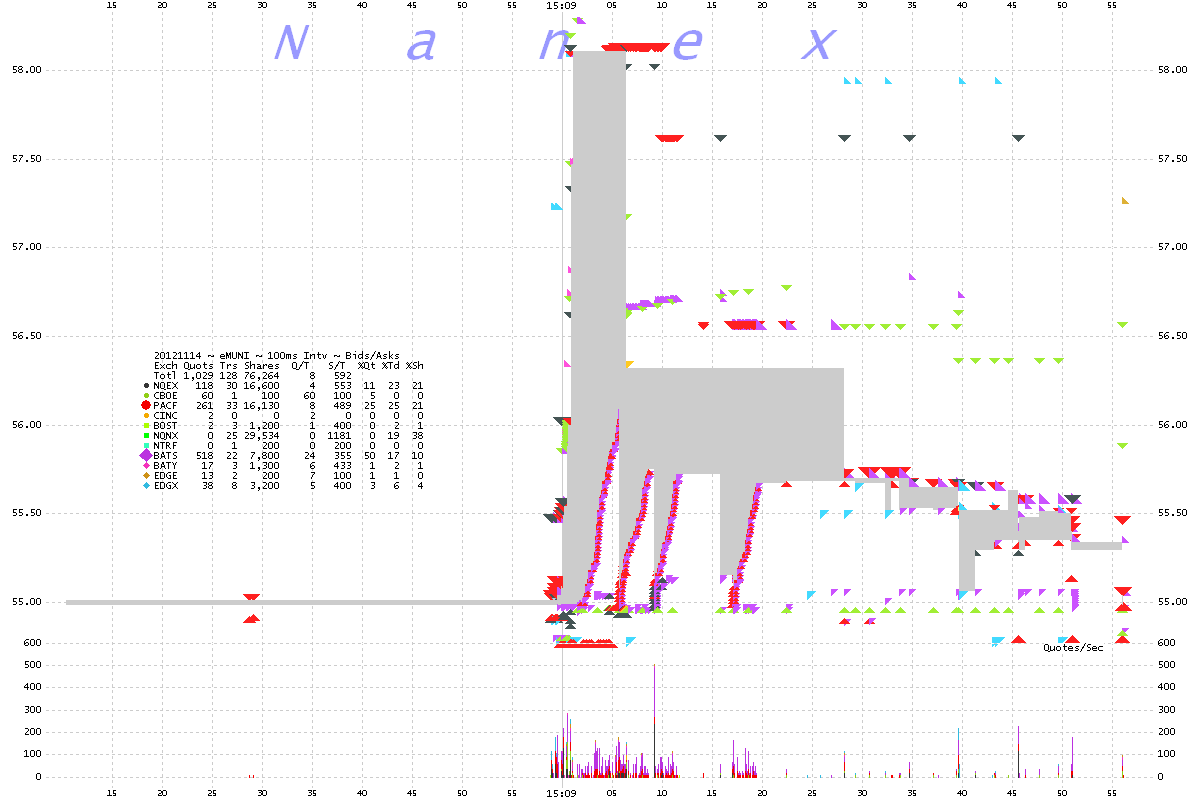
3. MUNI ~ 100 millisecond interval chart showing bids and asks color coded by exchange.
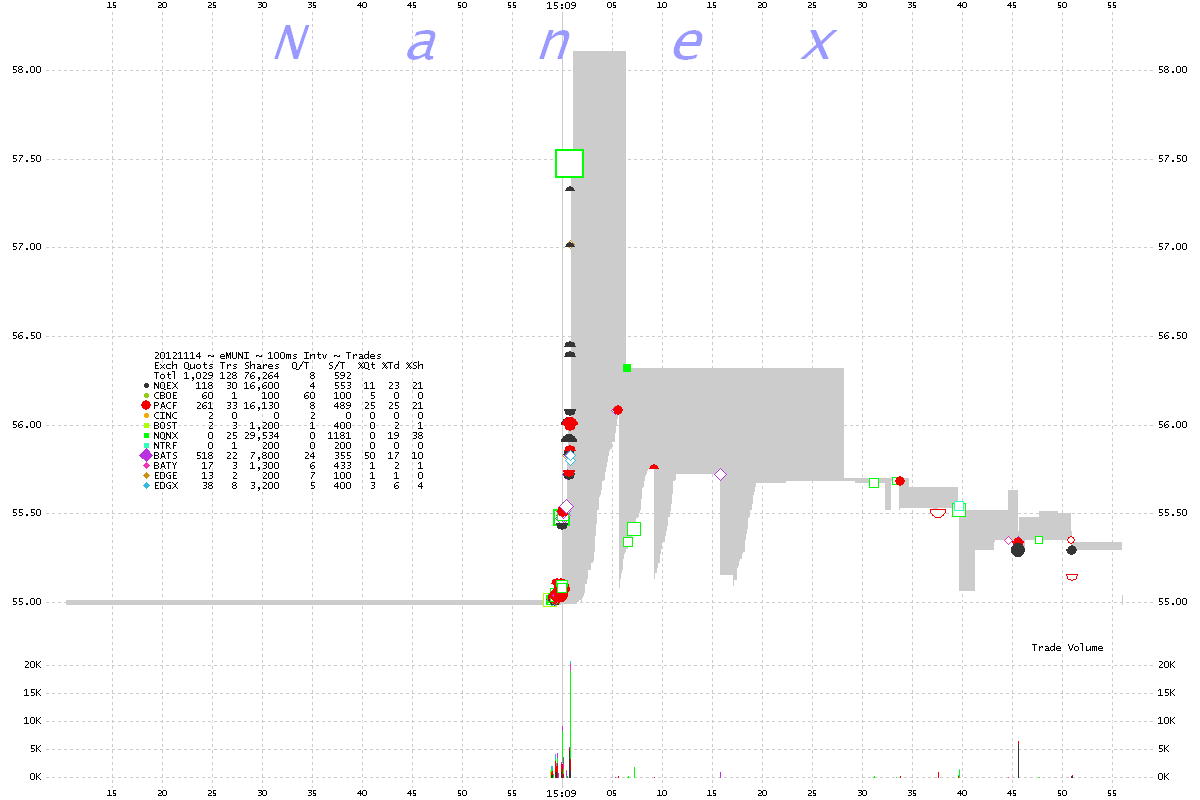
4. MUNI ~ 100 millisecond interval chart showing trades color coded by exchange.
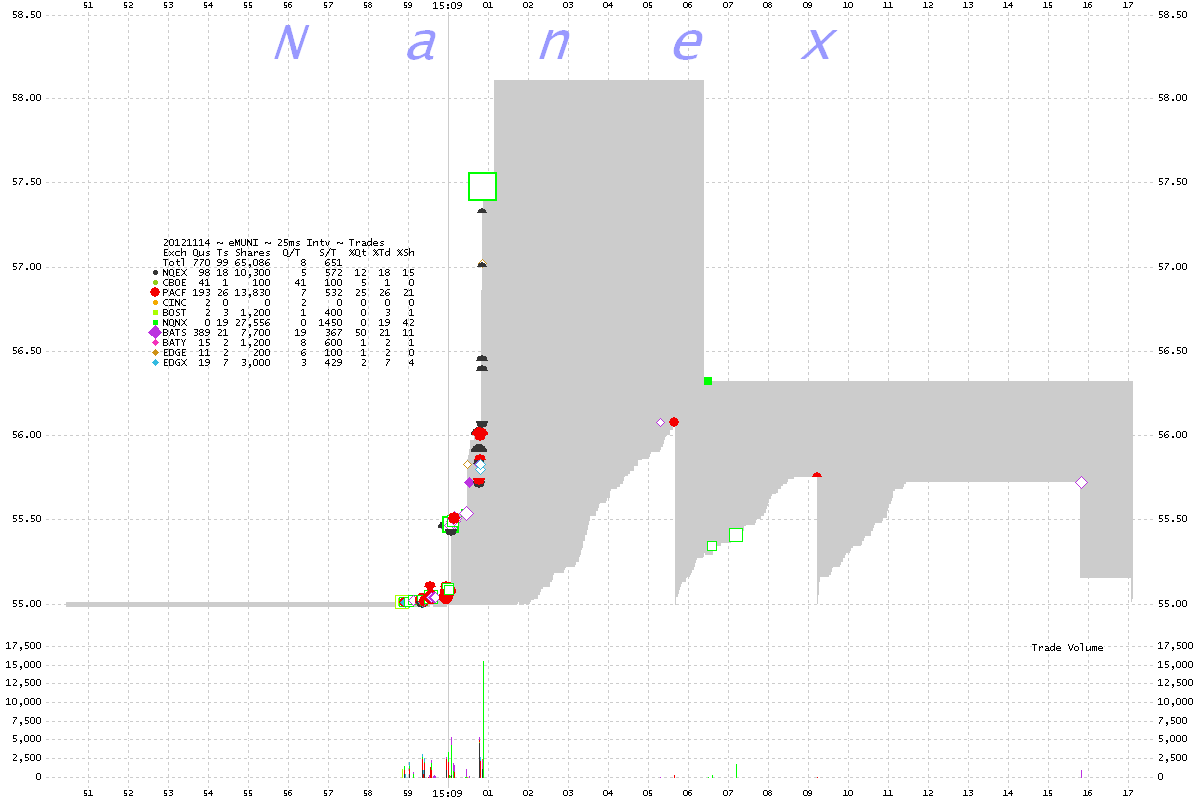
5. MUNI ~ 25 millisecond interval chart showing trades color coded by exchange.
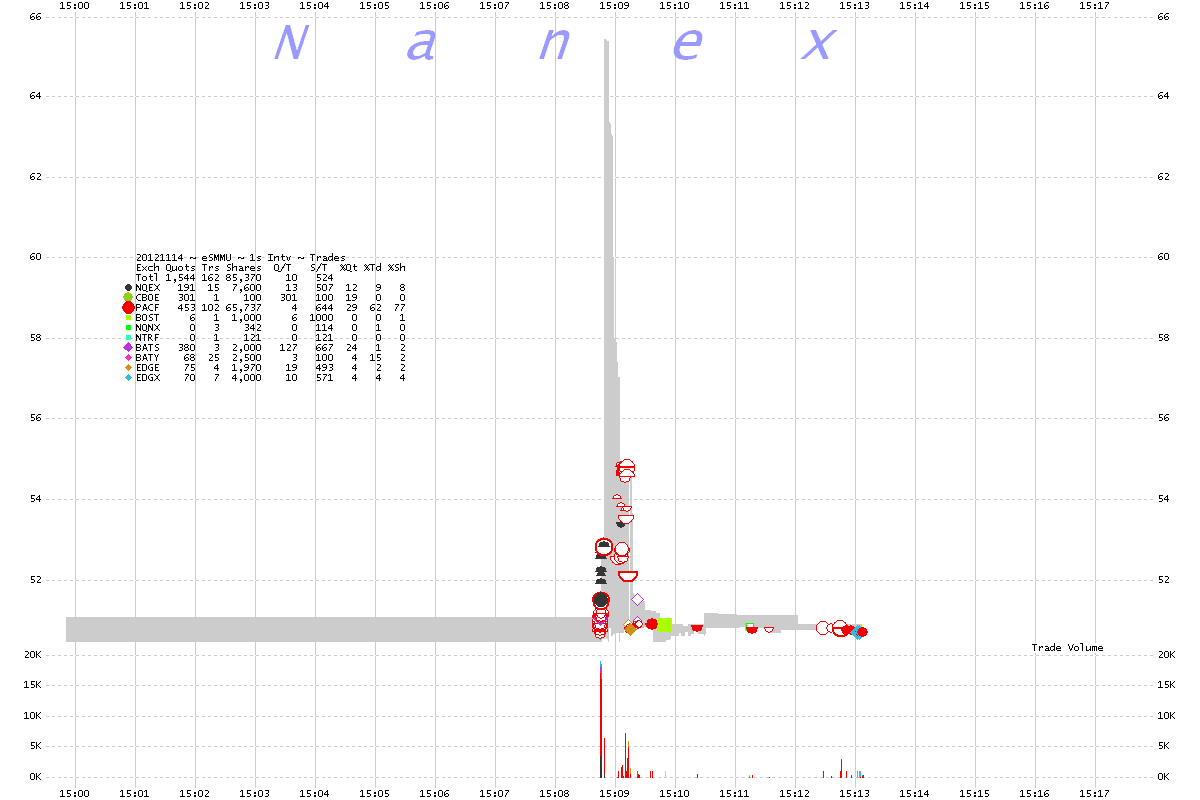
6. SMMU ~ 1 second interval chart showing trades color coded by exchange.
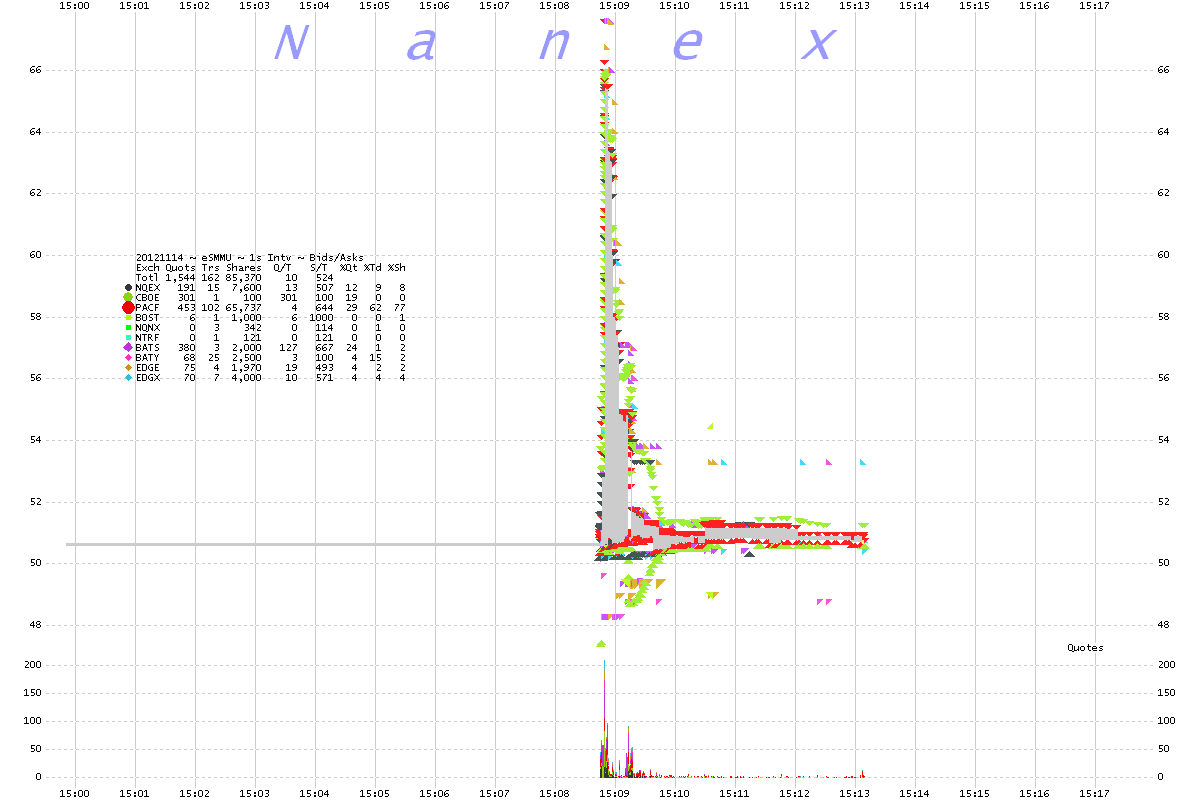
7. SMMU ~ 1 second interval chart showing bids and asks color coded by exchange.
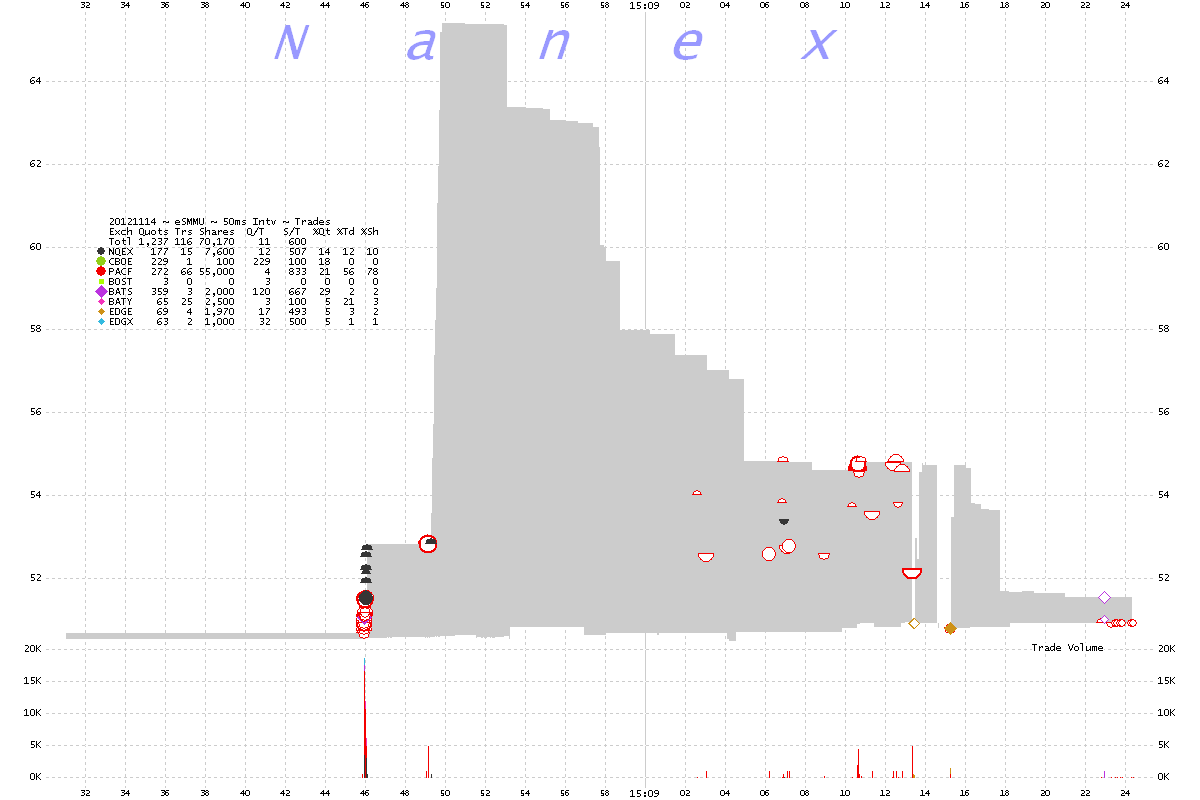
8. SMMU ~ 50 millisecond interval chart showing trades color coded by exchange.
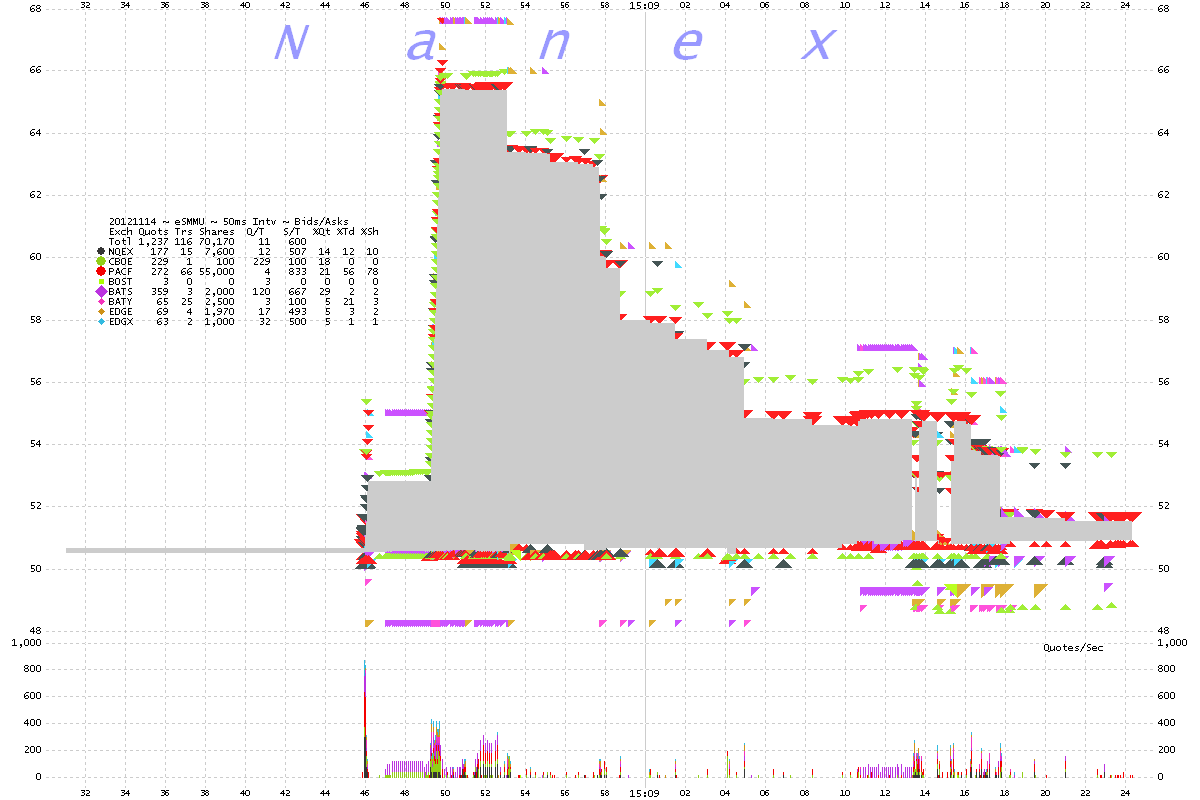
9. SMMU ~ 50 millisecond interval chart showing bids and asks color coded by exchange.
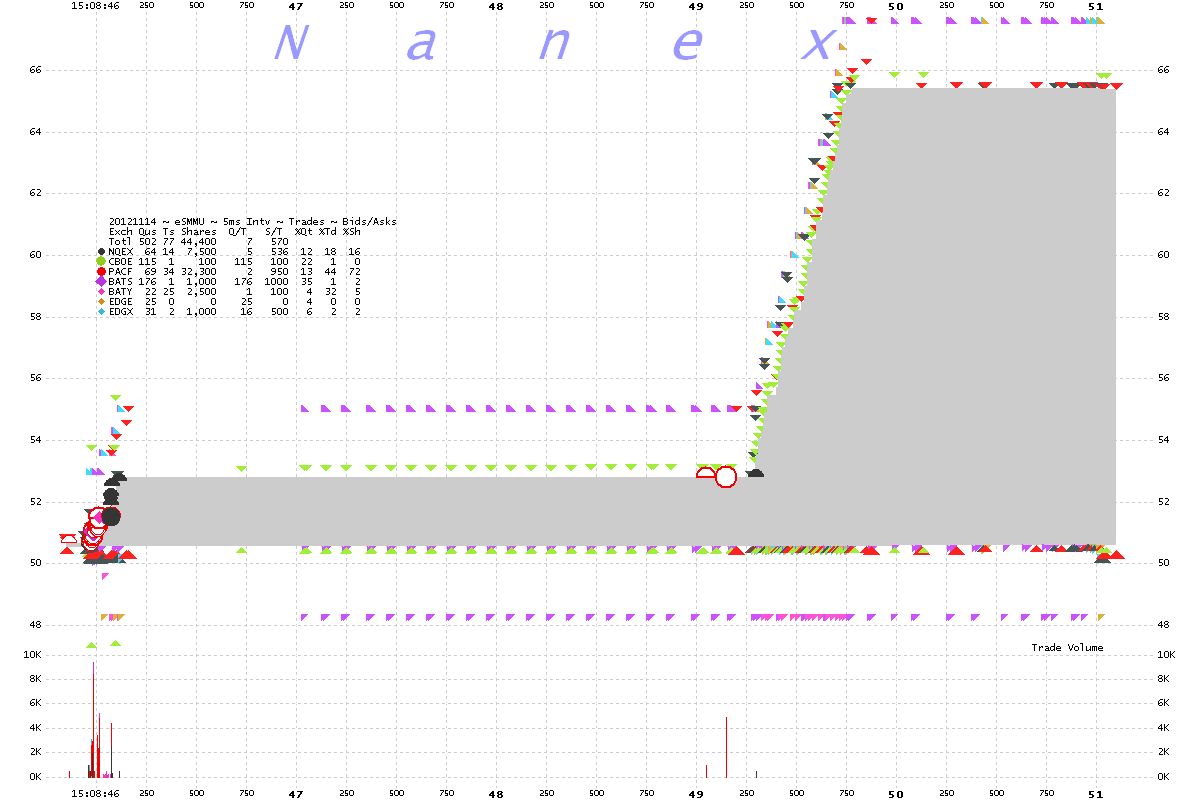
10. SMMU ~ 5 millisecond interval chart showing bids, asks and trades color coded by exchange.
Nanex Research
Inquiries: pr@nanex.net


