Nanex Research

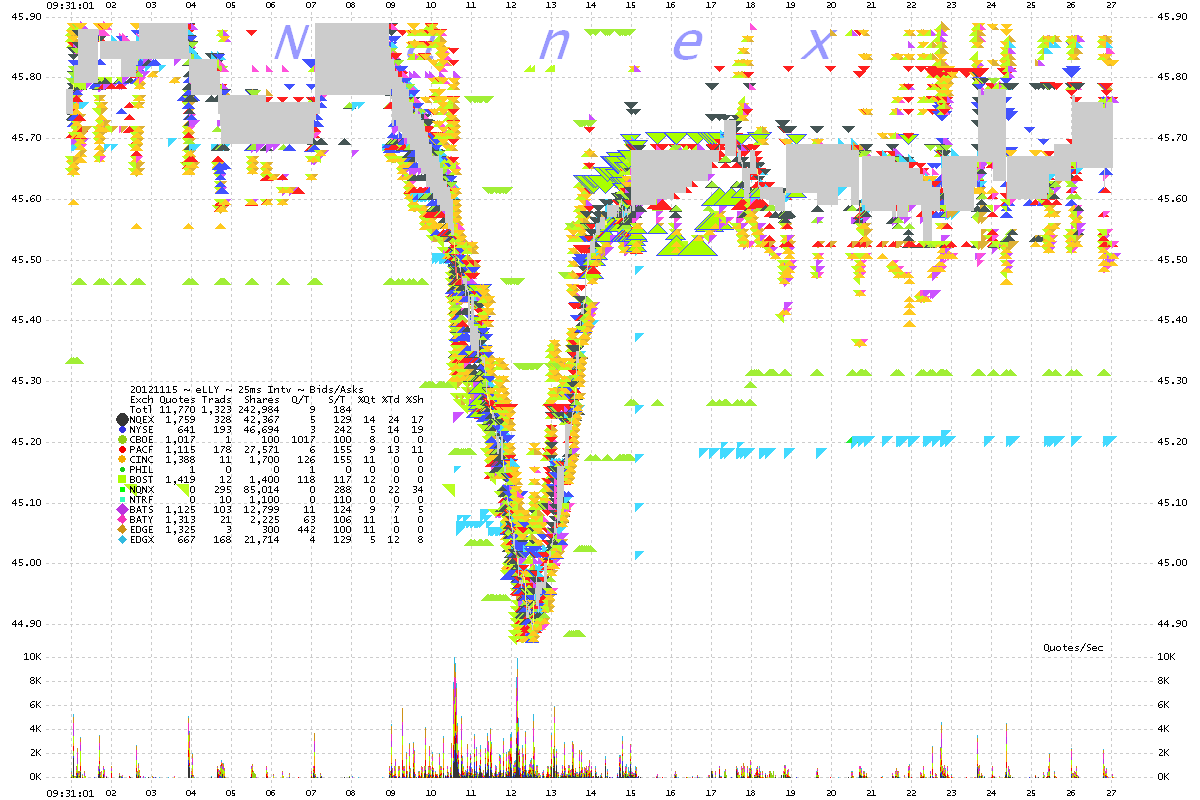
Nanex ~ 15-Nov-2012 ~ Lilly's 2% Moment
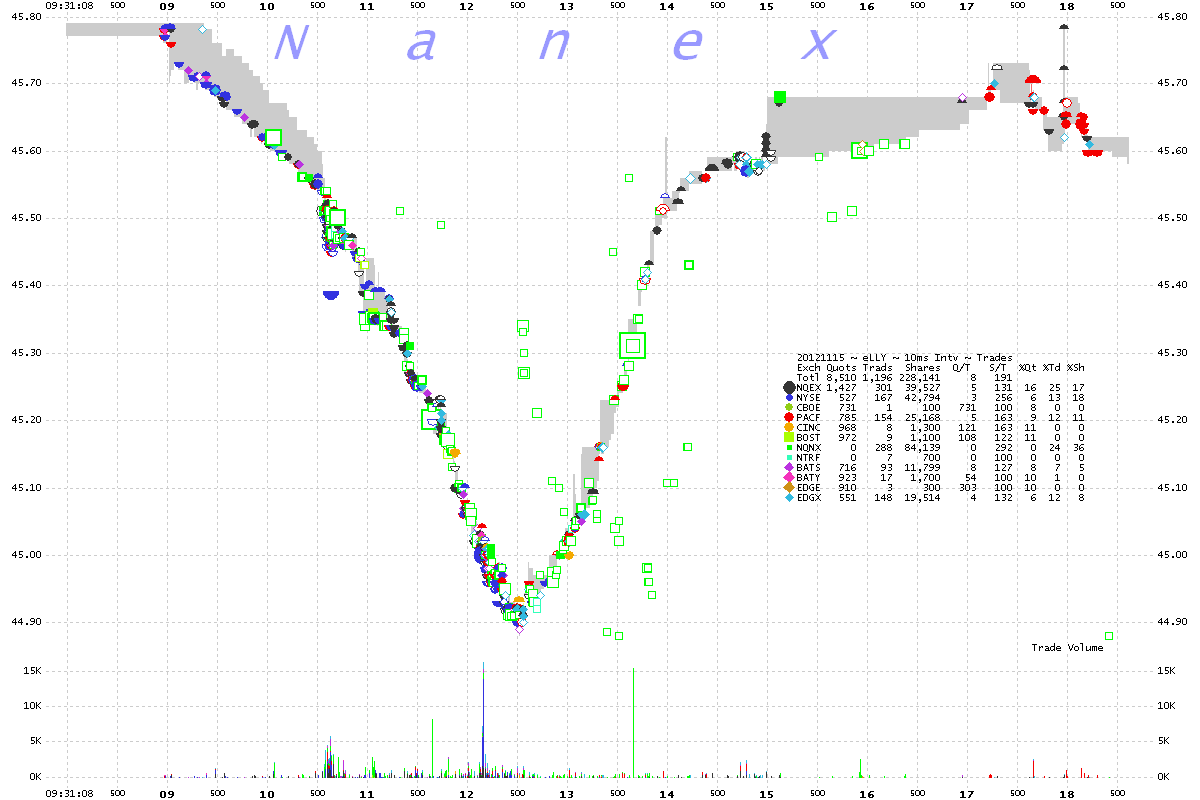
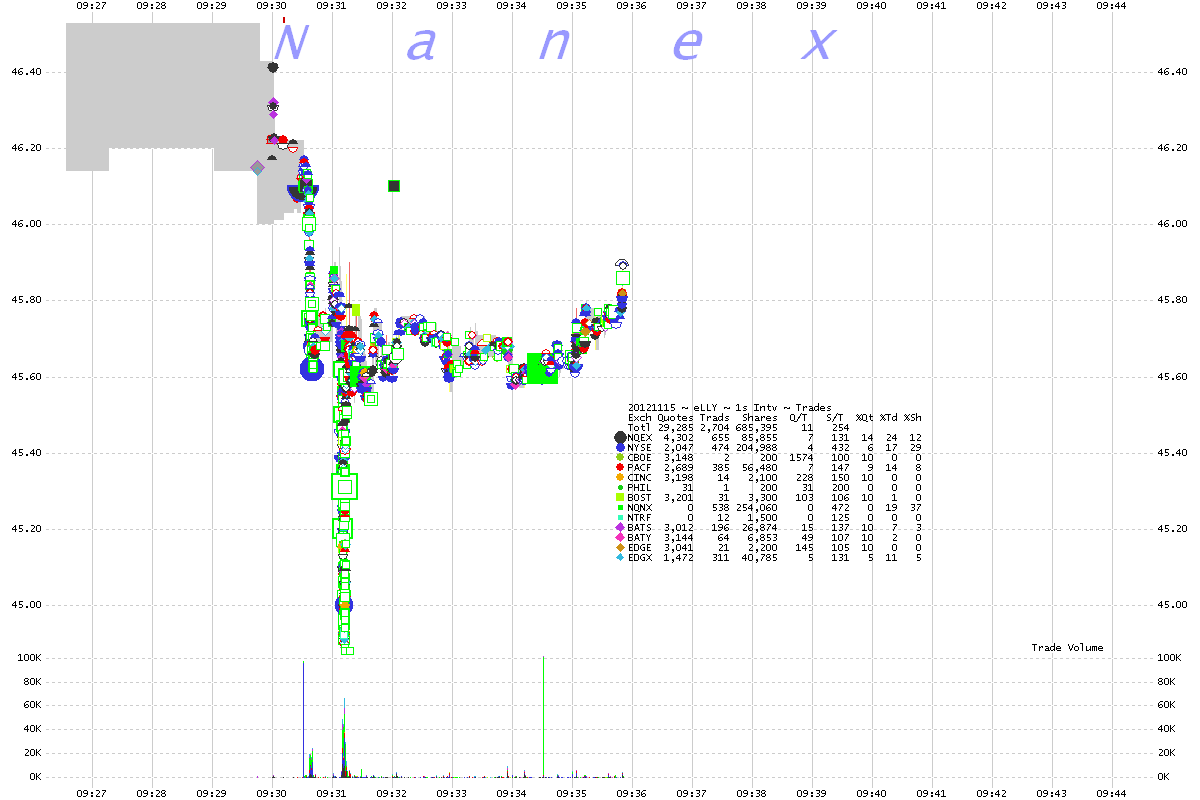
On November 15, 2012 at 9:31:09 the stock of Eli Lilly & Co (symbol LLY) dropped
almost 2% in 3.5 seconds of High Frequency Trading. The price recovered over the next
5 seconds.
1. LLY ~ 10 millisecond interval chart showing trades color coded by exchange.
2. LLY ~ 1 second interval chart showing trades color coded by exchange.
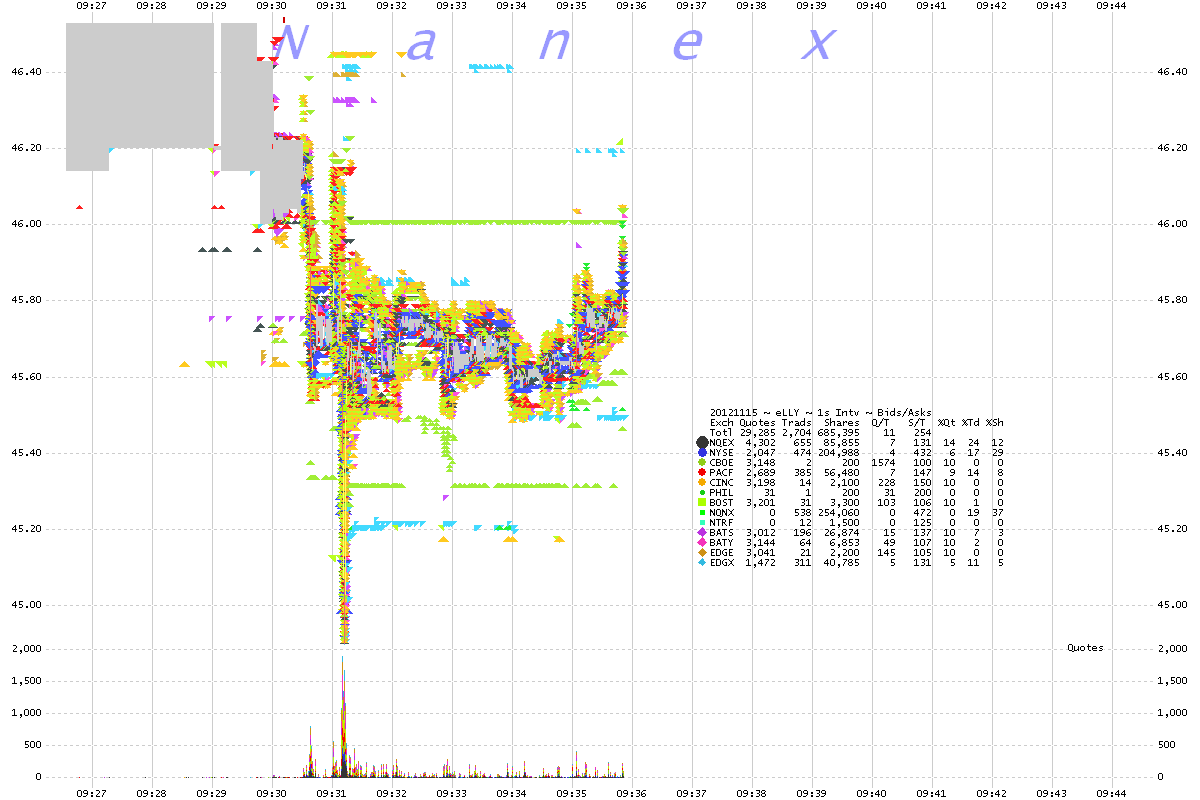
3. LLY ~ 1 second interval chart showing bids and asks color coded by exchange.
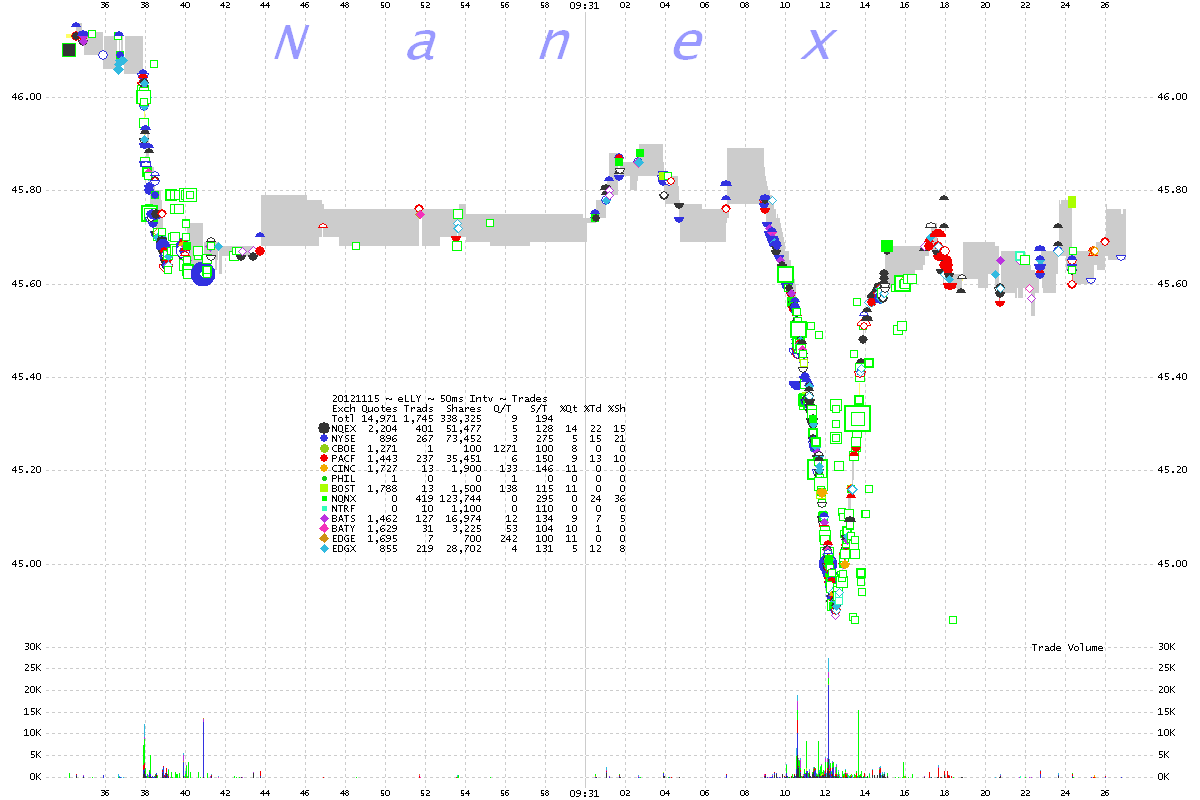
4. LLY ~ 50 millisecond interval chart showing trades color coded by exchange.
5. LLY ~ 50 millisecond interval chart showing bids and asks color coded by exchange.
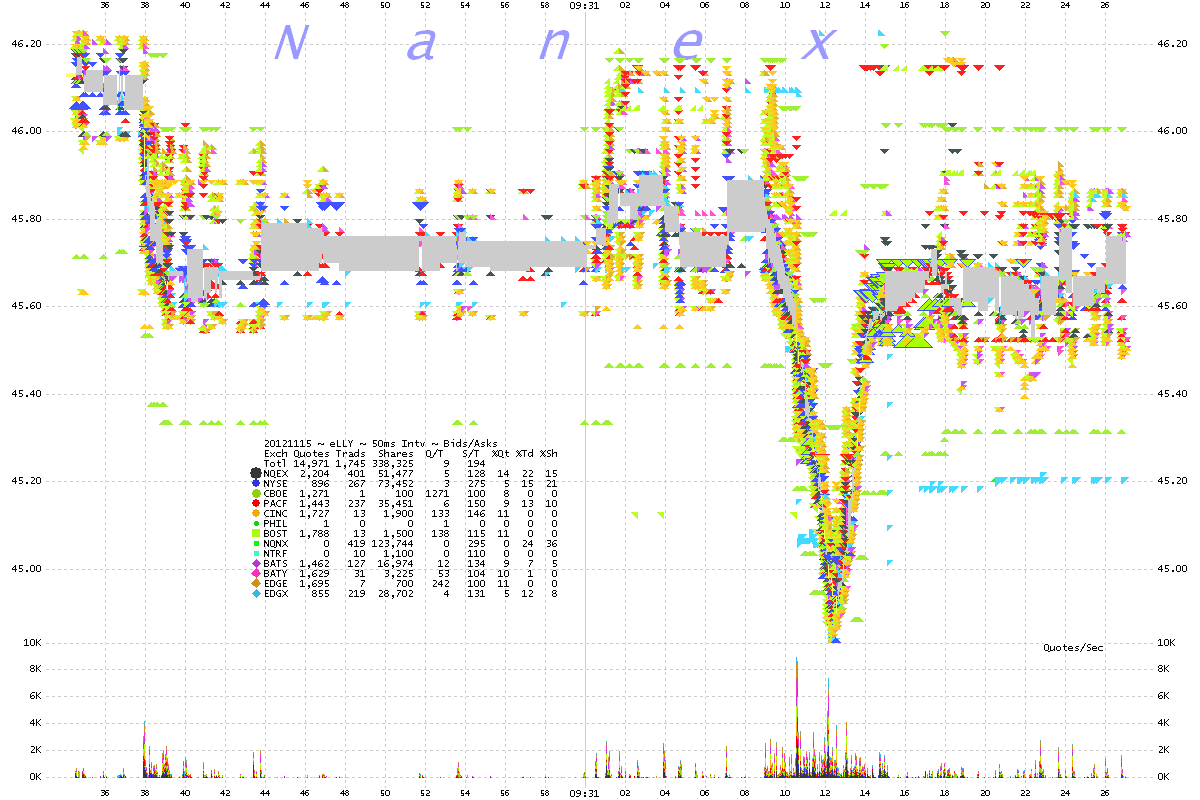
6. LLY ~ 50 millisecond interval chart showing ISO trades color coded by exchange.
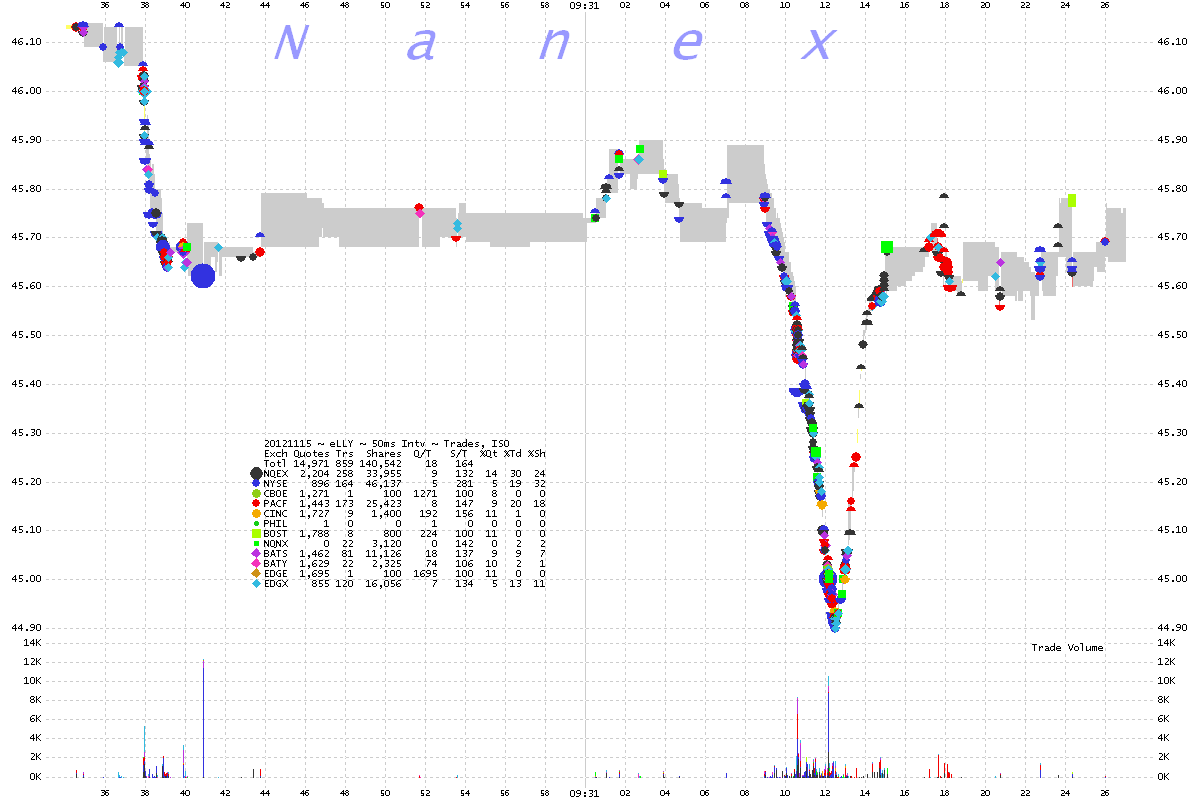
7. LLY ~ 50 millisecond interval chart showing non-ISO trades color coded by exchange.
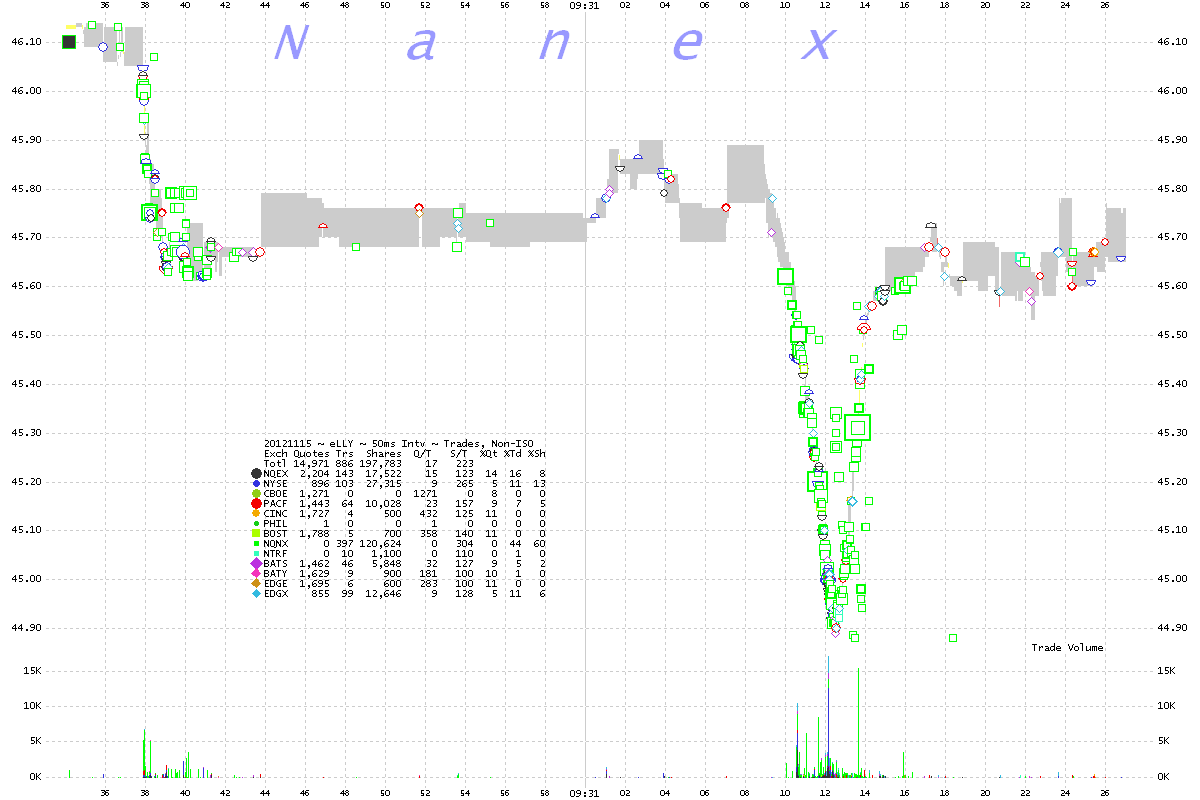
8. LLY ~ 25 millisecond interval chart showing trades color coded by exchange.
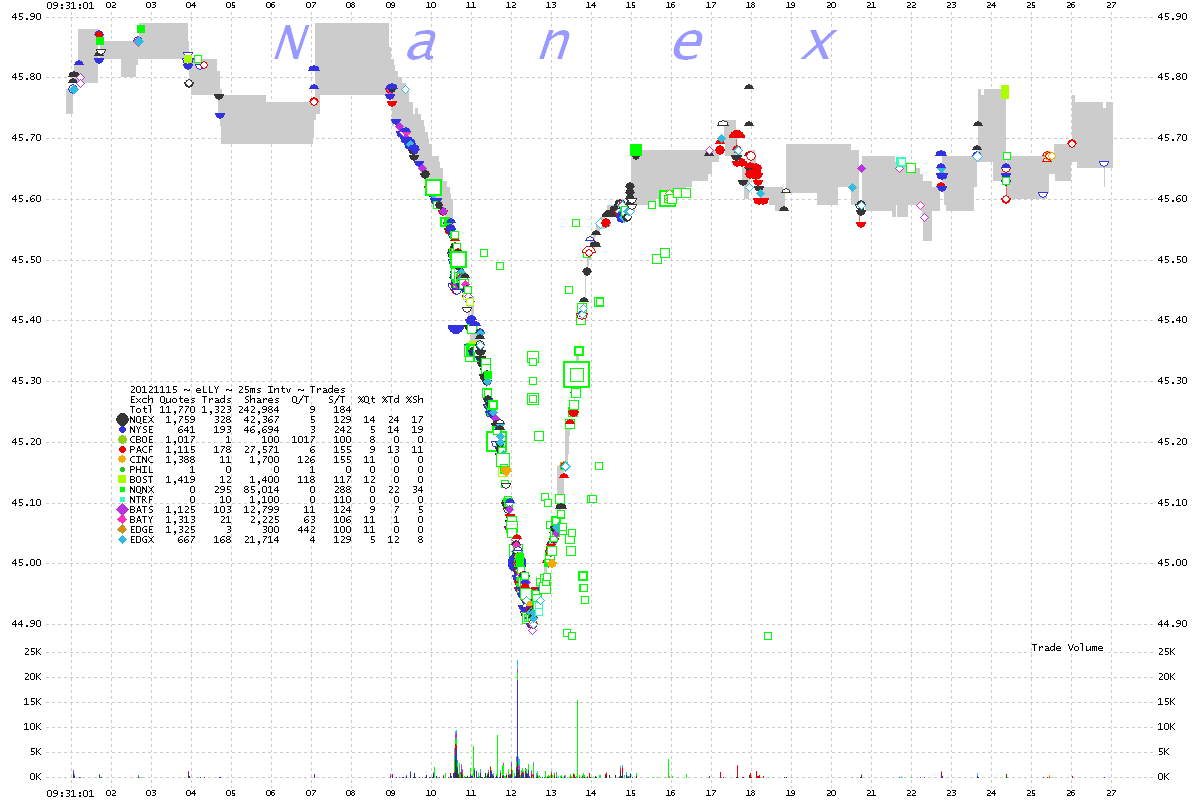
9. LLY ~ 25 millisecond interval chart showing bids and asks color coded by exchange.
Nanex Research
Inquiries: pr@nanex.net


