Nanex Research

Nanex ~ 16-Nov-2012 ~ The Russell ETFs
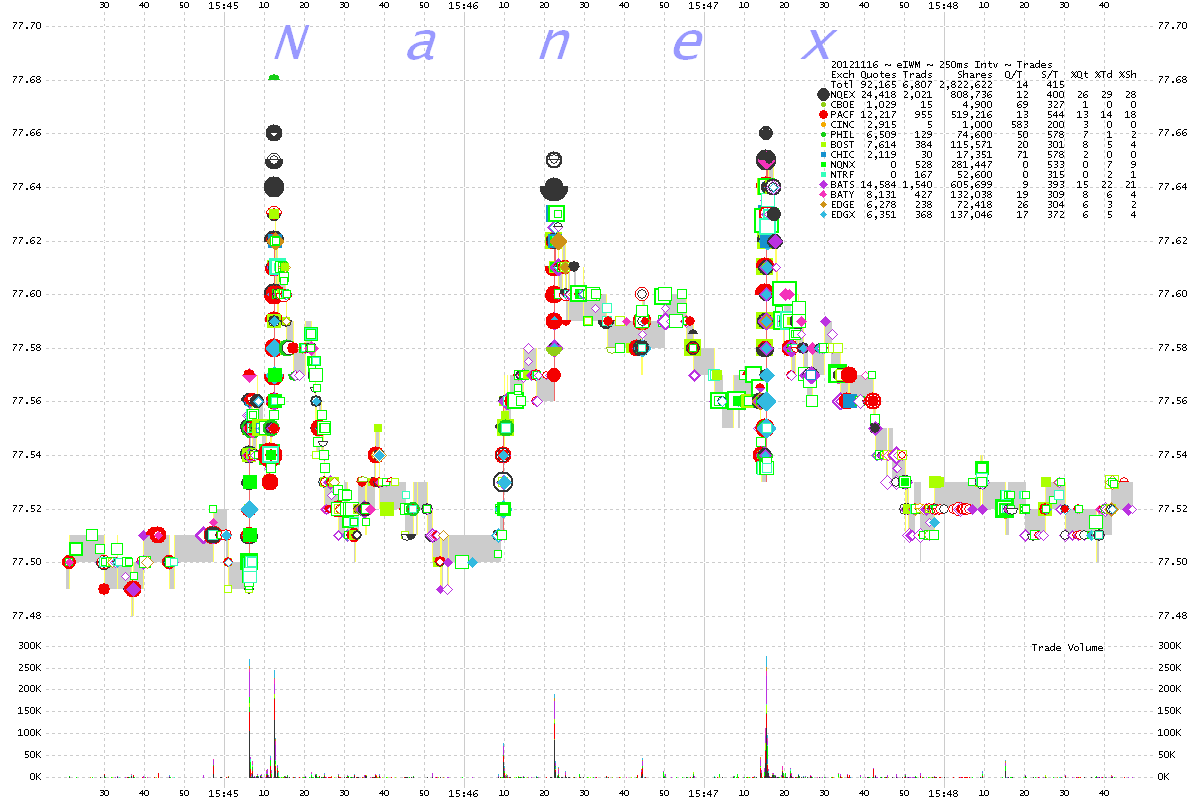
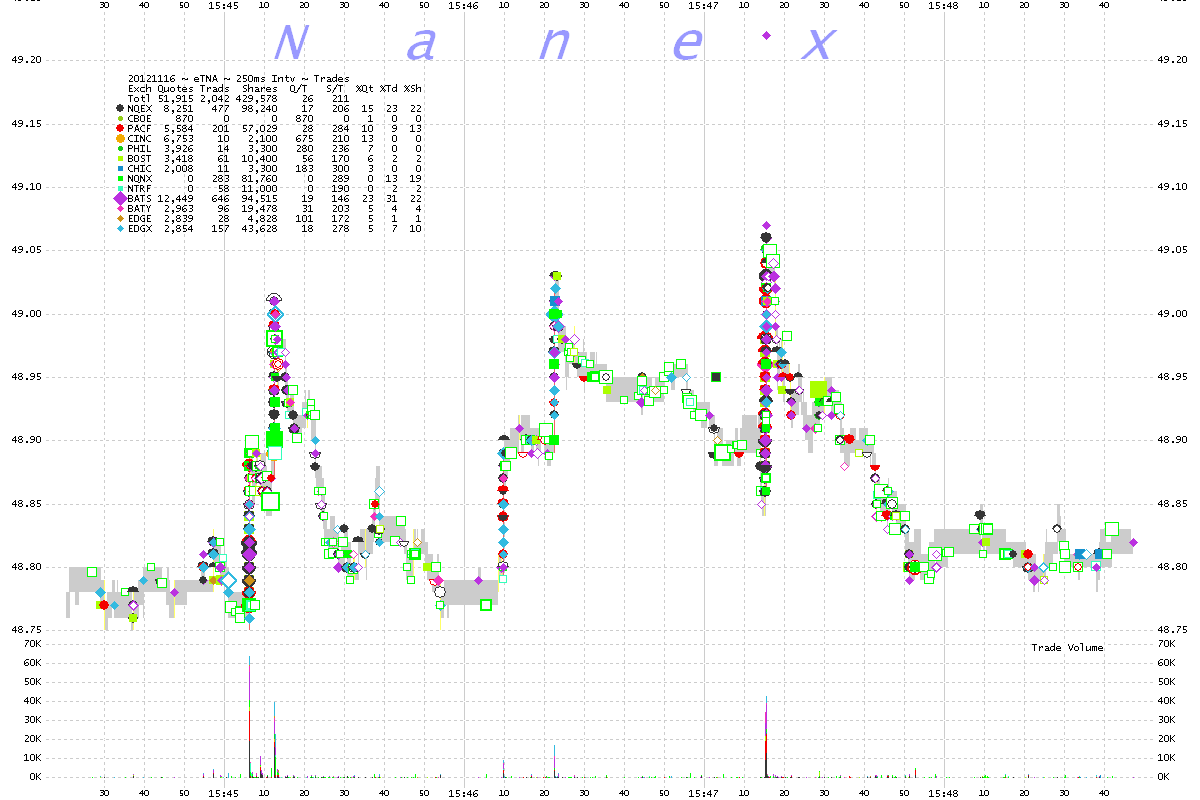
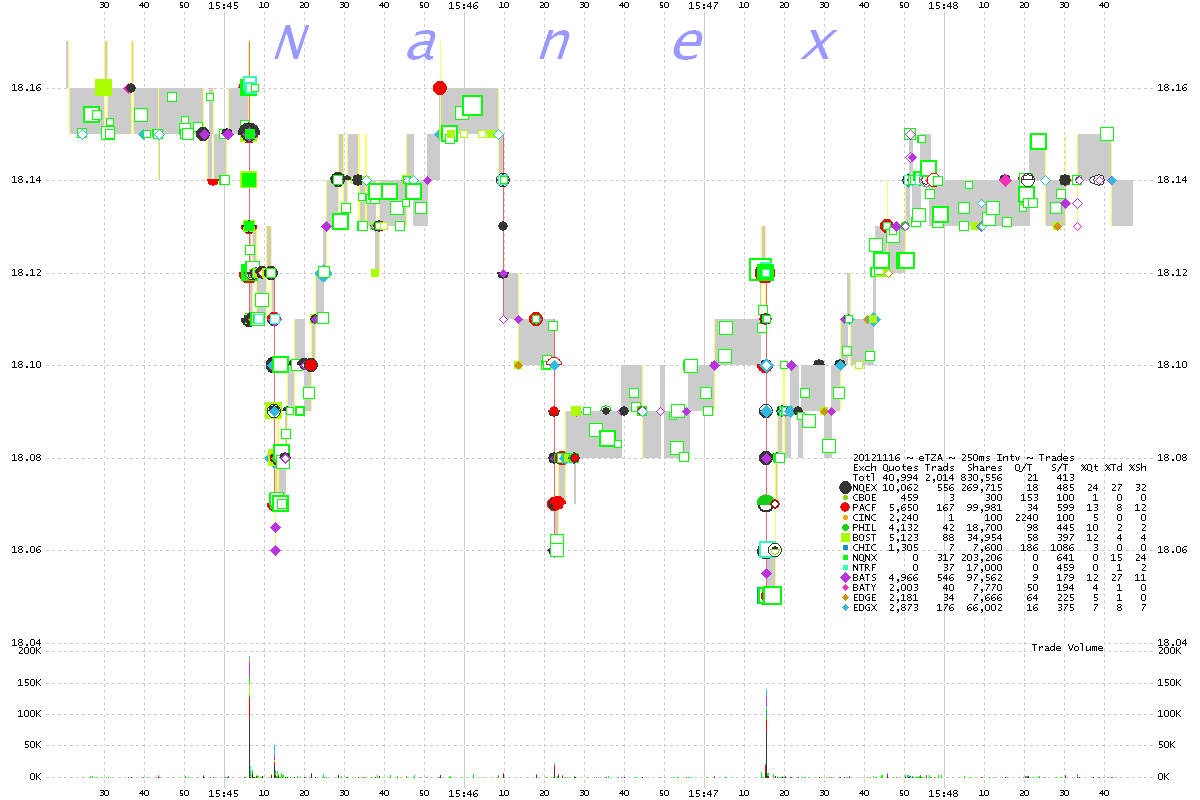
On November 16, 2012, starting at 14:45:06, there were 3 significant trading activity
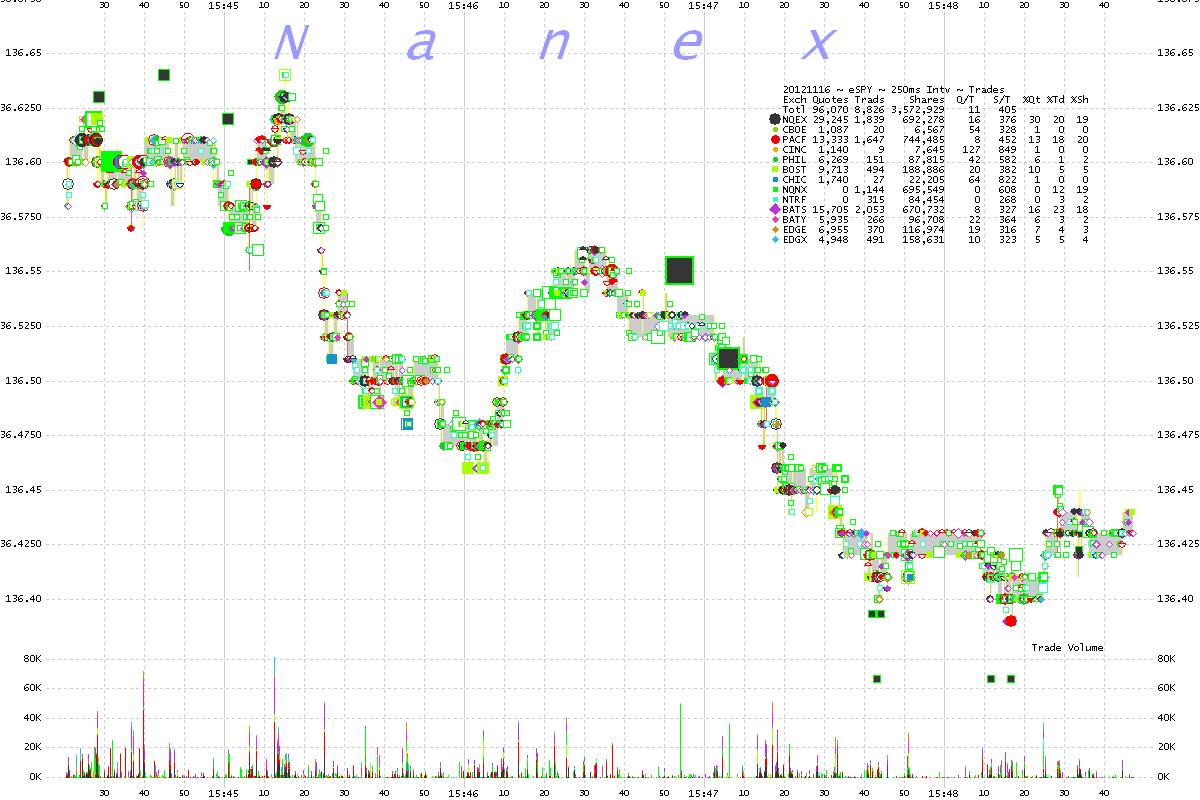
periods in Russell ETFs and Russell Futures. It is odd that the SPY ETF did not participate.
1. iShares Russell 2000 Index (IWM) ~ 250 millisecond interval chart showing trades color coded by exchange.

2. SPDR S&P 500 (SPY) ~ 250 millisecond interval chart showing trades color coded by exchange.
SPY didn't participate.

3. Direxion Daily Small Cap Bull 3X Shares (TNA) ~ 250 millisecond interval chart showing trades color coded by exchange.

4. Direxion Daily Small Cap Bear 3X Shares (TZA) ~ 250 millisecond interval chart showing trades color coded by exchange.
This symbol moves in the opposite direction

Nanex Research
Inquiries: pr@nanex.net


