Nanex Research

Nanex ~ 30-Nov-2012 ~ The 2012 November Close
November trading went out with a bang,
similar to trading action in the three previous years. One
difference however, was the price action seemed much more contained. There were few
examples of prices spiraling out of control in one direction or another, but there was
something new. Wild trading oscillations and fast shifting bid/ask spreads: see
charts below.
See also: Gaming the Last Millisecond
of the Day, SPY
Close Anomaly, EMini
Wipe Out, and Market
Close of 21-Sep-2012.
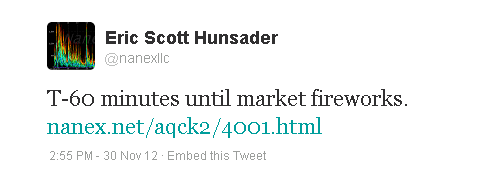
This event was predicted before
market open, and several times during the day:

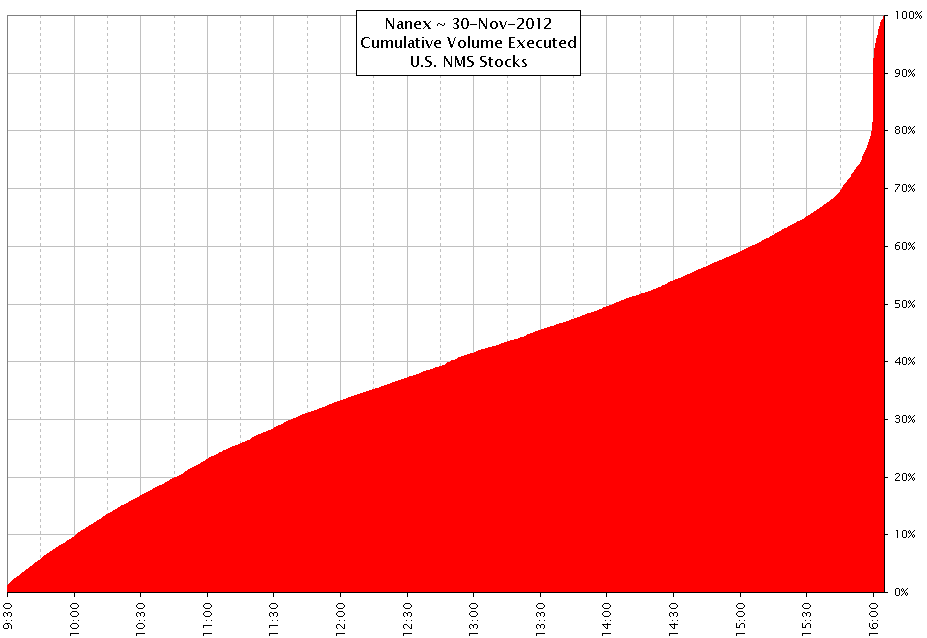
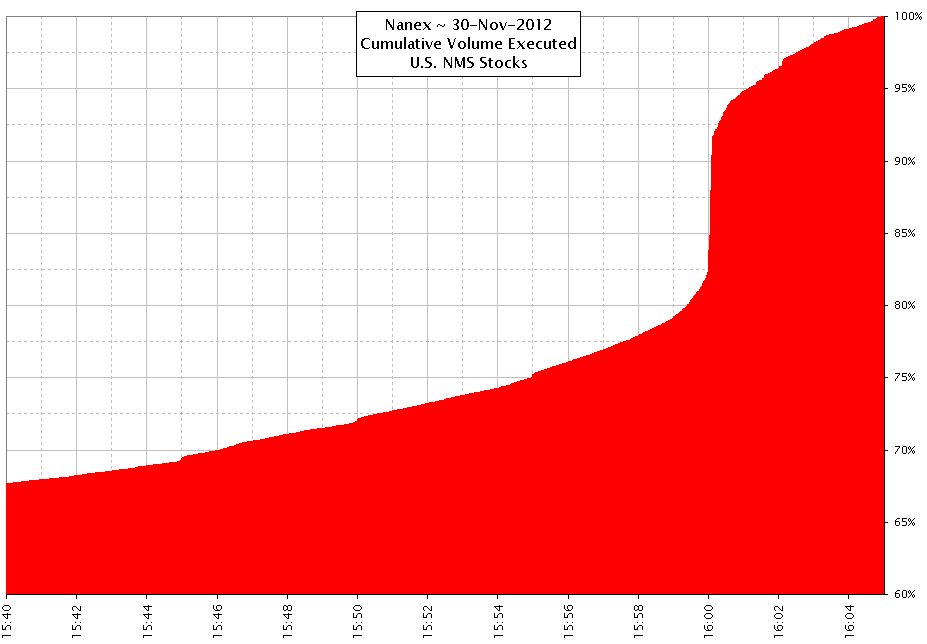
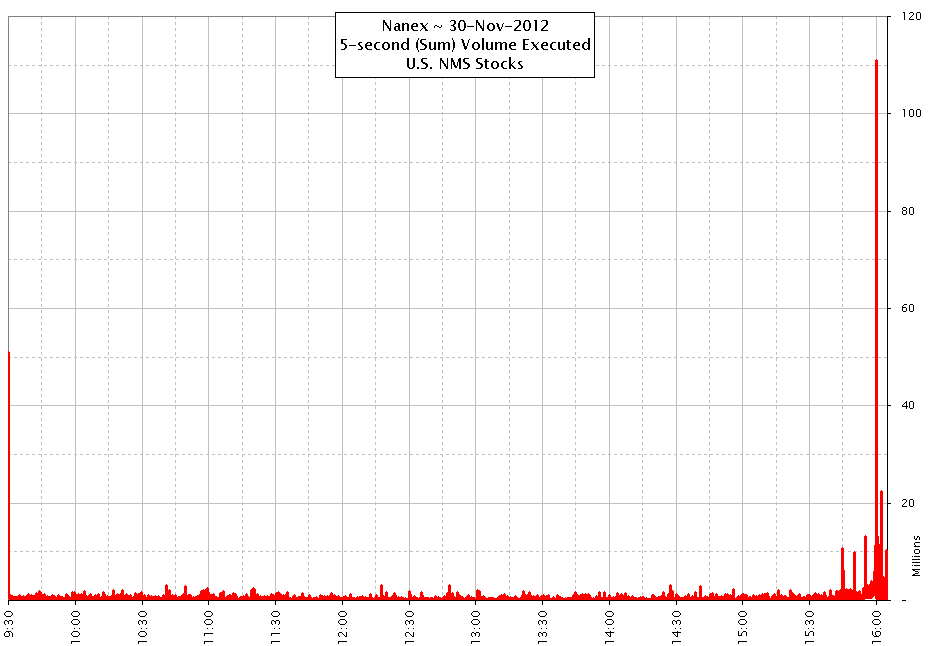
The first 3 charts illustrate how much trading volume (about 10% of the entire trading
day) occurred in the last few
seconds.
1. Cumulative volume executed in NMS Stocks for each second of the trading day.
2. Zoom of chart above.
3. Rolling 5 second volume traded in NMS Stocks for each second of the trading
day.
Click Start/Stop to run a slide show of all 34 images. Or click Prev/Next to step through them one
at a time.
Nanex Research
Inquiries: pr@nanex.net


