Nanex Research

Nanex ~ 04-Dec-2012 ~ Midnight Gold Crush
On December 4, 2012, at 47 minutes and 13.1 seconds after midnight, 2,035 February Gold
Futures contracts (GC.G13) took the market down $10 as fast as the exchange could execute
the order. Later that morning, we saw more of these sudden price moves.
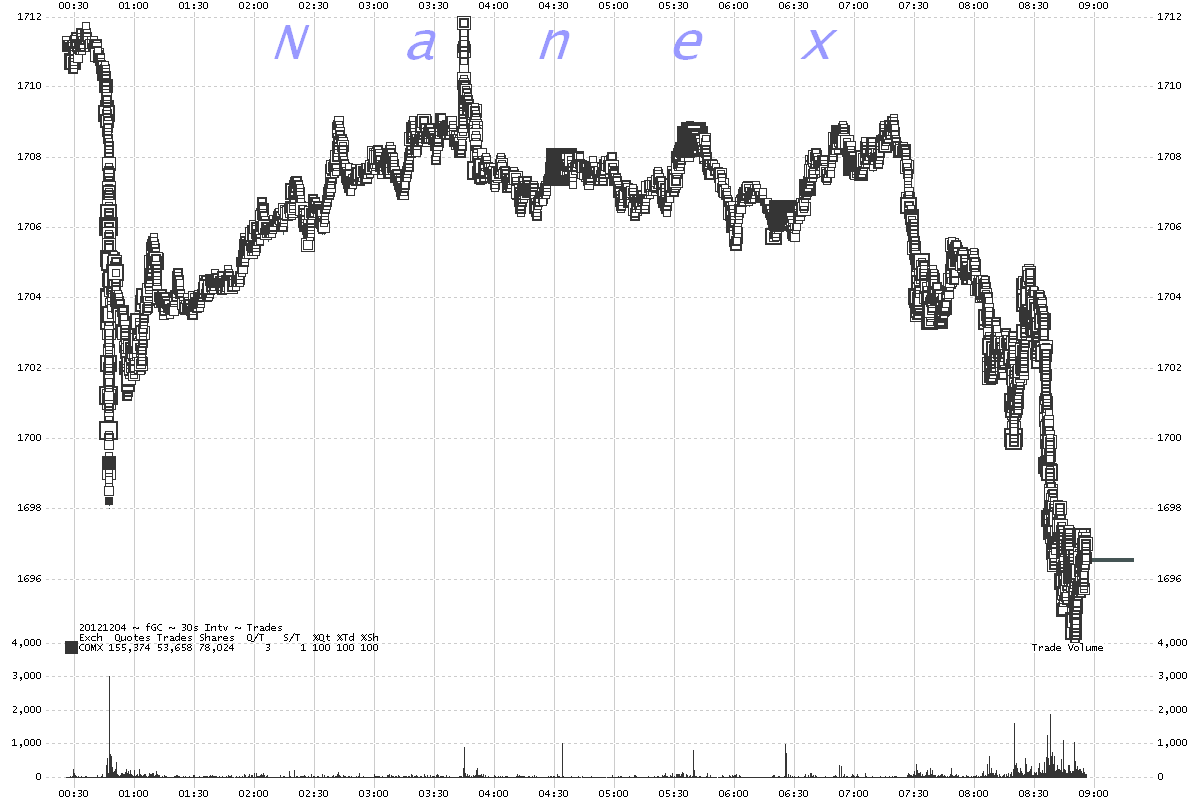
1. 30 Second interval chart showing trades for the first 9 hours of trading in the February
2013 Gold Futures Contract (GC.G13).
The midnight crush in the first drop on the left.
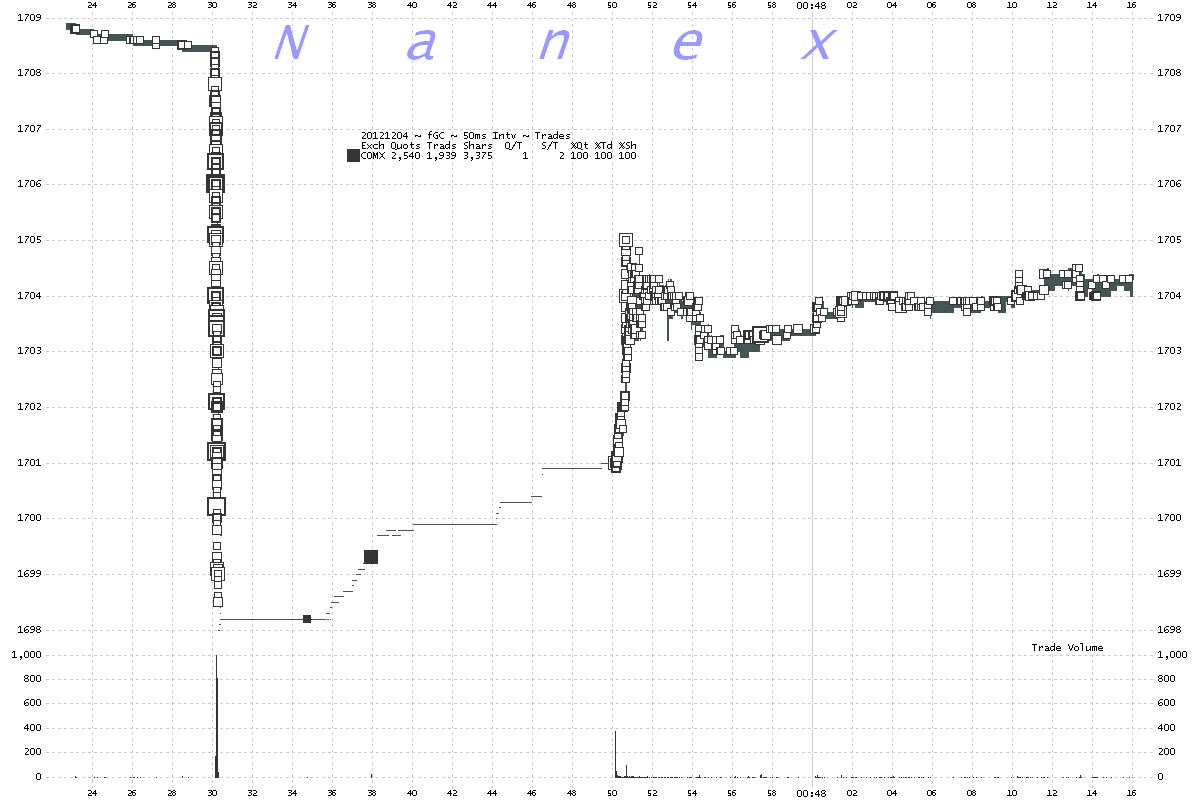
2. Zoom of chart above showing about 45 seconds of time. Thin gray line is quote
spread.
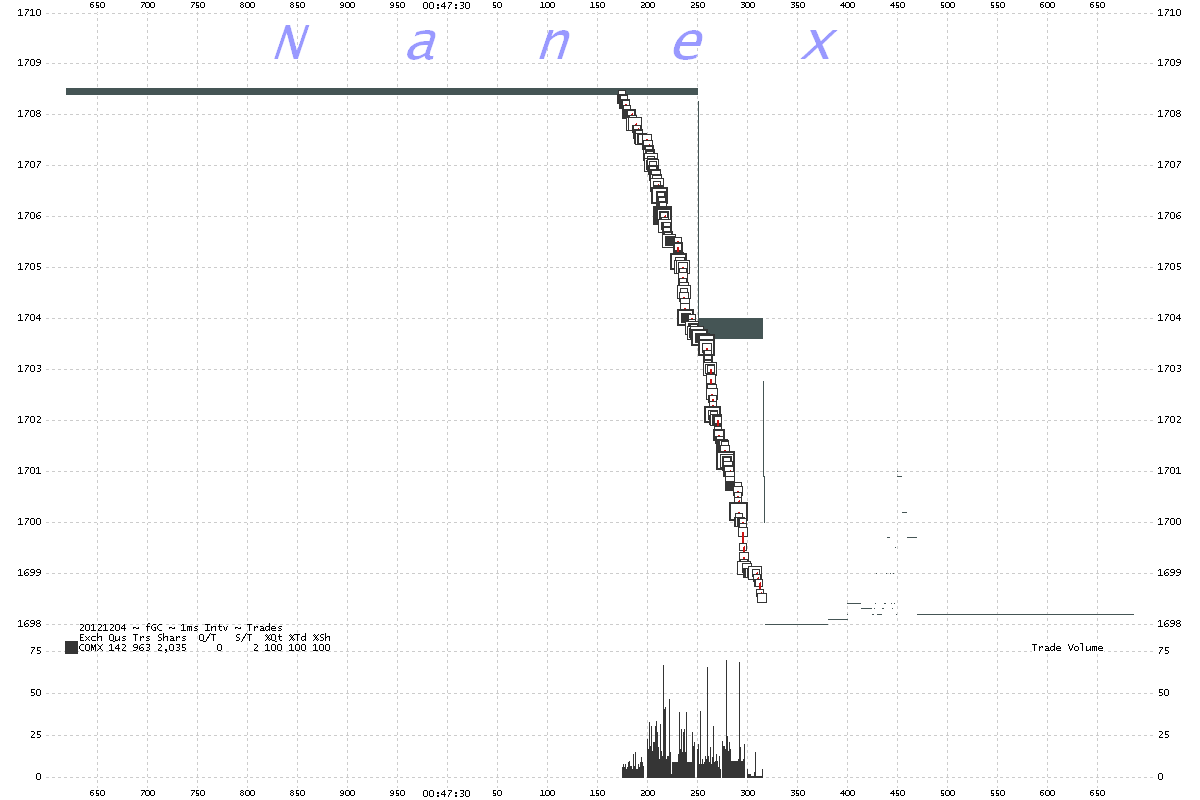
3. Using a 1 millisecond interval to zoom in on one second of time.
The trades are the squares. The Bid/Offer is the dark gray shading. When trades first
execute, then the quote follows, it's because the entire book was swept.
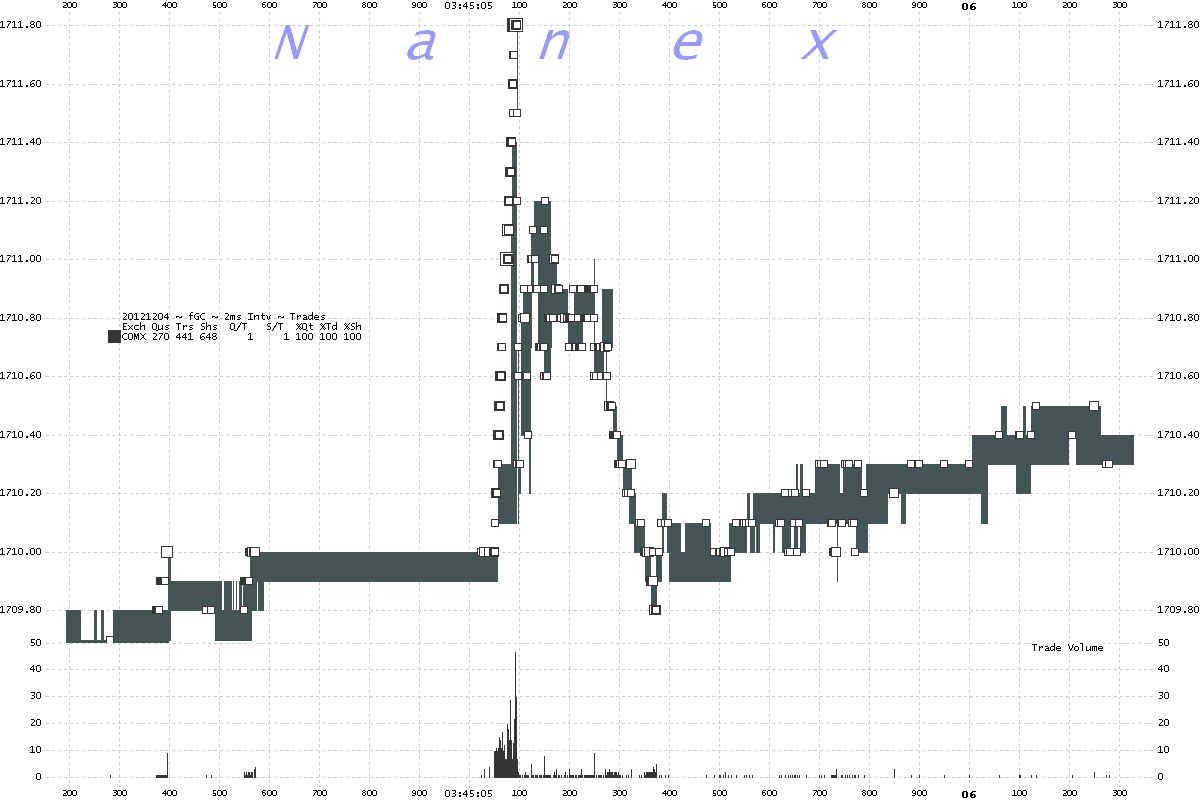
4. Later than morning at 3:45:05 Eastern time, a jolt to the upside.
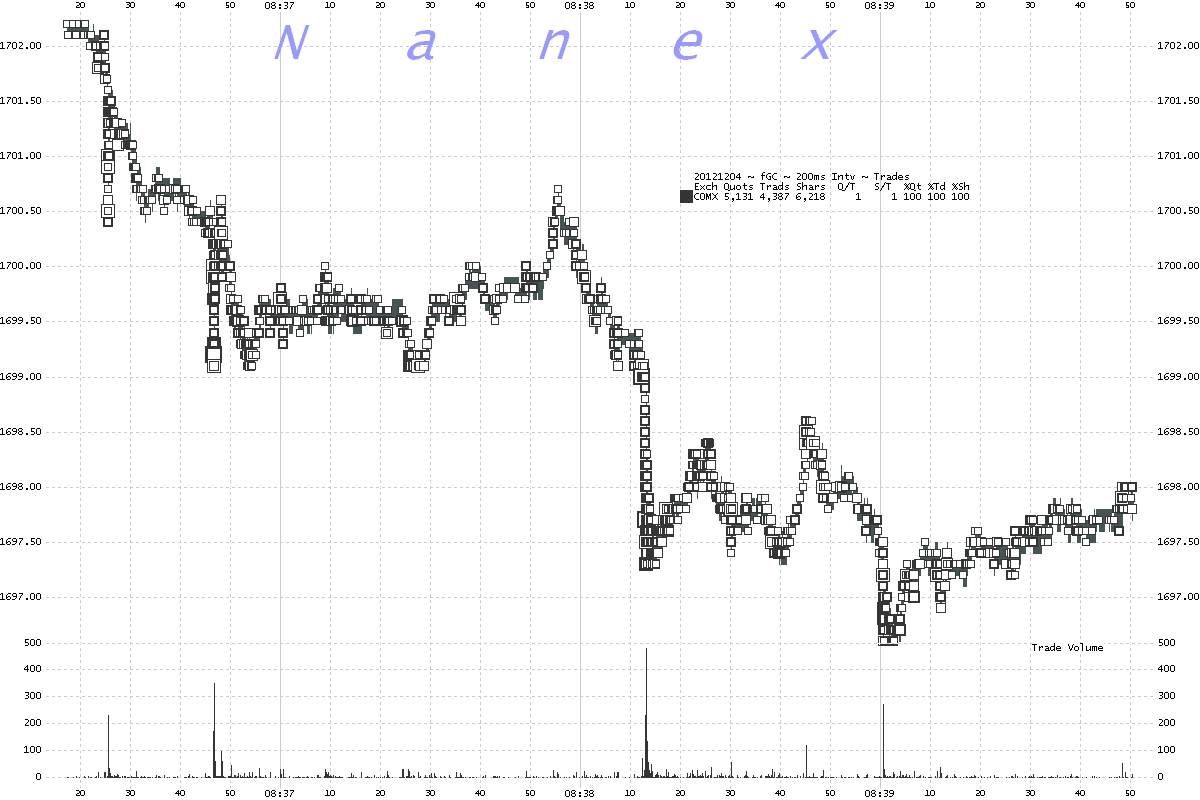
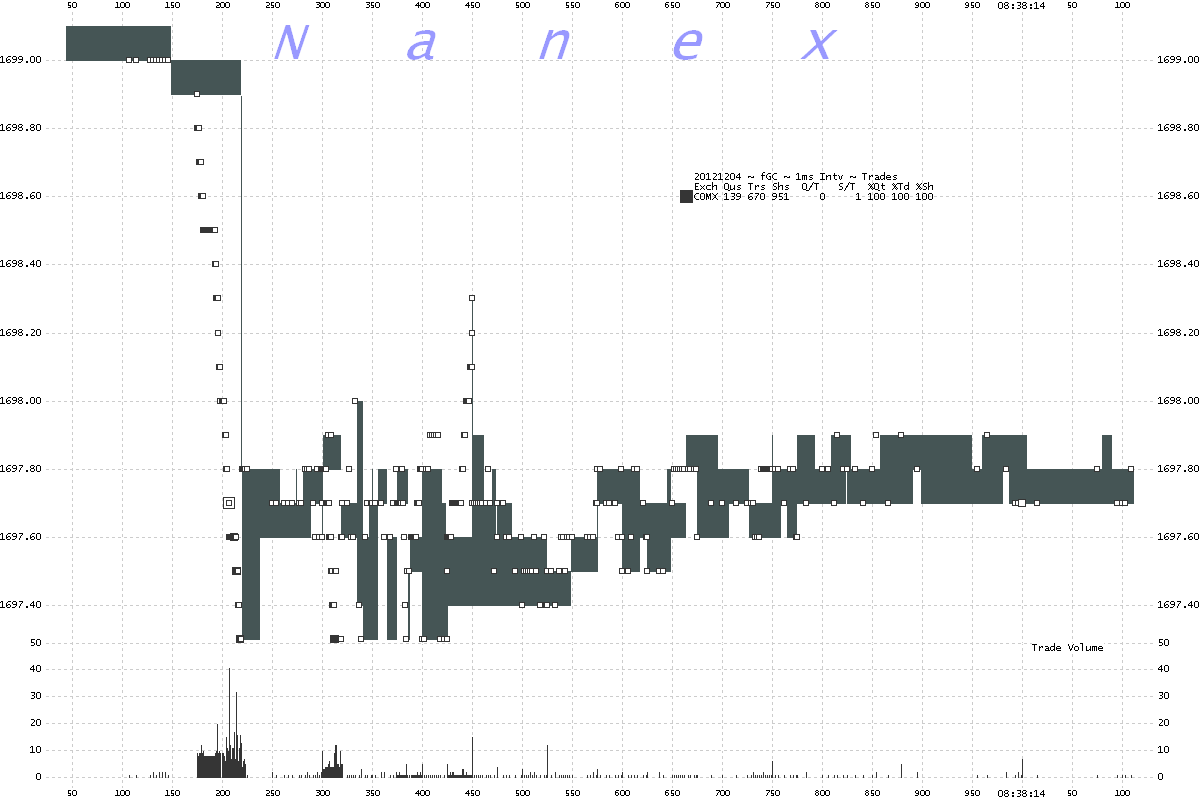
5. Later that morning between 8:36 and 8:40am Eastern, more sudden buying and
selling events took place. The chart below is an overview of these events.
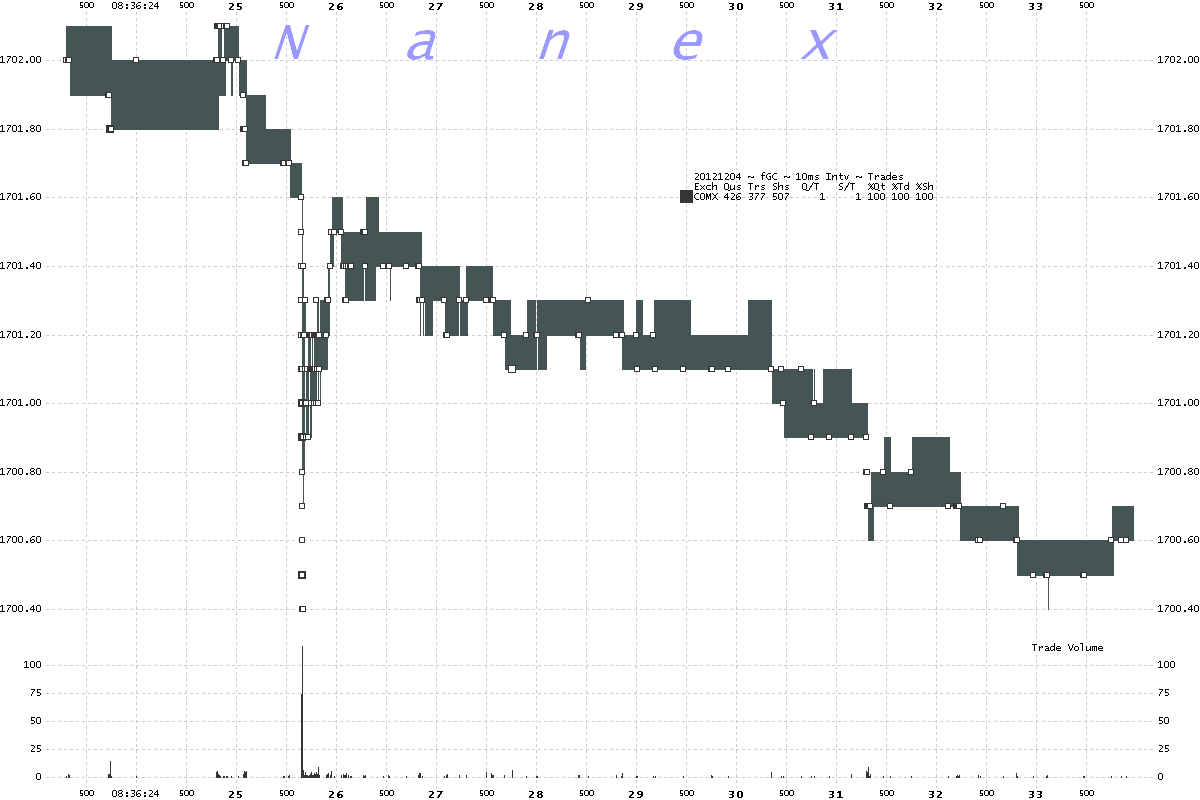
6. Zoom of Chart 5 showing first event.
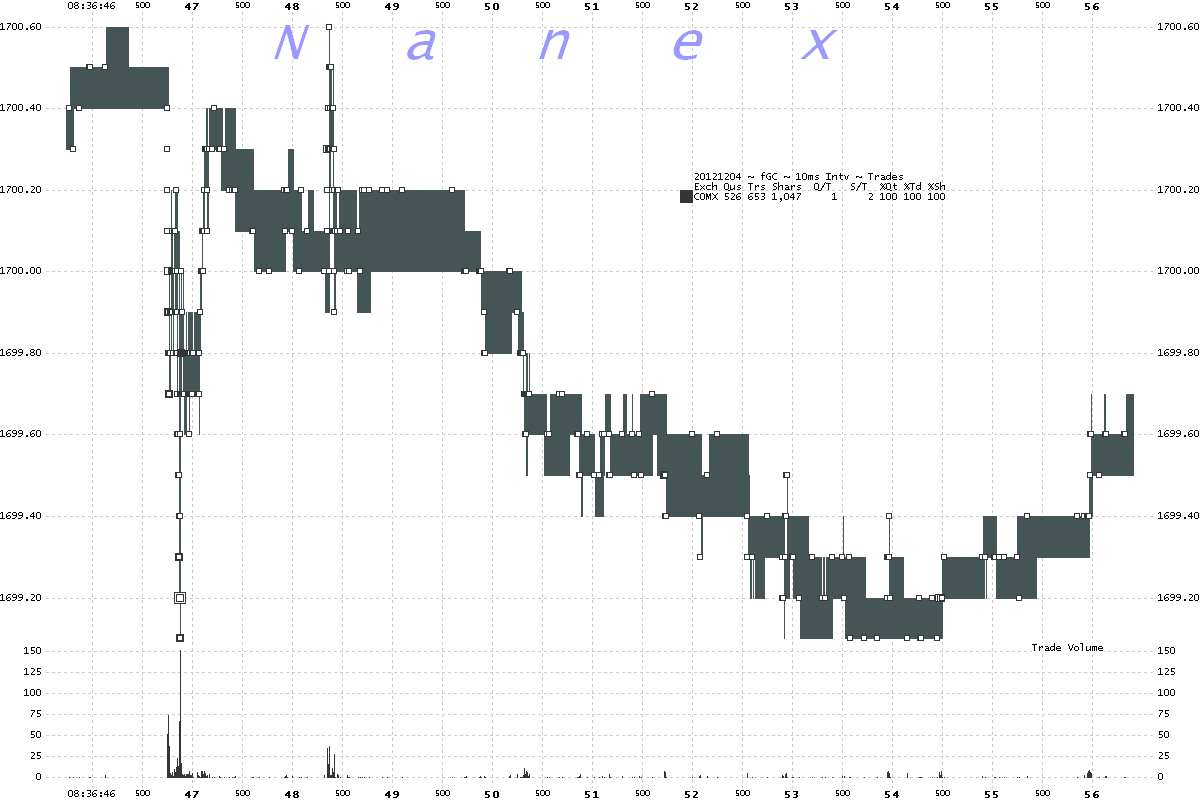
7. Zoom of Chart 5 showing second event.
8. Zoom of Chart 5 showing third event.
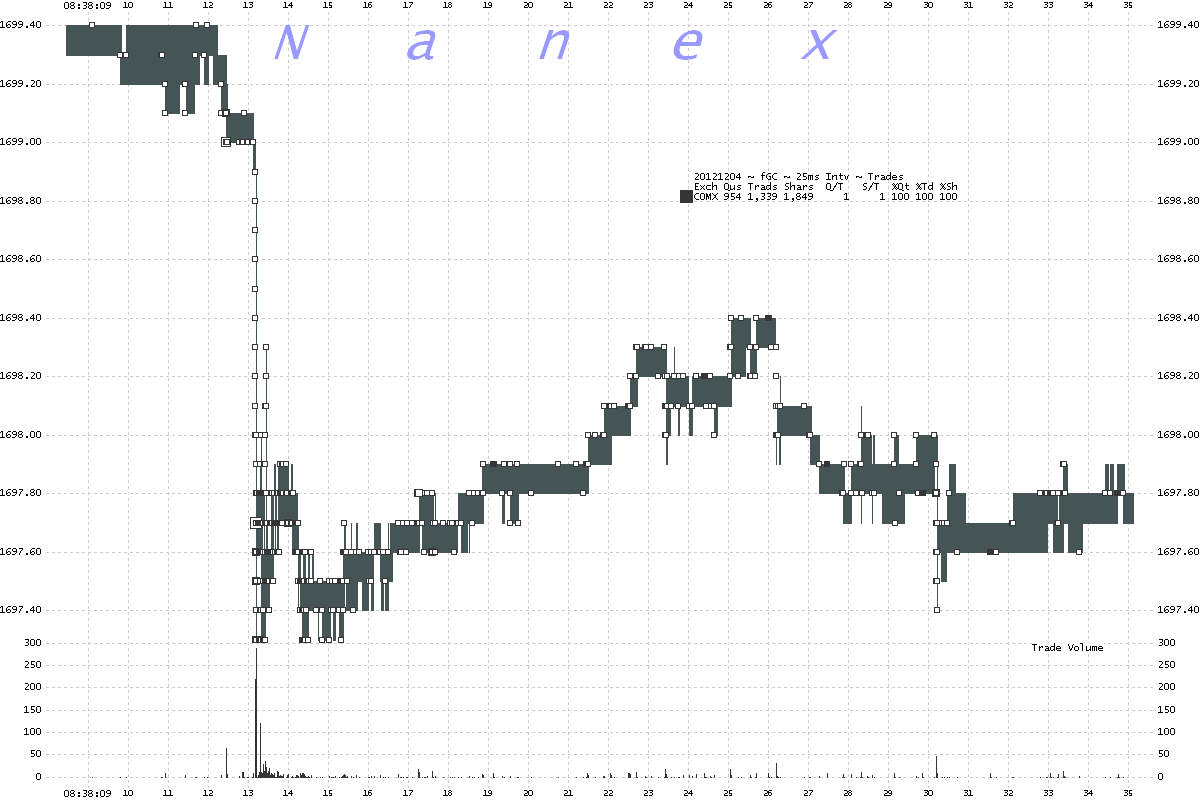
8. Zoom of Chart 7 above showing 1 second of time.
Nanex Research
Inquiries: pr@nanex.net


