Nanex Research

Nanex ~ 10-Dec-2012 ~ The BABZ Event
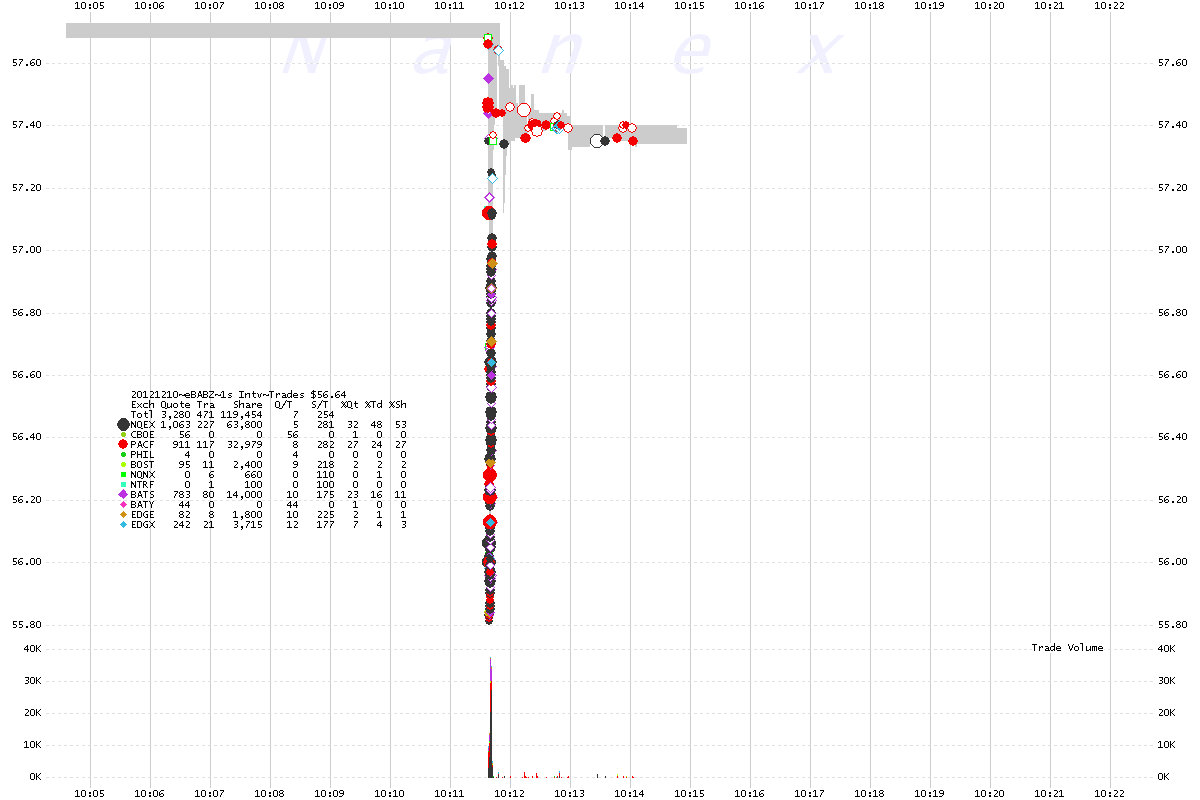
On December 10, 2012, at 10:11:38 EST, the stock of PIMCO Build America Bond ETF (symbol
BABZ) showed a most curious pattern that we have not seen before. After a sudden decline
of 3% in one second, the stock rallied and nearly recovered the entire drop over a 3
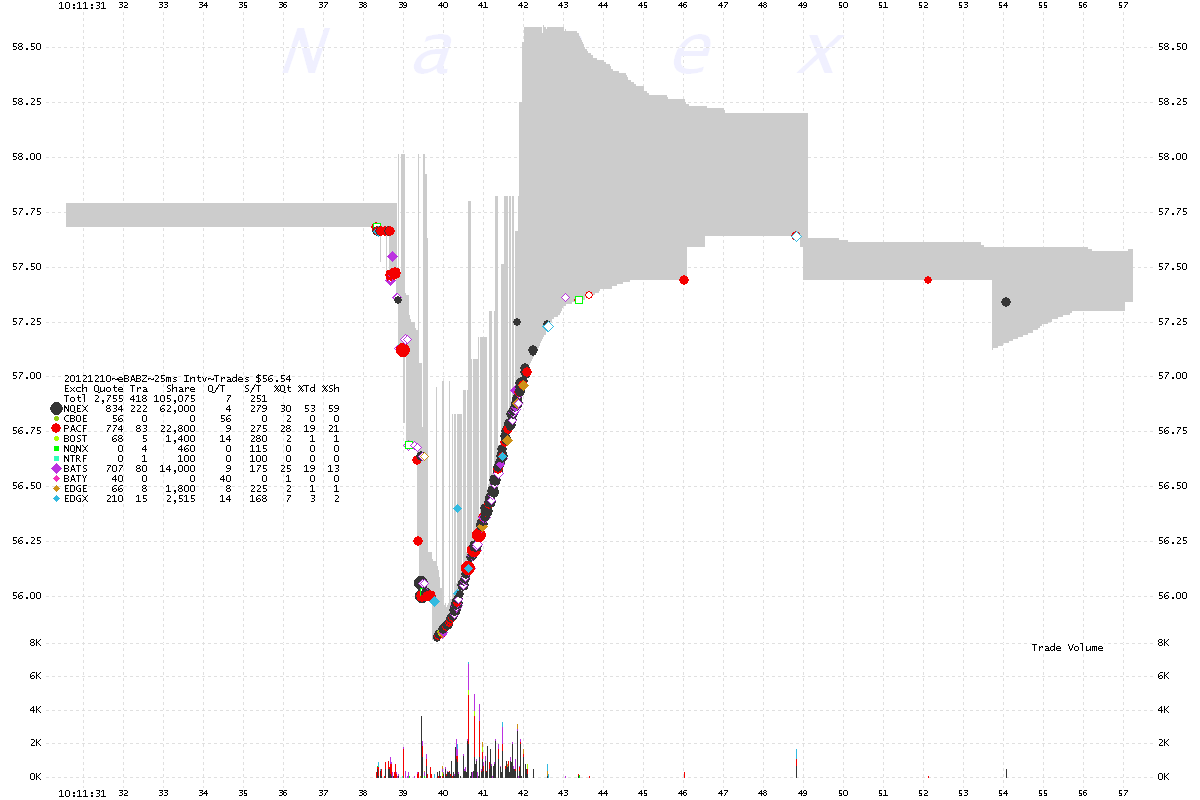
second period. What was unusual about this event, is the almost all the trades in the
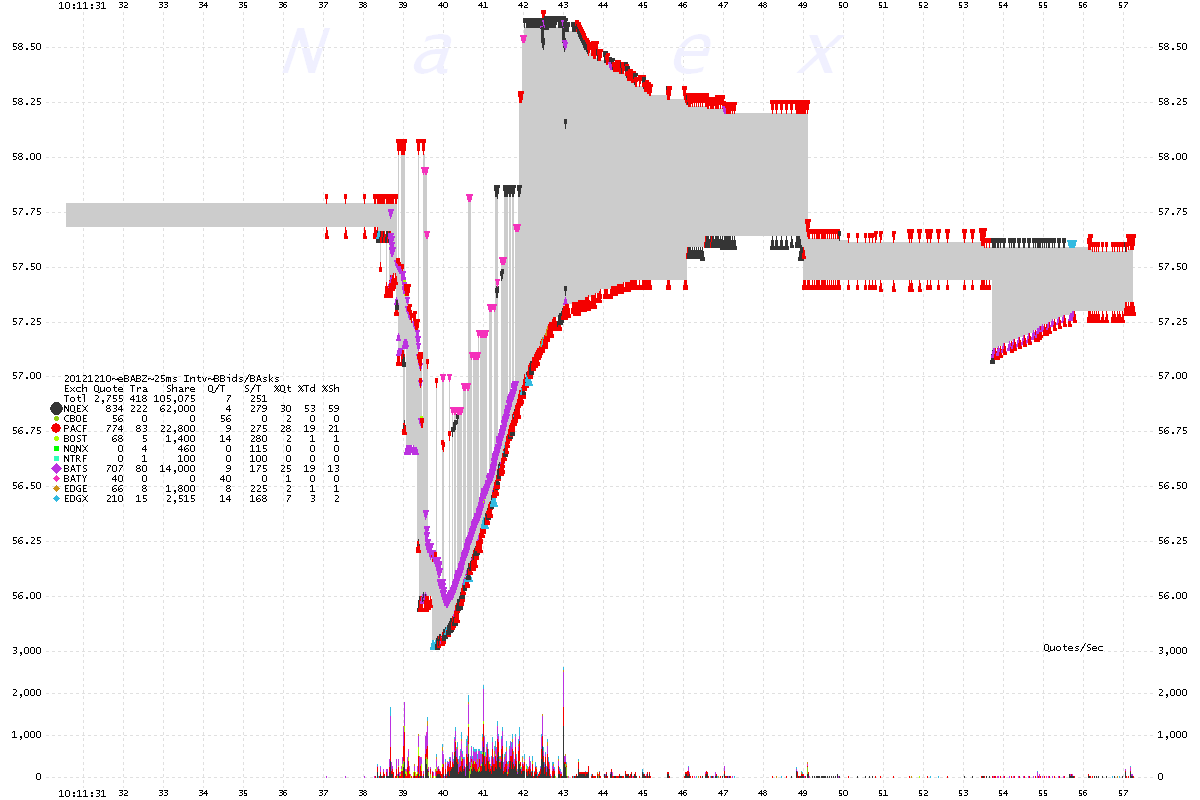
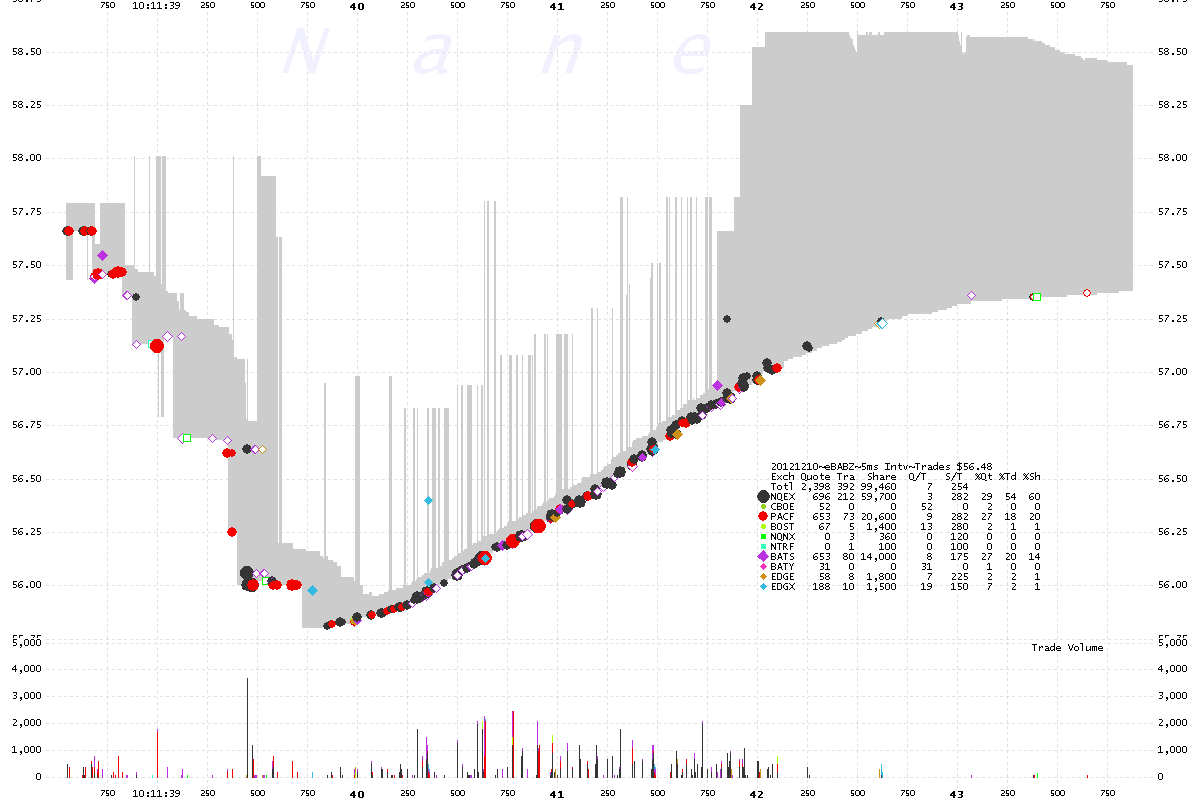
rally, executed at the National Best Bid! The best bid steadily rose in price and trades
executed at that price. Normally we see the bulk of trades execute at the offer during
rallies, and at the bid during declines. It's as if someone dropped the stock suddenly,
then slowly raised the bid, scooping up incoming sell orders.
1. BABZ 1 second interval chart showing trades color coded by exchange. The
gray shading is the National Best Bid/Offer (NBBO).
2. BABZ 25 millisecond interval chart showing trades color coded by exchange.
The gray shading is the National Best Bid/Offer (NBBO).
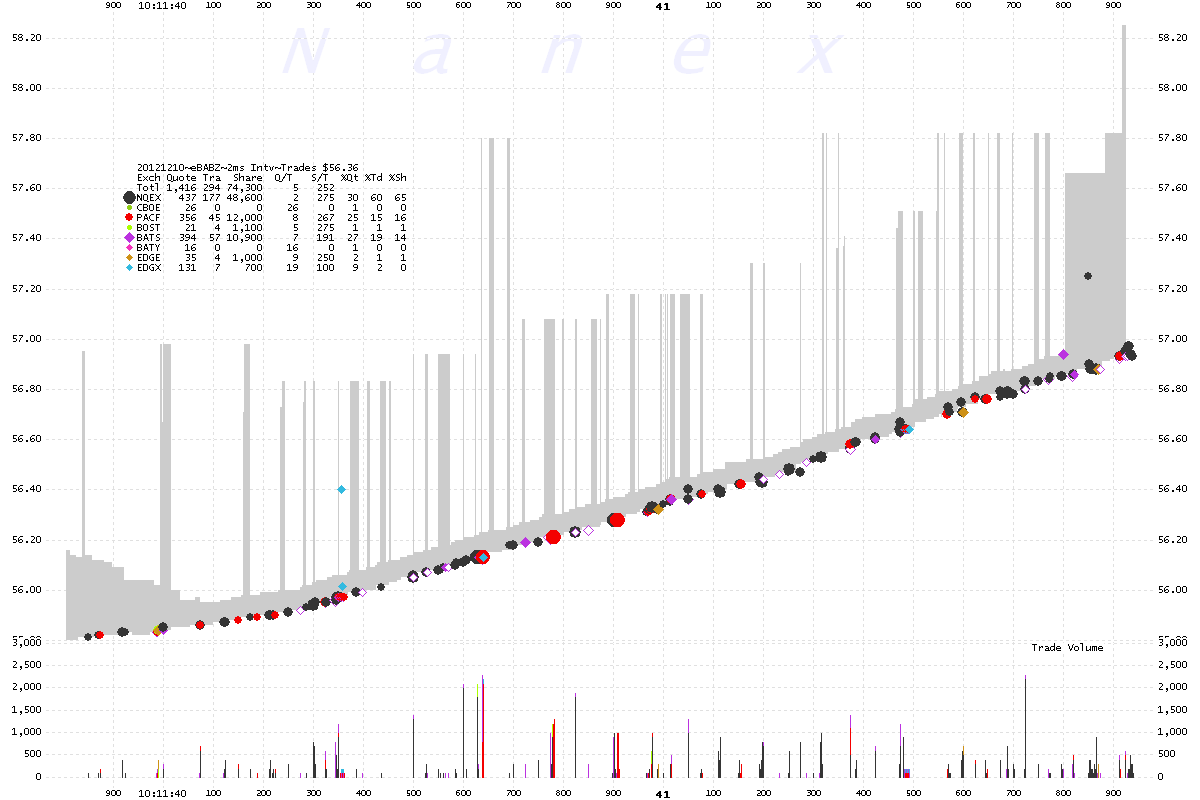
Note how almost all the trades from the bottom during the rally occurr at the best bid.
3. BABZ 25 millisecond interval chart showing best bids and asks color coded
by exchange.
4. BABZ 5 millisecond interval chart showing trades color coded
by exchange.
5. BABZ 5 millisecond interval chart showing best bids and asks color coded
by exchange.
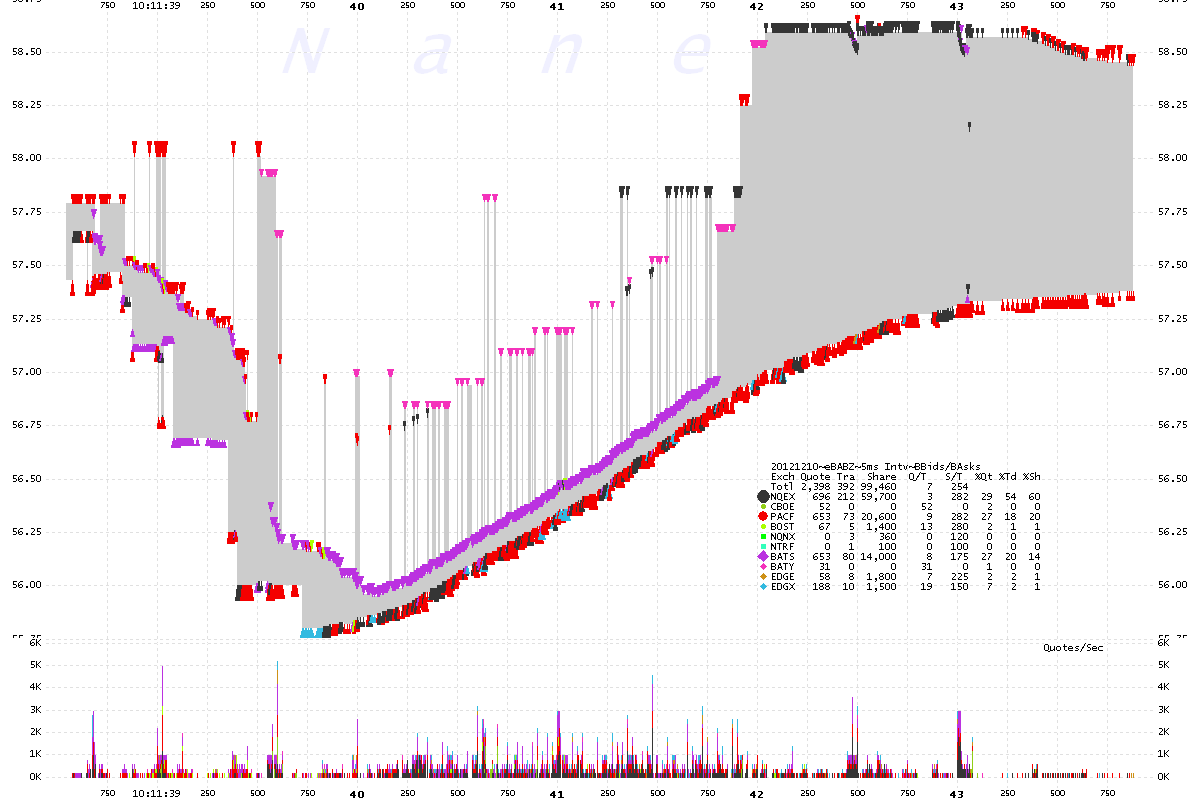
6. BABZ 2 millisecond interval chart showing trades color coded by exchange.
Nanex Research
Inquiries: pr@nanex.net


