Nanex Research

Nanex ~ 10-Dec-2012 ~ Cycles in Knight's Rogue Algo
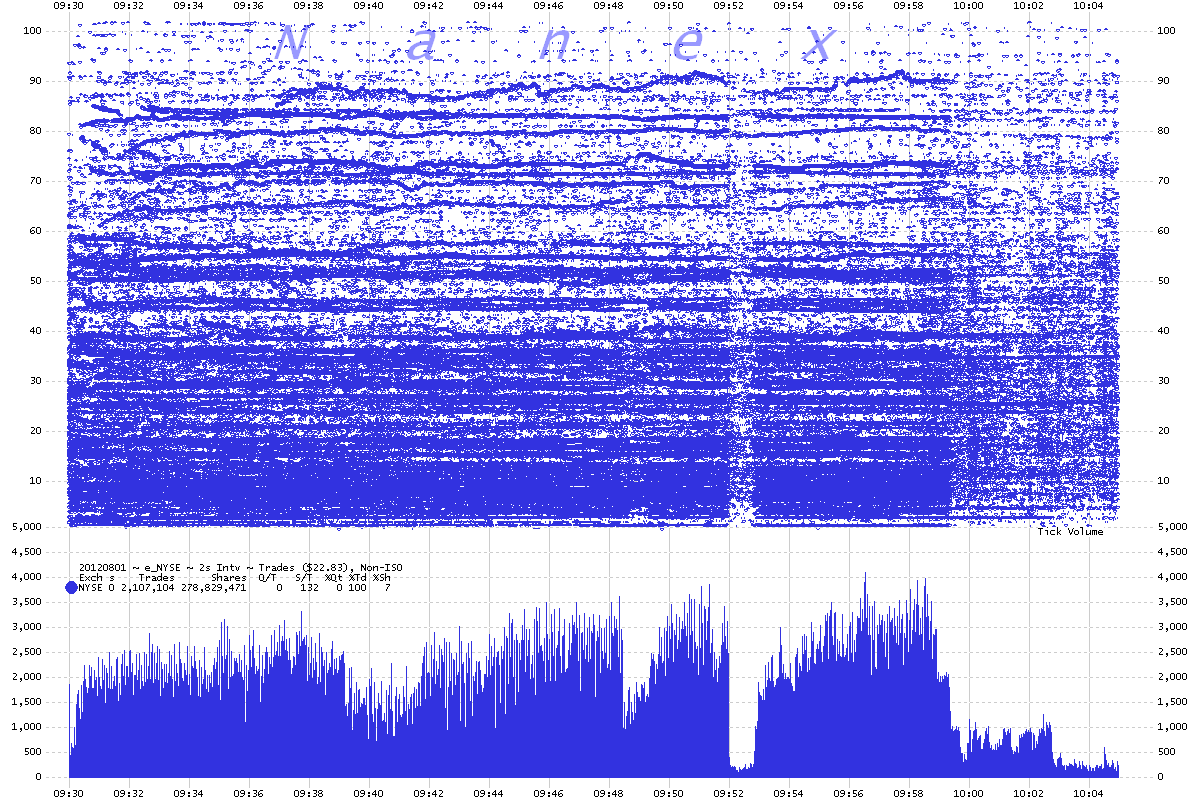
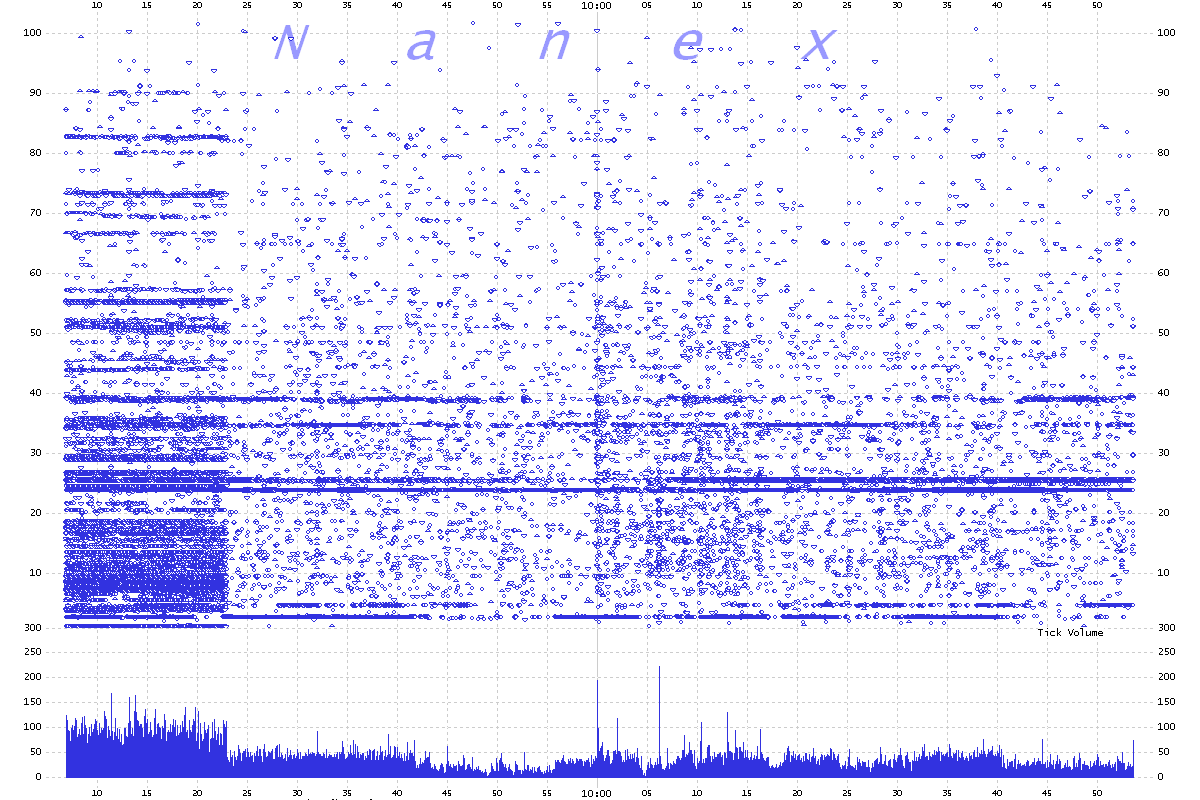
We plotted all NYSE reported trades for all NYSE listed stocks priced below $100 for
the first 35 minutes of trading on August 1, 2012. This was the period of time when
a rogue algorithm from Knight randomly bought and sold stocks. We
previously found that trades from this rogue algo in NYSE listed
stocks showed up in the tape marked regular (not ISO) and executed at NYSE.
We made a new discovery which becomes evident in these charts at resolutions of 100
milliseconds or lower. Specifically, we find that this rogue algorithm would regularly shut-off for
a fraction of a
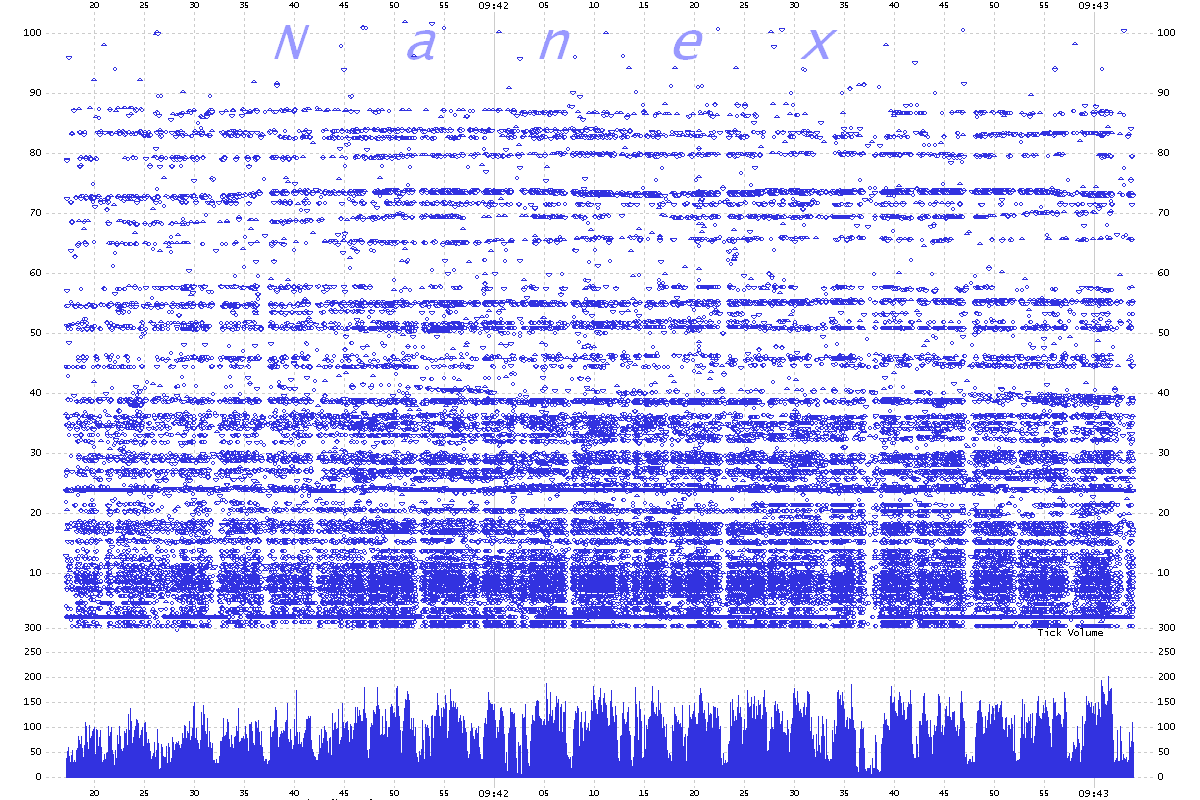
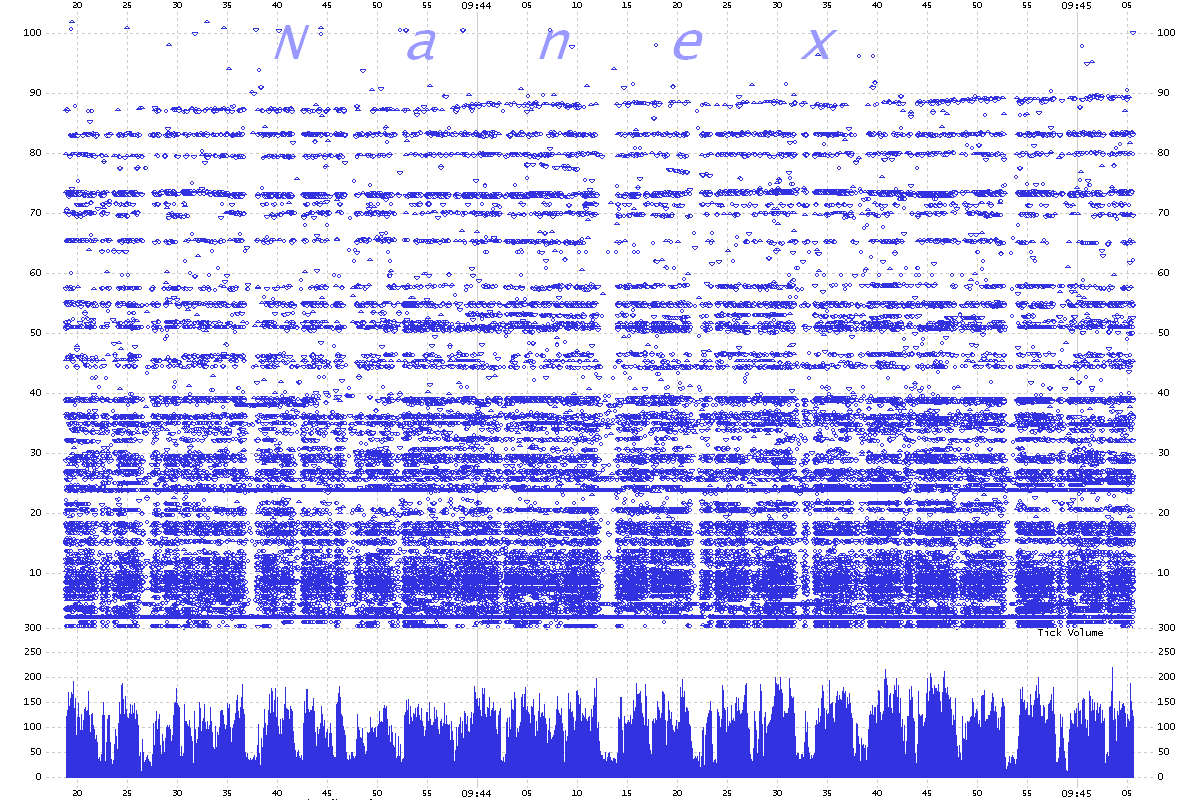
second in all stocks, approximately every 5 seconds. This behavior is
clearly evident in charts 7 through 13 below.
This new discovery fits our current
theory on the nature and cause of Knight's software problem on August
1st, 2012.
1. Regular Trades: 2-second Interval Chart showing from 9:30 (open) until 10:04.
This chart shows 2.1 million trades.
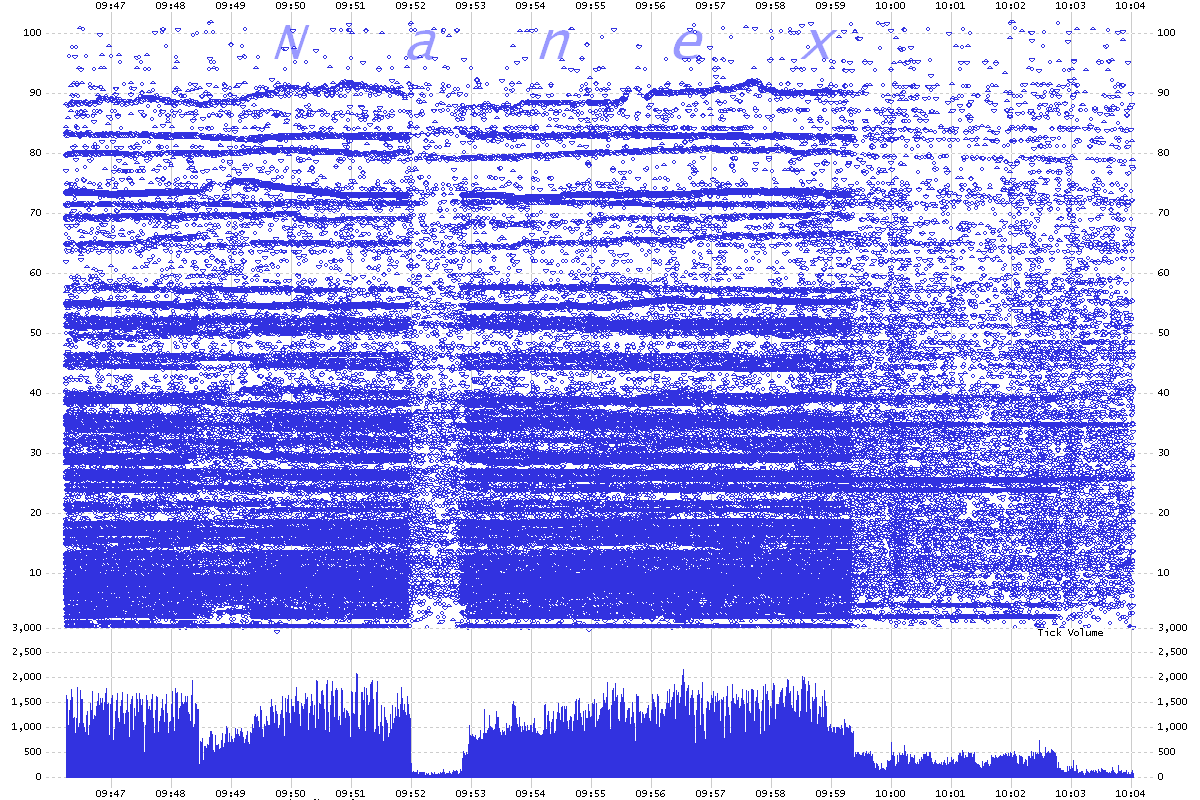
2. Regular Trades: 1-second Interval Chart showing from 9:46 (open) until 10:04.
Zoom of Chart 1.
The charts below are all 100 millisecond interval charts showing about 1.5 minutes of
time.
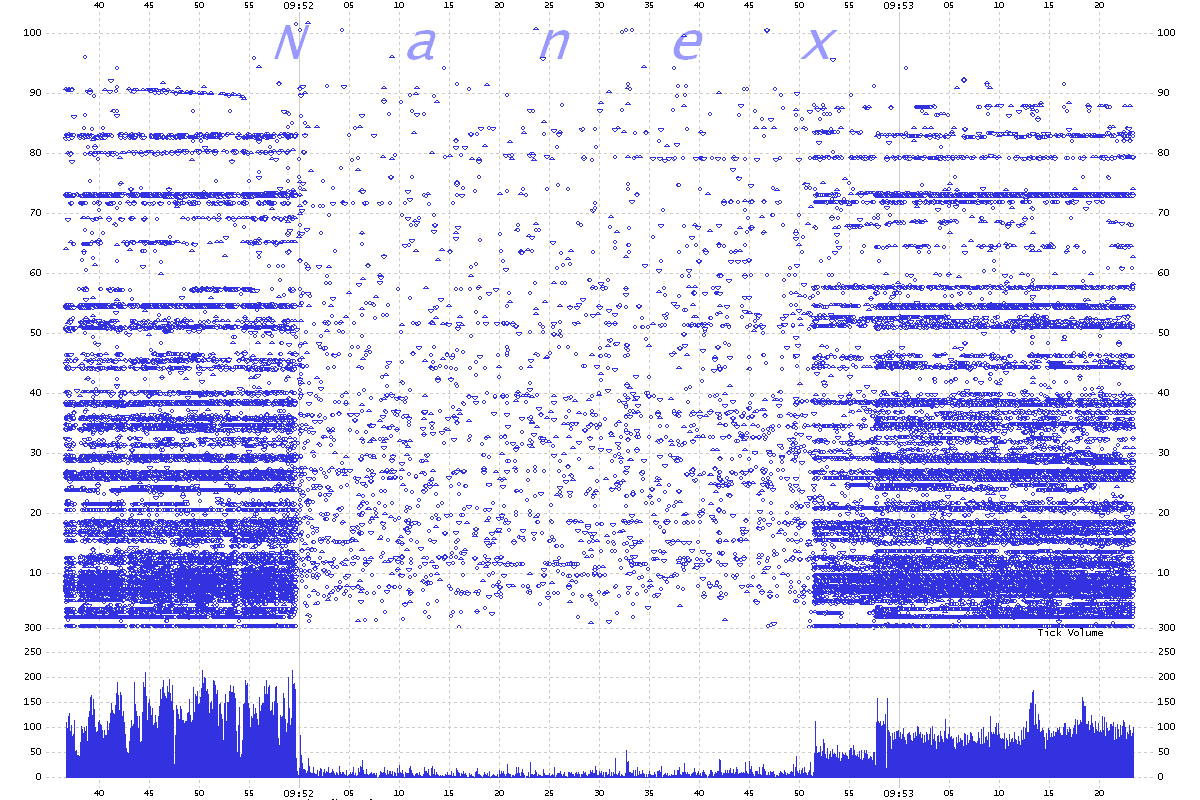
3. Regular Trades.
You can clearly see something stopped at 9:52,
then started back up at 9:52:50.
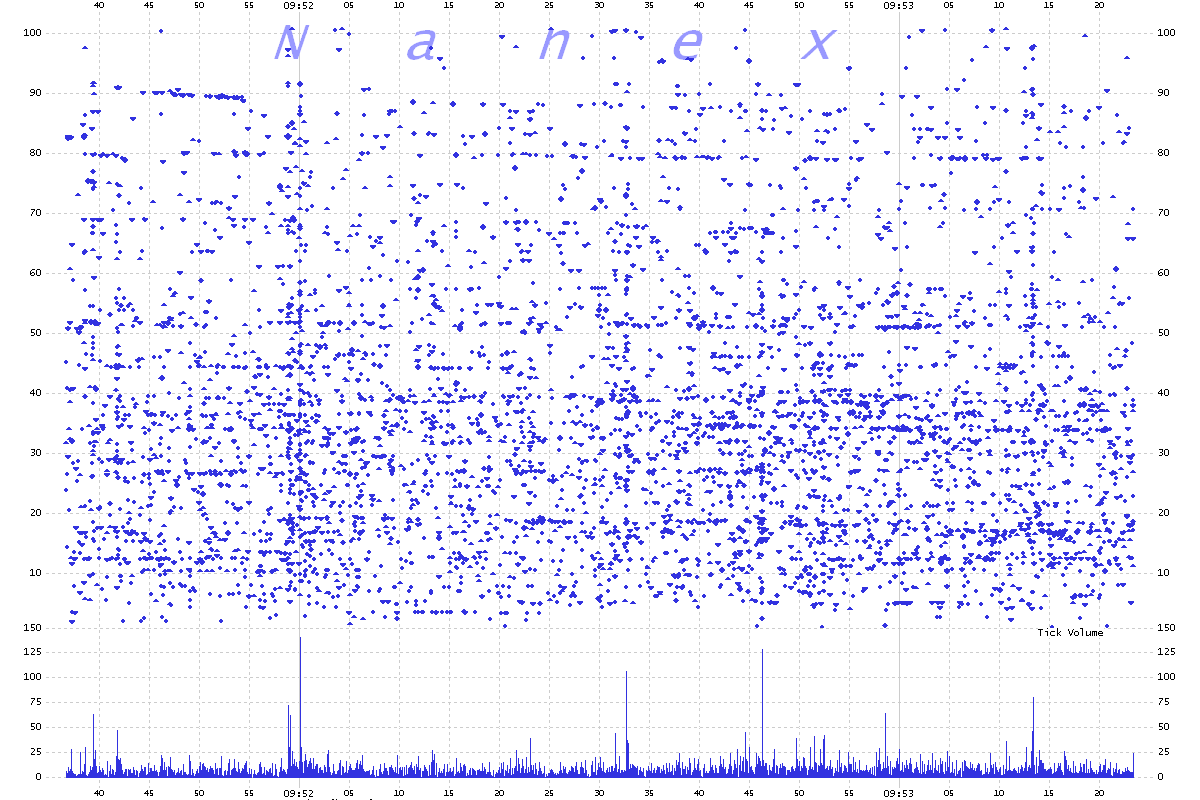
4. ISO Trades. Same time period as chart above so you can compare.
Note that ISO trades aren't affected like non-ISO trades (chart above).
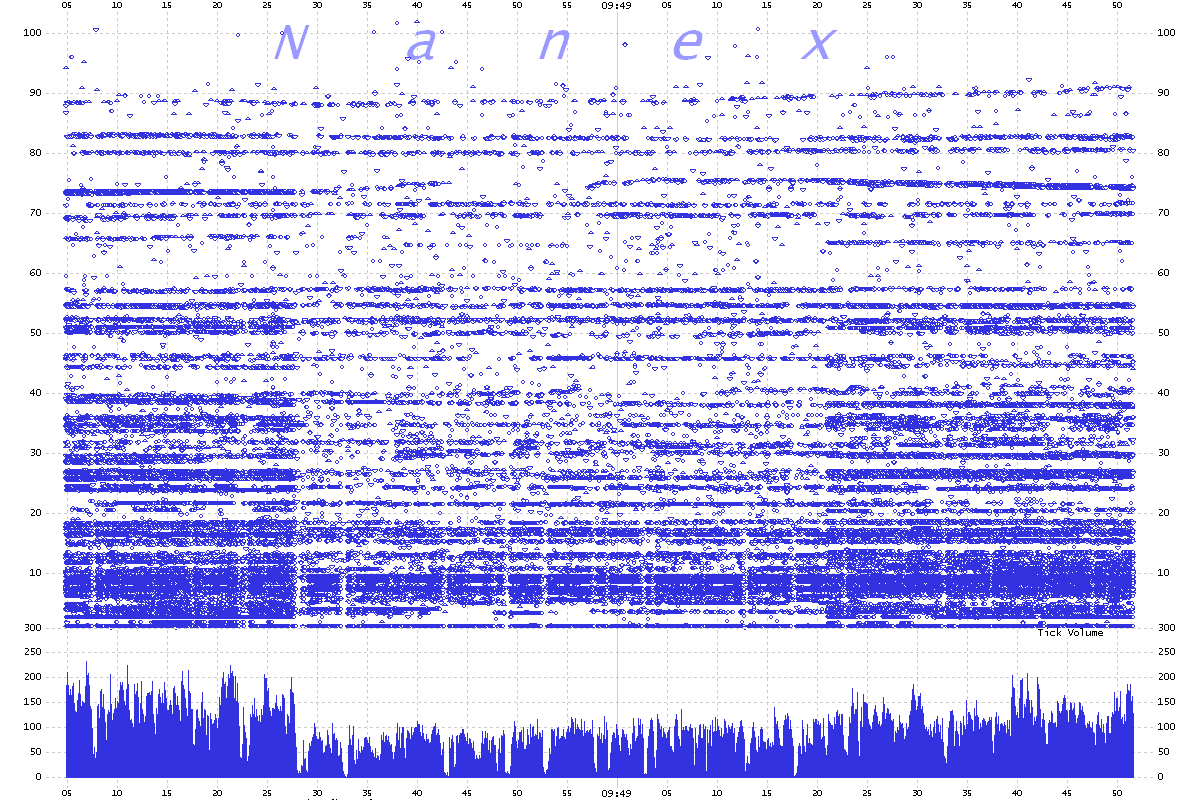
5. Regular Trades.
There is a drop-off at 9:48:25 until 9:49:20, but not as pronounced as chart 3.
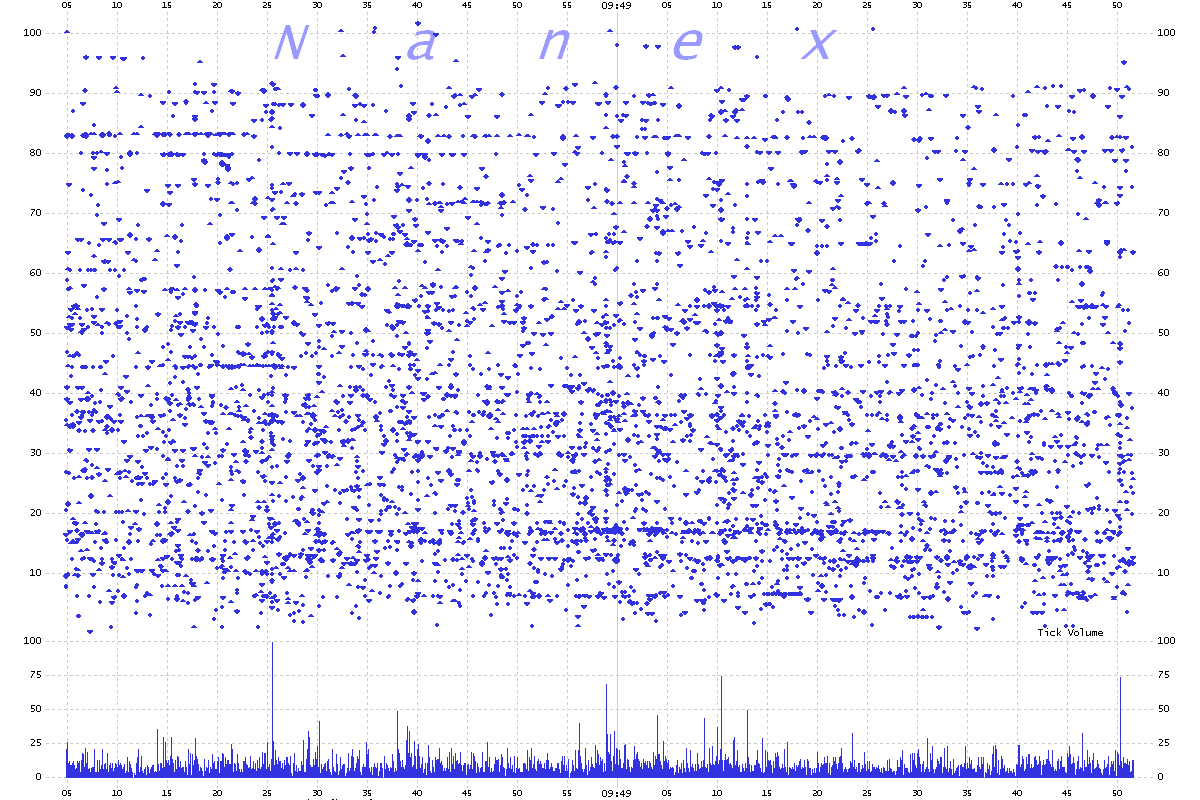
6. ISO Trades. Same time period as chart above so you can compare.
Note that ISO trades aren't affected like non-ISO trades (chart above).
The charts below are all 100-millisecond interval charts showing about 1.5 minutes of
time. These charts are included to illustrate the gaps the appear every 5 seconds or
so. The white banding is due to an absence (or reduction) of trading in all stocks.
7. NYSE Regular Trades in all NYSE listed stocks prices below $100.
8. NYSE Regular Trades in all NYSE listed stocks prices below $100.
9. NYSE Regular Trades in all NYSE listed stocks prices below $100.
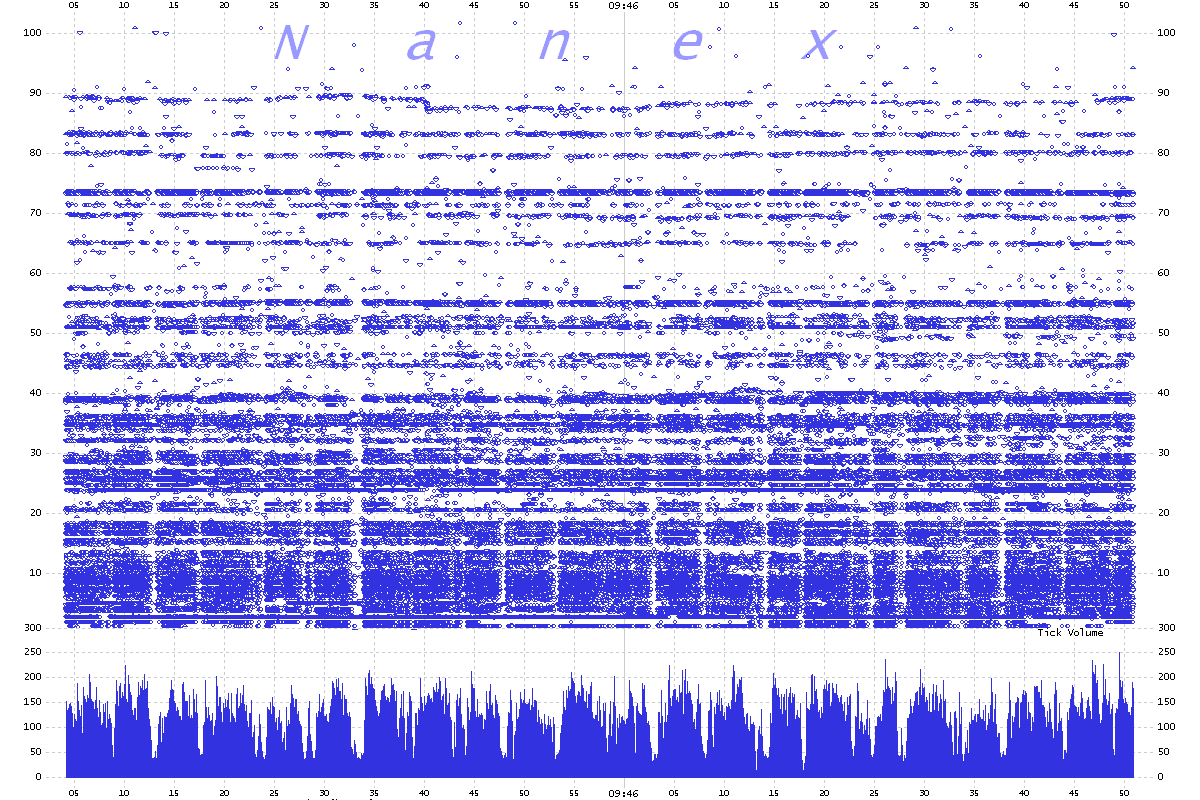
10. NYSE Regular Trades in all NYSE listed stocks prices below $100.
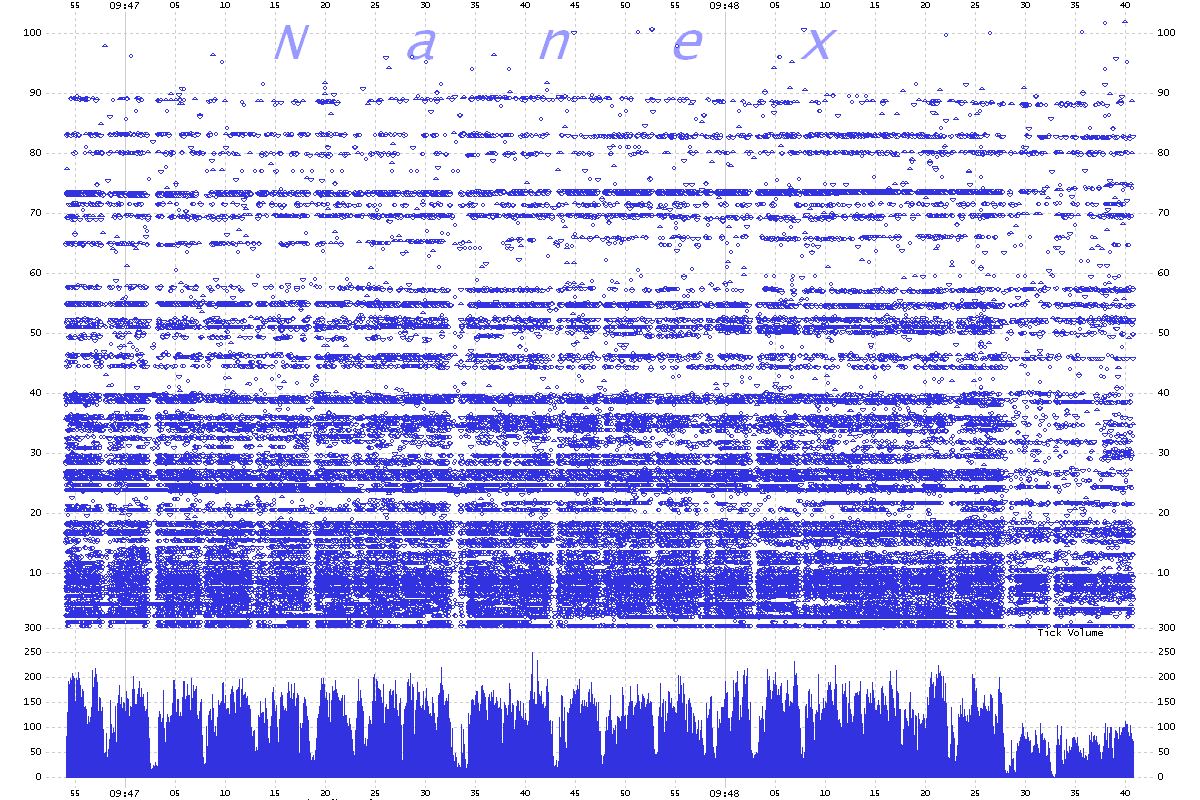
11. NYSE Regular Trades in all NYSE listed stocks prices below $100.
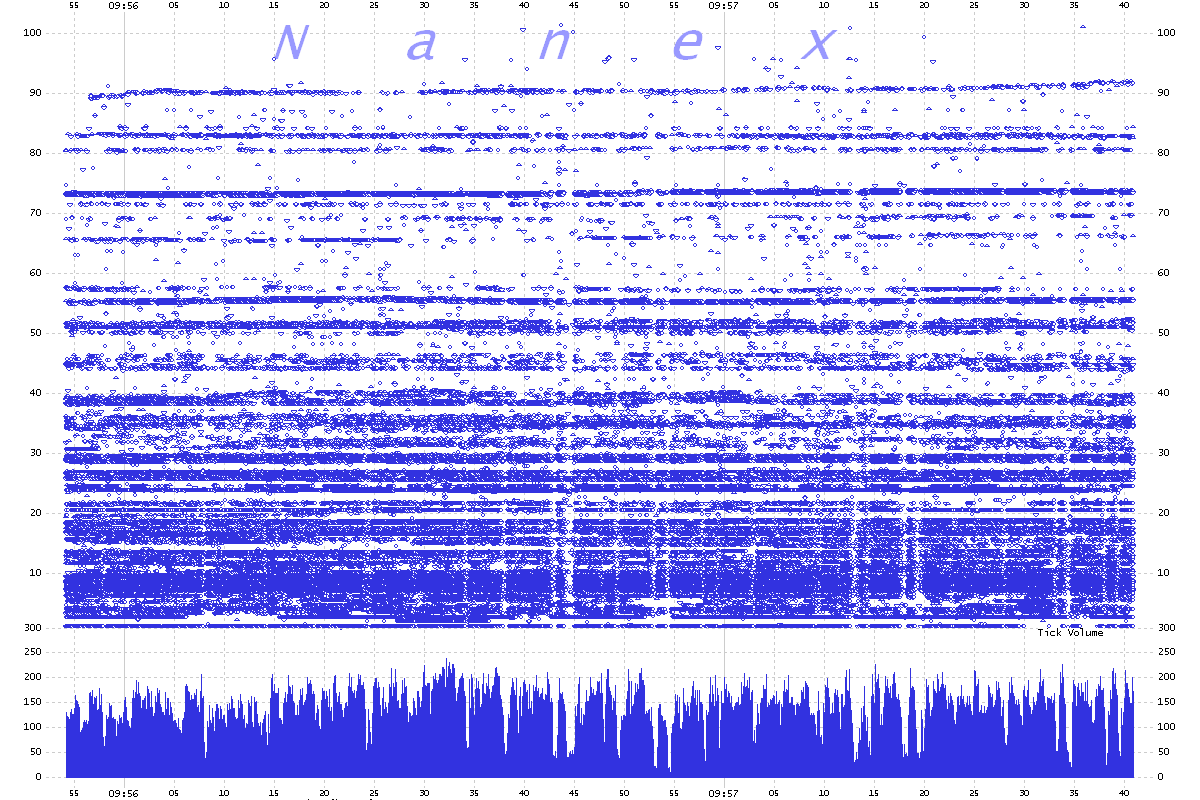
12. NYSE Regular Trades in all NYSE listed stocks prices below $100.
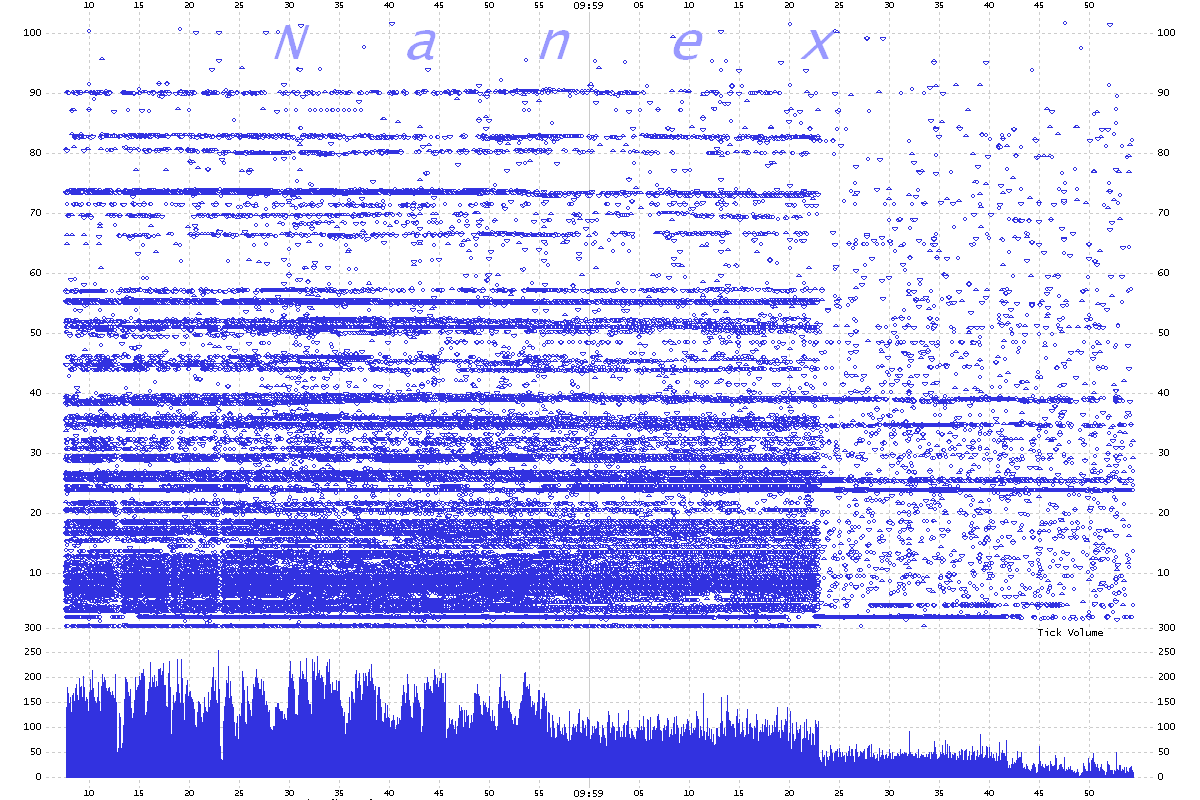
13. NYSE Regular Trades in all NYSE listed stocks prices below $100.
Nanex Research
Inquiries: pr@nanex.net


