Nanex Research

Nanex ~ 12-Dec-2012 ~ Fool's Gold
Gold was a lot calmer during the December 12, 2012 FOMC announcements than it was on
September 13, 2012.
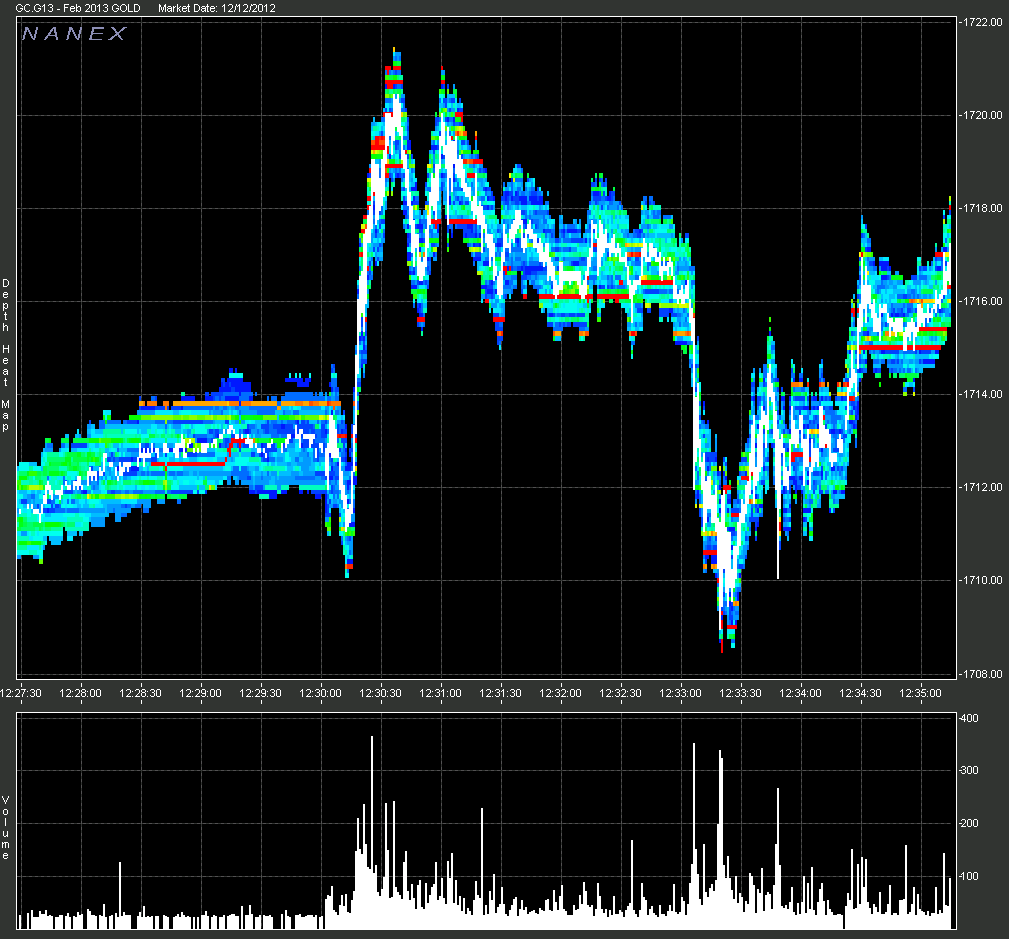
Though it did trade in a $12 range during the first 3 minutes after the 12:30pm EDT
announcement time. There was also a fake out to the downside before a sudden $10
rally.
1. Feb 2013 Gold Futures (GC.G13) showing last sale and depth of book.
2. GLD trades color coded by exchange.
3. GLD bids and asks color coded by exchange.
Note the widening of the spread in the minutes before the 12:30 price explosion.
4. Zooming in on Chart 2.
5. Zooming in further showing the fake out to the downside before the rally begins.
6. Zooming in showing more sudden price moves.
7. Chart shows just one second of time.
Note: the SEC used 1 minute sample data when investigating the flash crash.
Nanex Research
Inquiries: pr@nanex.net