Nanex Research

Nanex ~ Stock Price Correlation
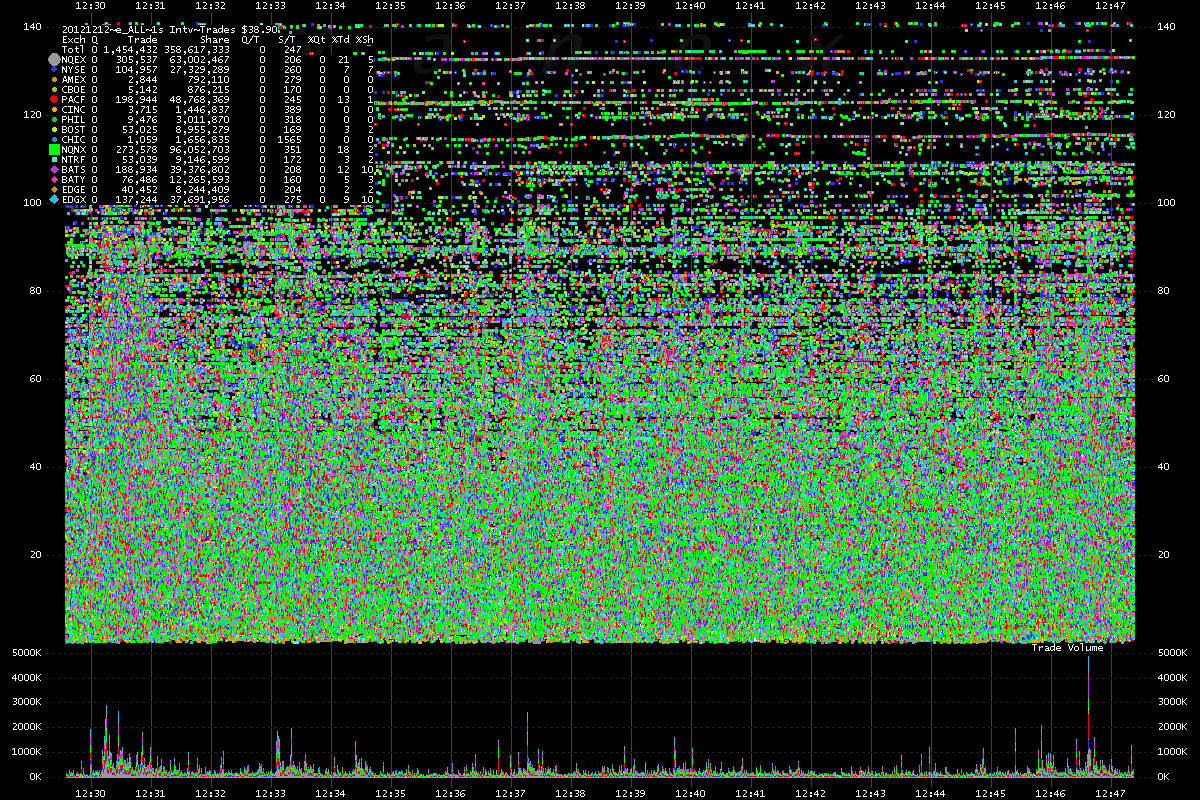
The chart below plots 1,454,432 trades for all 7,800 NMS stocks priced between $0.0001
and
$140 during a 17 minute period during the FOMC announcement on December 12, 2012. It
uses a 1 second resolution interval - which means each pixel is 1 second of time. The
SEC used 1 minute "samples" in their flash crash report. It's hard to see any patterns
at even 1 second resolution. Trades for the symbol SPY are the string of dots
near the top at $144.
One second resolution chart of trades color coded by exchange. Chart shows 17 minutes
of time.

The charts below illustrate how often hundreds of stocks are executed at the same time (within milliseconds). These are likely the result of stat-arb algos: based on correlation with ETFs or other instruments.
Look for vertical lines, which occur when many stocks,
all at different price levels, execute in the same time interval. Click Start/Stop to run a slide show of all 17 images, or Prev/Next to step through them one
at a time.
Nanex Research
Inquiries: pr@nanex.net

