Nanex Research

Nanex ~ 13-Dec-2012 ~ Structure Failures
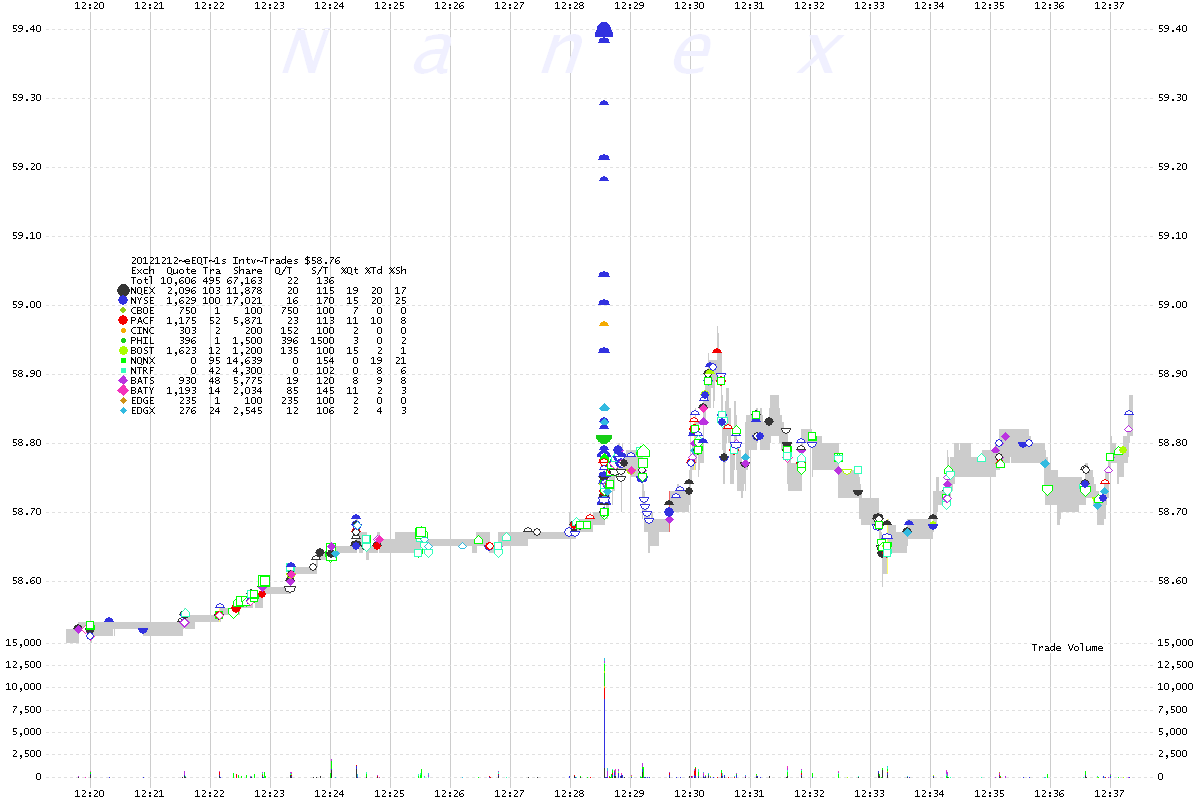
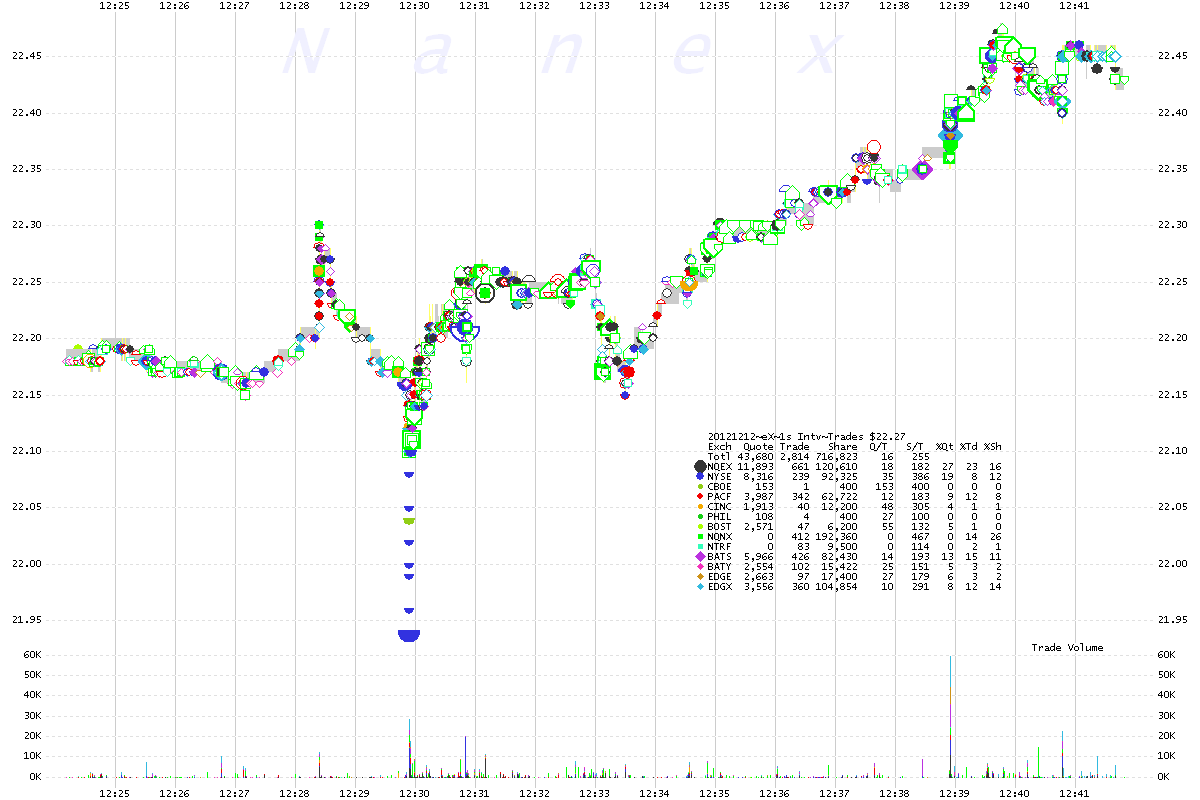
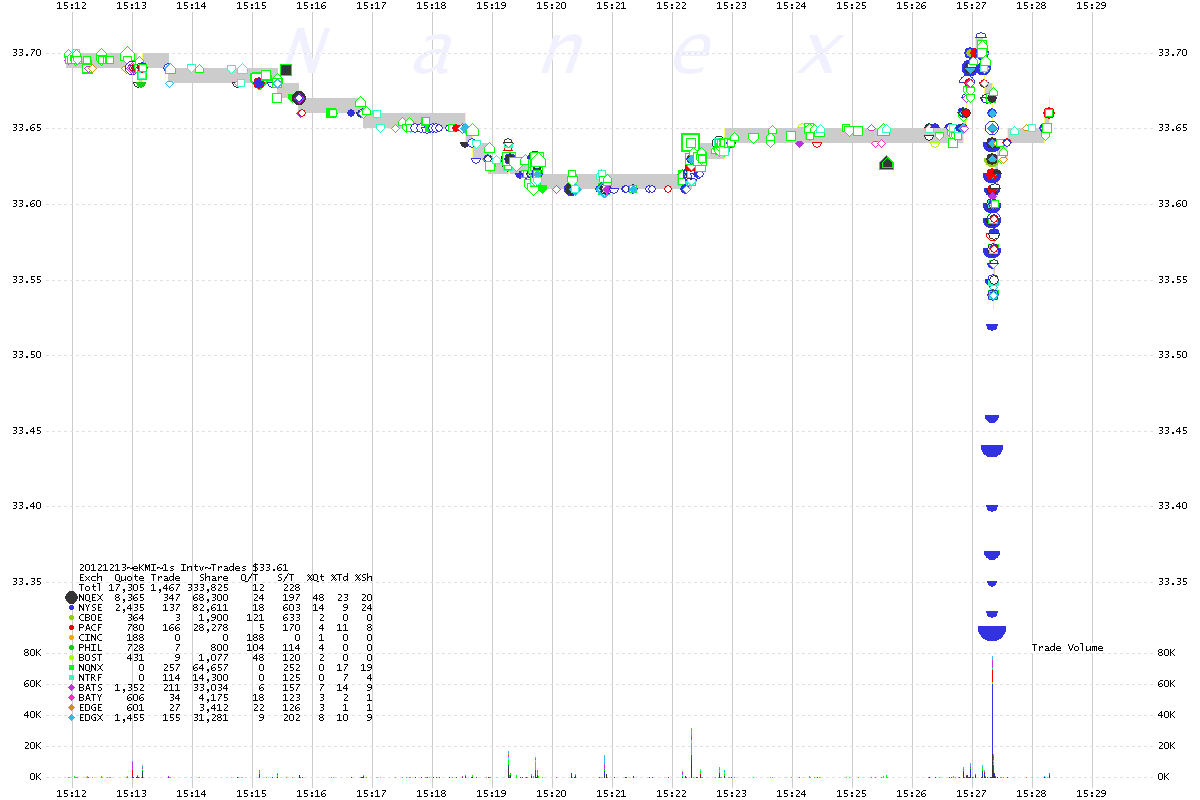
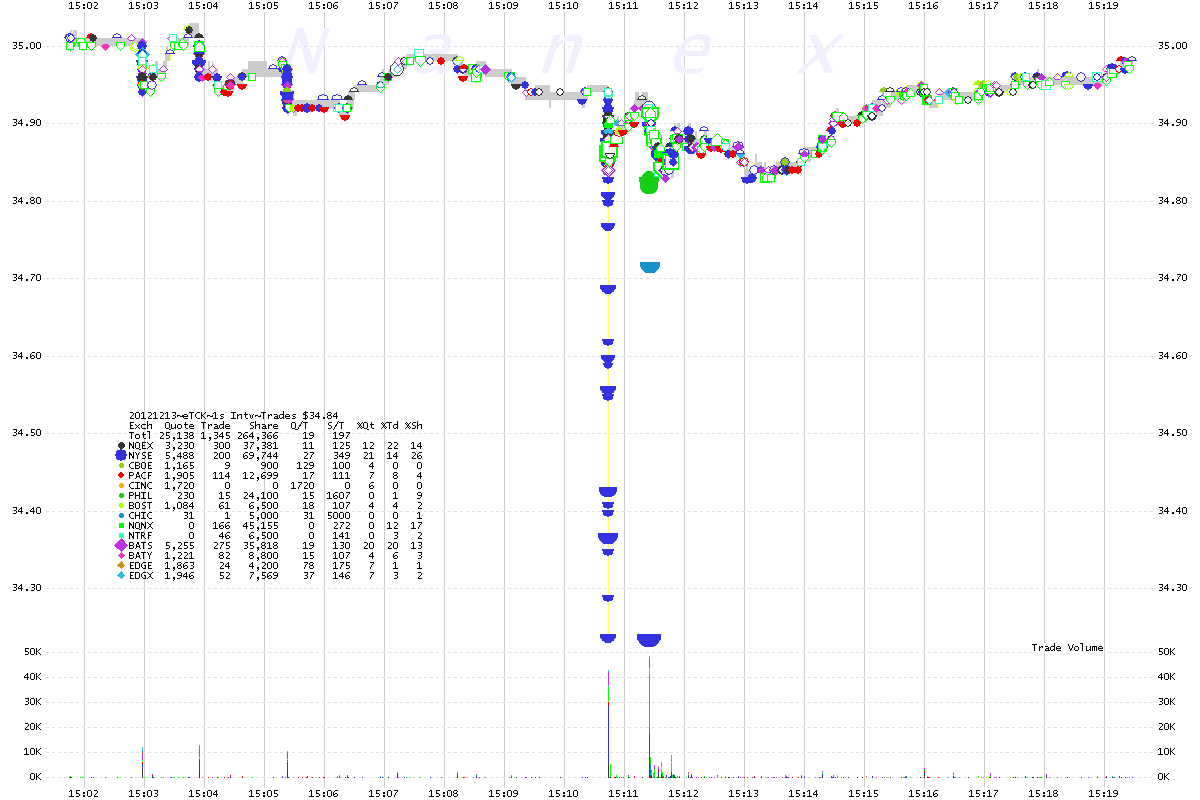
We've seen more market breakdowns involving NYSE or NY-ARCA recently that have similar patterns. Just a few examples from the last 2 days (December 12 and 13, 2012)
1. EQT - 1 second interval chart showing trades color coded by exchange.
2. X - 1 second interval chart showing trades color coded by exchange.
3. KMI - 1 second interval chart showing trades color coded by exchange.
4. TCK - 1 second interval chart showing trades color coded by exchange.
5. GEF - 1 second interval chart showing trades color coded by exchange.
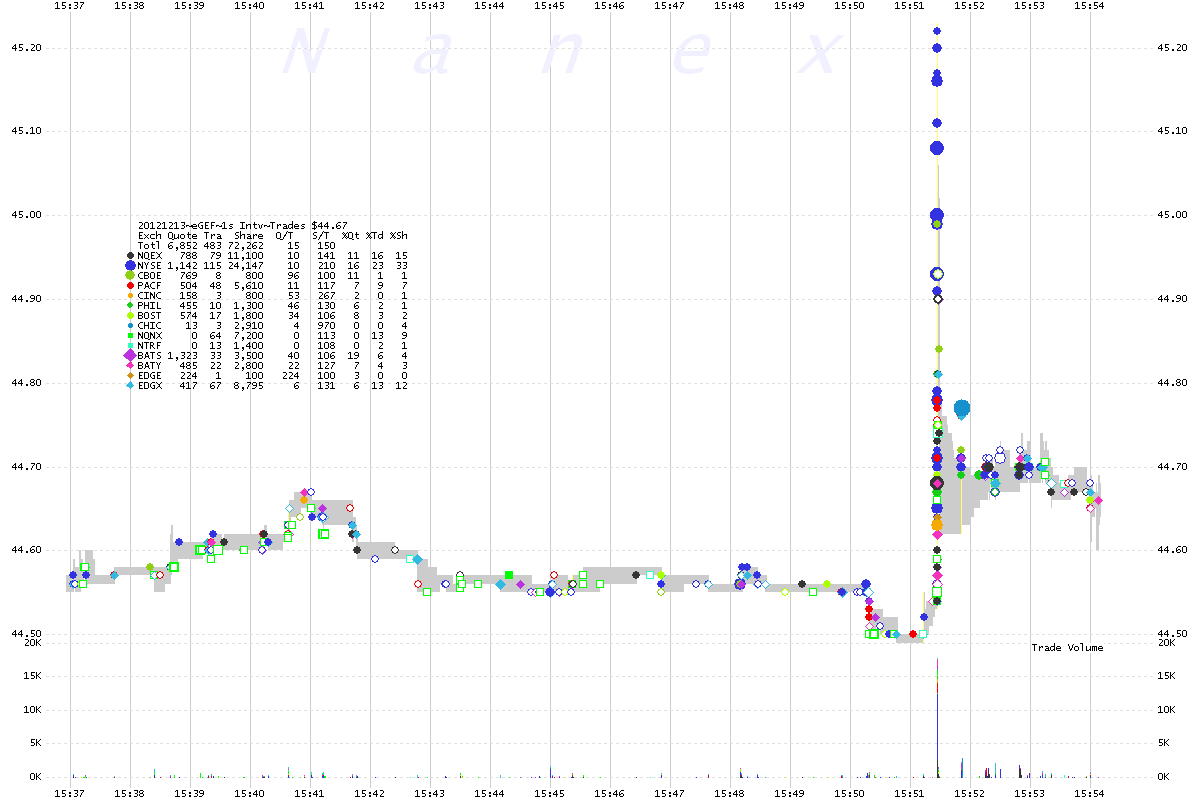
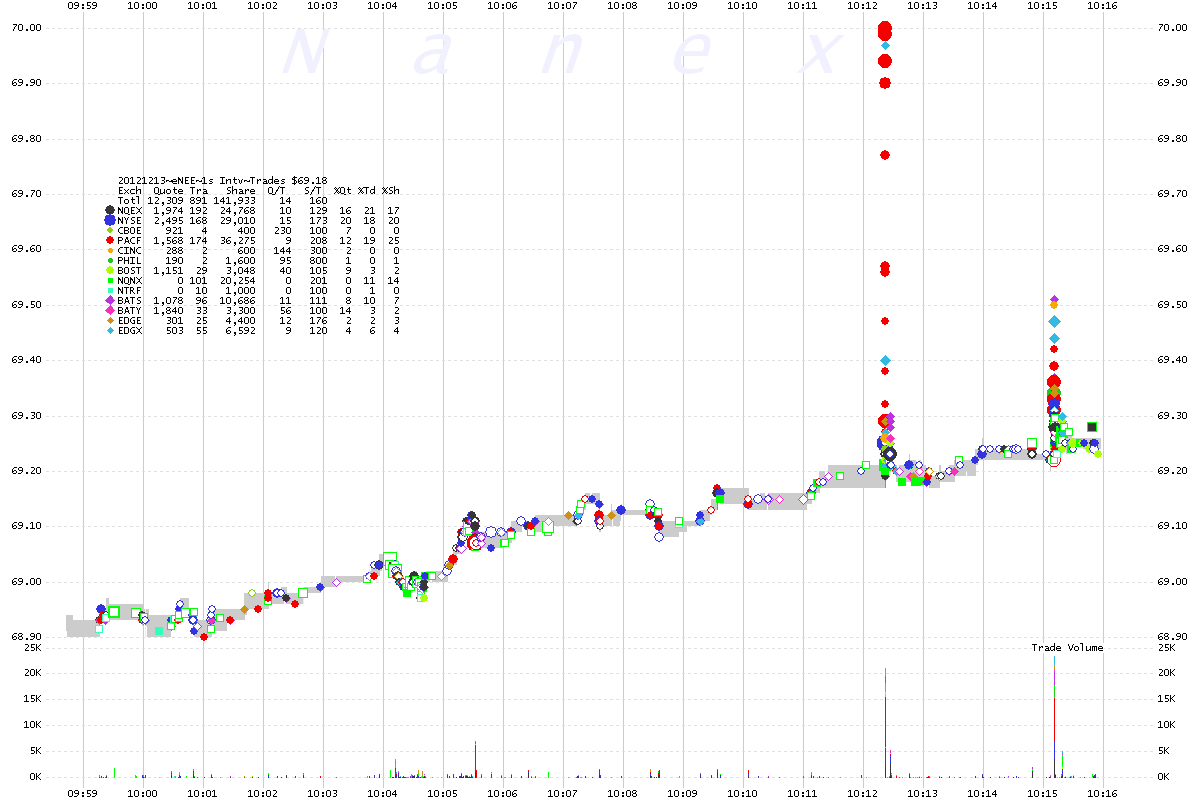
6. NEE - 1 second interval chart showing trades color coded by exchange.
Nanex Research
Inquiries: pr@nanex.net


