Nanex Research

Nanex ~ 17-Dec-2012 ~ CAC-40 and SMI Futures Oscillation
It looks like an algo went haywire in the December 2012 CAC-40 Futures Contract (FCE.Z12),
and simultaneously in the December 2012 SMI Futures contract. The
CAC-40 is a major French stock market index, and the
SMI is Switzerland's blue-chip stock market index.
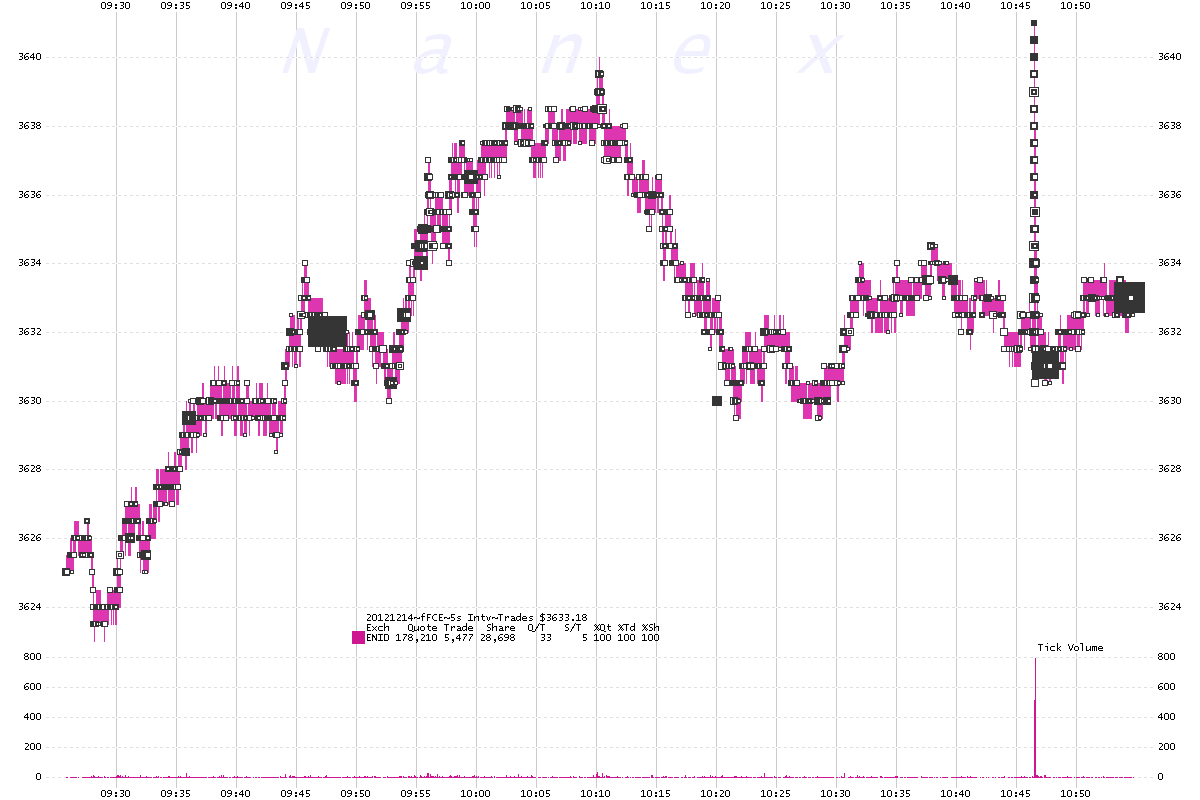
1. FCE.Z12 - 5 second interval chart showing trades (squares) and quote
spread (pink shading). Chart shows about 1.5 hours of time.
The spike on the right is the anomaly.
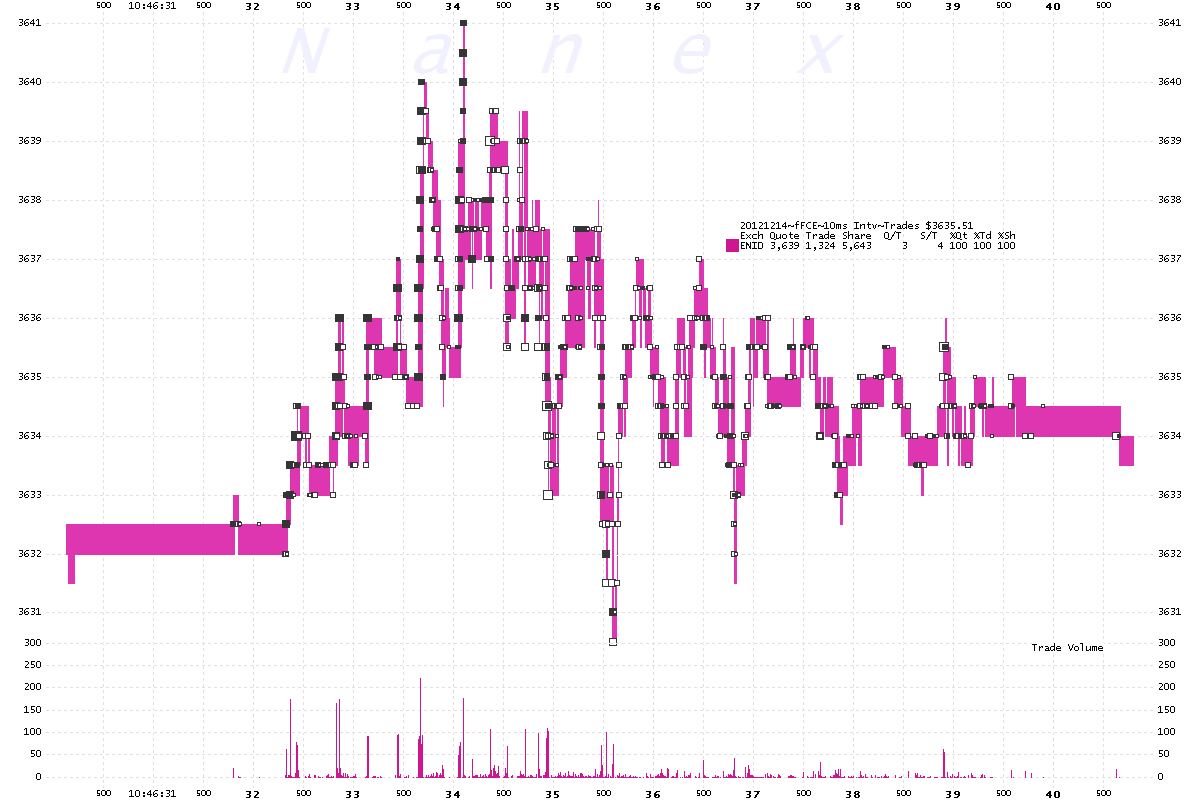
2. FCE.Z12 - Zoom of chart above. Showing about 9 seconds of time.
Note the wild oscillations.
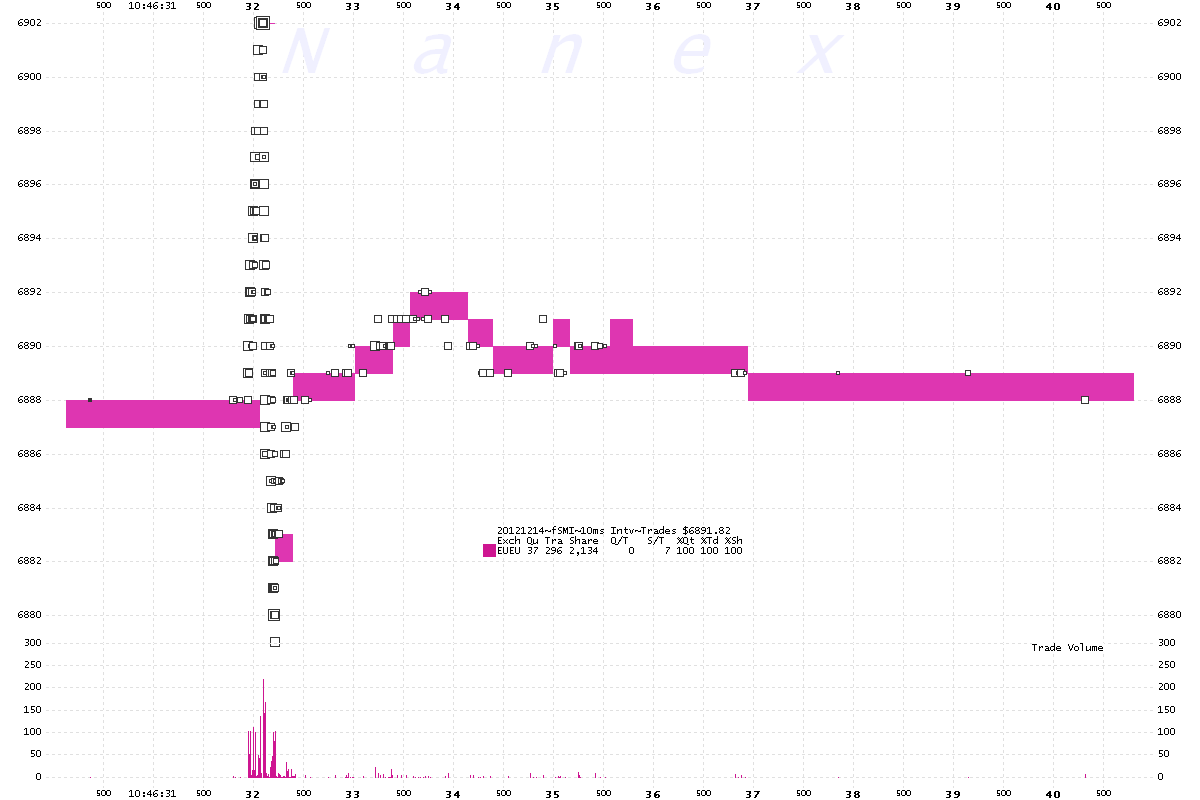
3. SMI.Z12 - Same time frame as chart above. Showing about 9 seconds of time.
Note the wild oscillations.
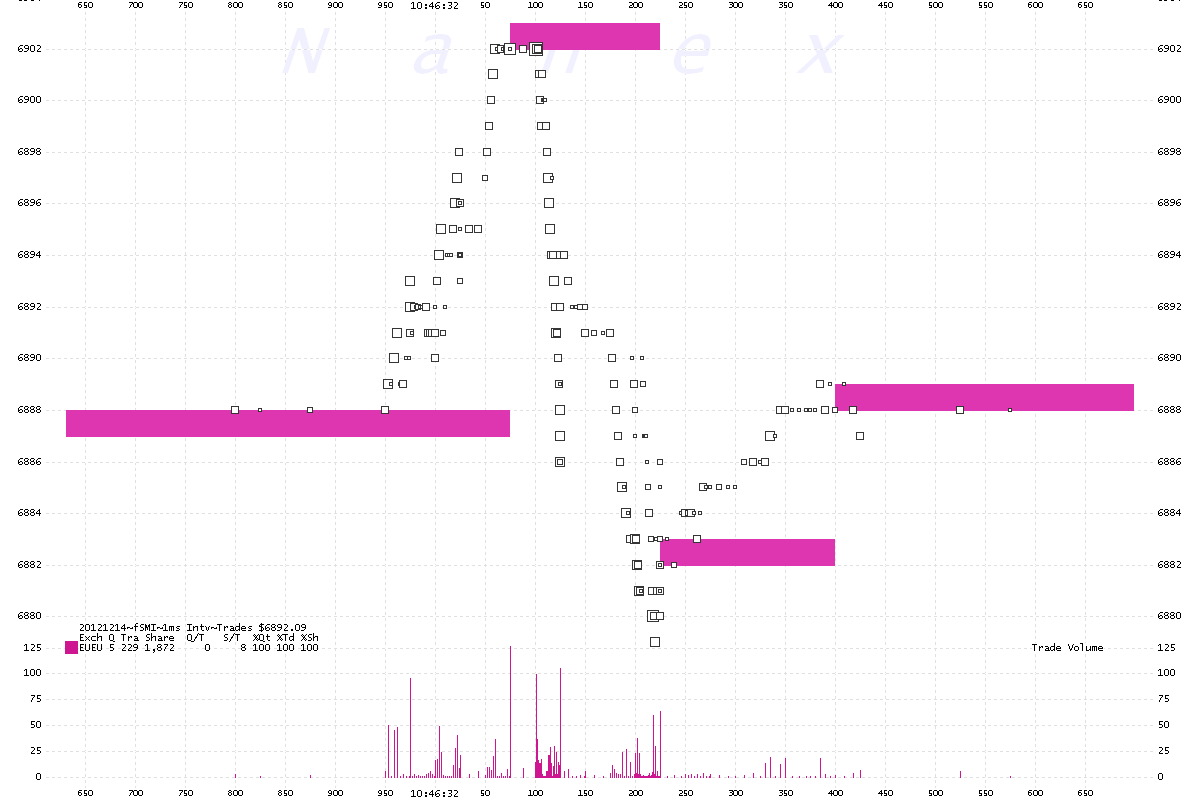
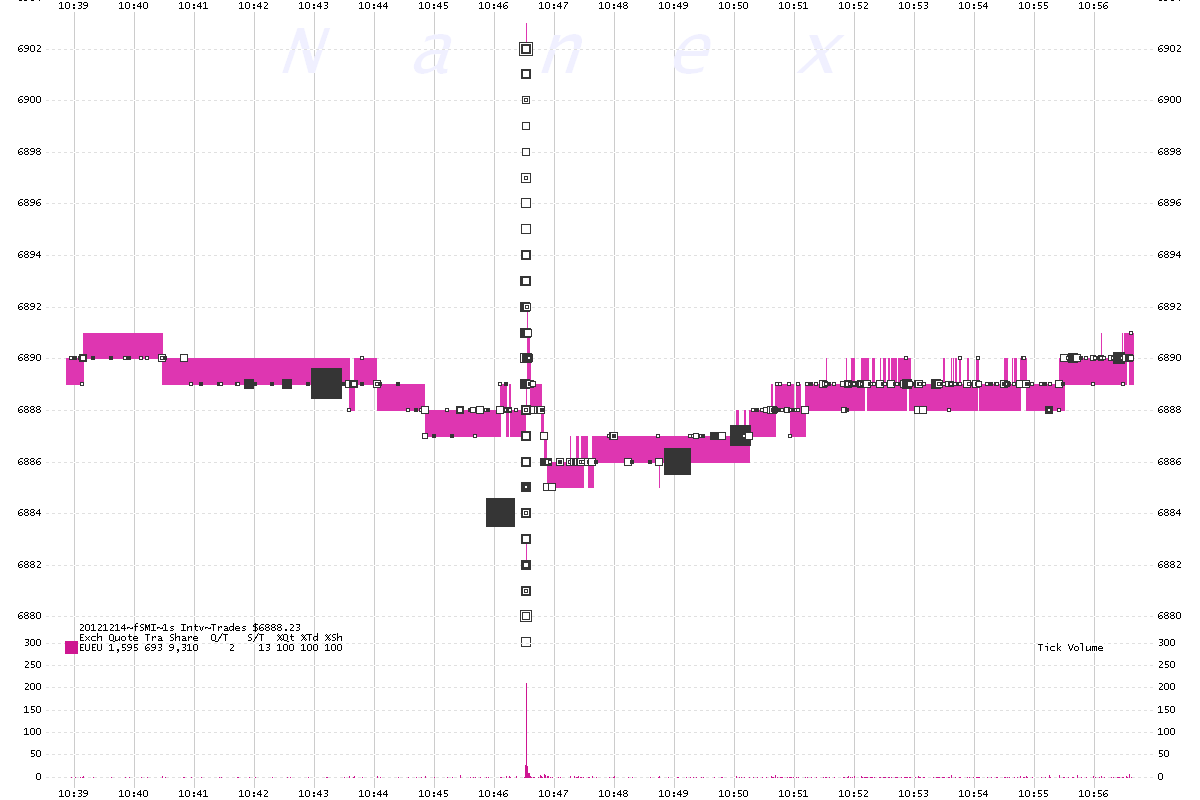
4. SMI.Z12 - Zooming down to 1 second of data.
5. SMI.Z12 - Zoomed out from chart above. Showing about 17 minutes of time.
The spike in the middle is the event.
Nanex Research
Inquiries: pr@nanex.net


