Nanex Research

Nanex ~ 17-Dec-2012 ~ Apple and Google's Last Second
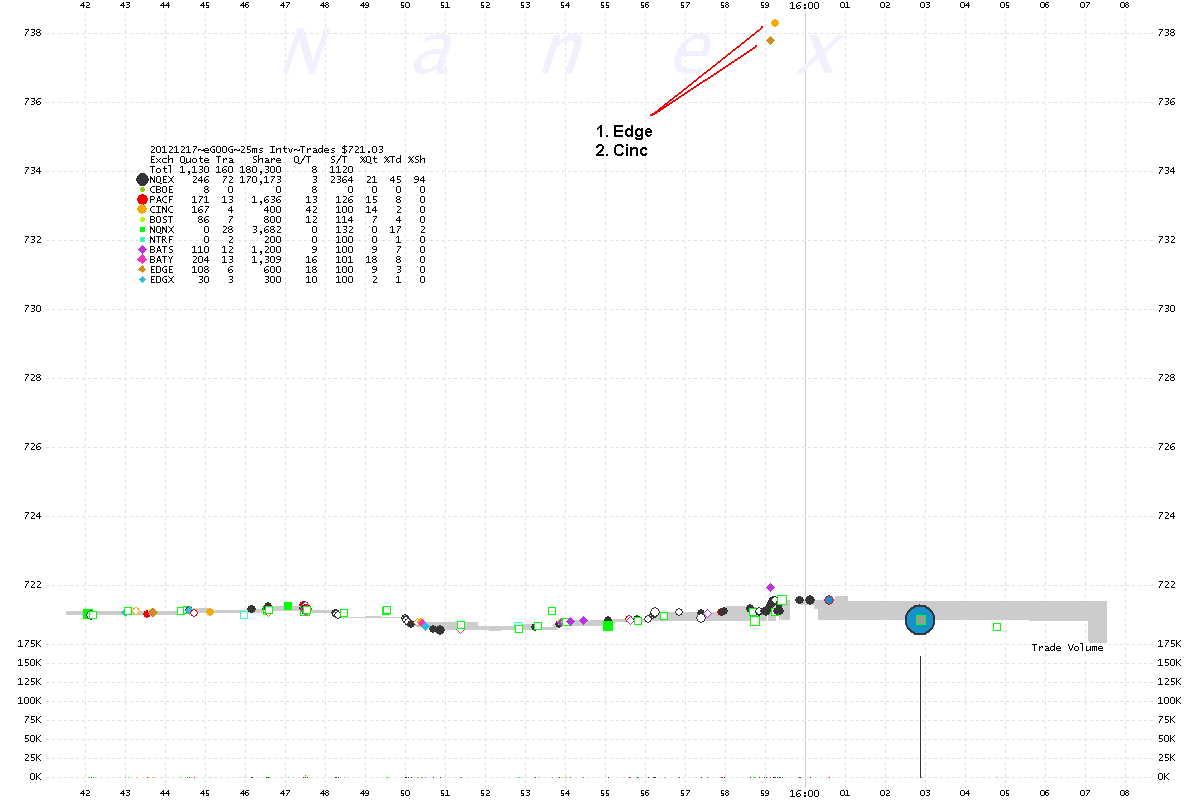
With less than a second before market close (16:00 EST) on December 17, 2012, curious
trades appeared in Google and Apple that were far away from the last sale prices that
printed milliseconds
earlier. Google had 2 trades, $737.77 and $738.28 which were $15.85 (2.1%) and $16.72
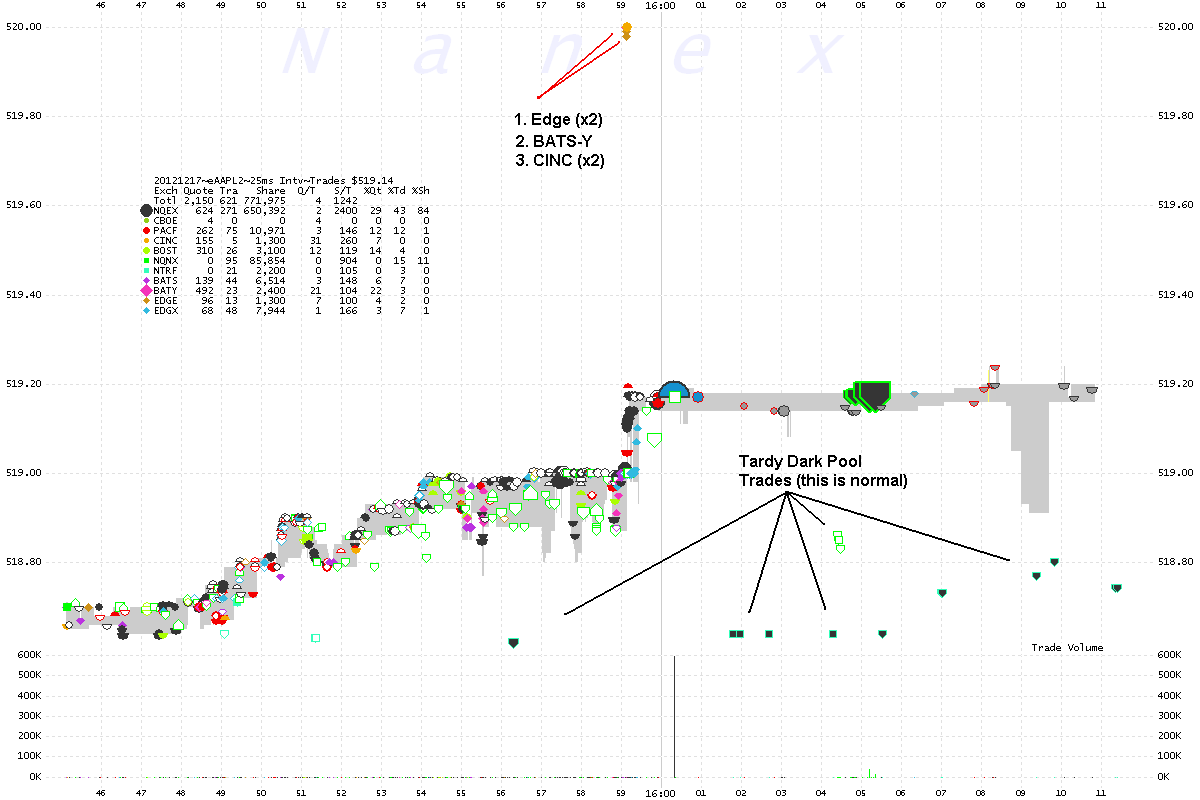
(2.3%) above the previous sale. Apple had 5 trades, $519.99, $519.98,
and 3 at $520.00 all about $1.00 above the previous sale. All of these trades were marked
ISO, which means they were used by a professional who wanted those prices and did not
want the exchange to route to another exchange regardless if it had a better price.
In both stocks, the first wild price executed at EDGE and the last wild price at CINC
(National
Stock Exchange or NSX). We matched these wild prices to prevailing
ask prices from those exchanges at the time. From the data, it appears these trades
were intentional, that is, the buyer wanted to execute at those prices and knew what
they were doing.
1. GOOG - 25 millisecond interval chart showing trades color coded by exchange.

2. AAPL 25 millisecond interval chart showing trades color coded by exchange.
Note: You can barely see the BATS-Y trade (pink) hiding behind the golden dot.

Nanex Research
Inquiries: pr@nanex.net


