Nanex Research

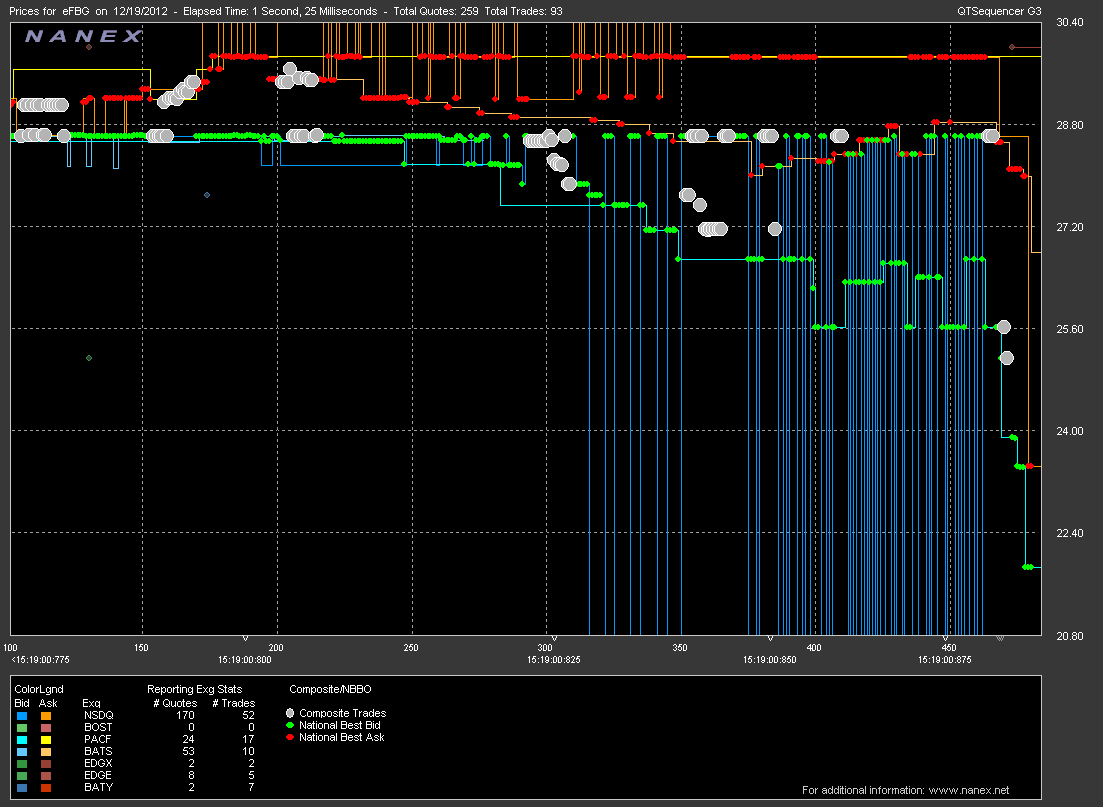
Nanex ~ 19-Dec-2012 ~ FBG Crash
<<< Boom>>>
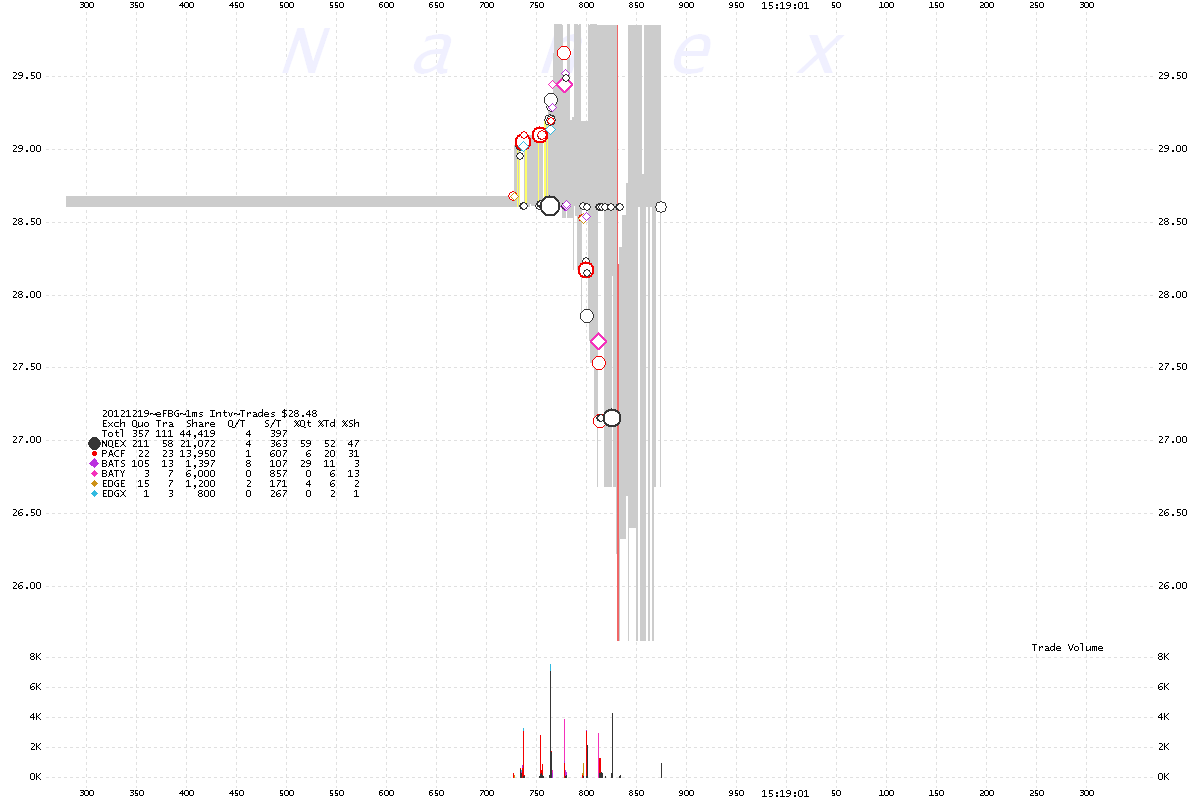
Note the odd trading just before (chart 3)
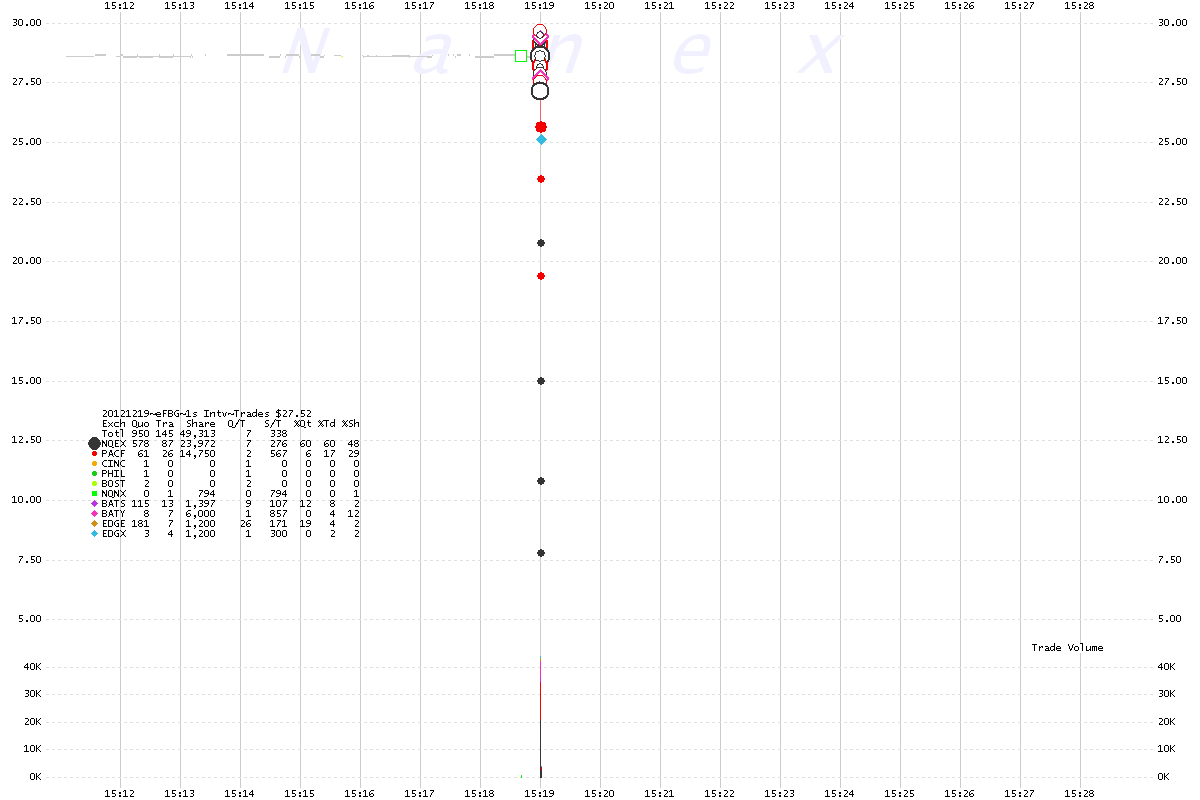
1. FBG - 1 second interval chart showing trades color coded by exchange.
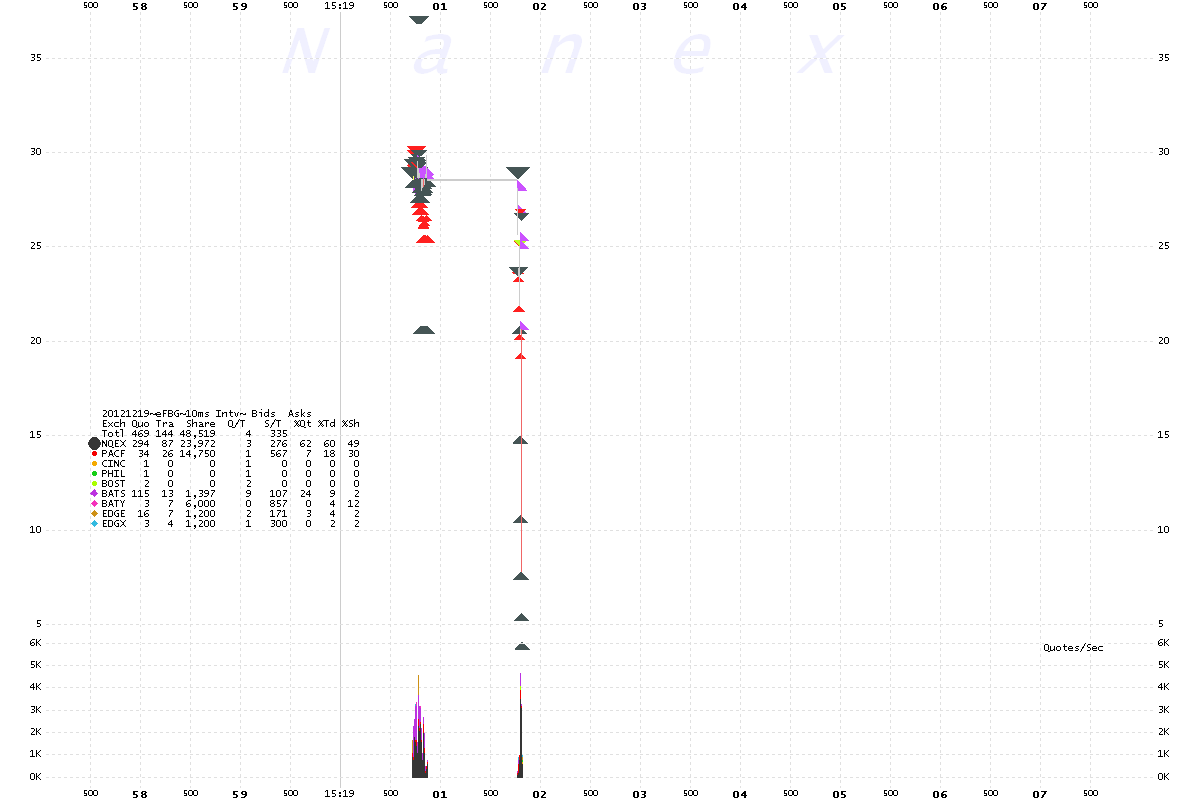
2. FBG - 10 millisecond interval chart showing bids and asks color coded by exchange.
3. FBG - 1 millsecond interval chart showing trades color coded by exchange.
Odd - note the ping-pong trading just before the price dropped.
4. FBG - tick chart.
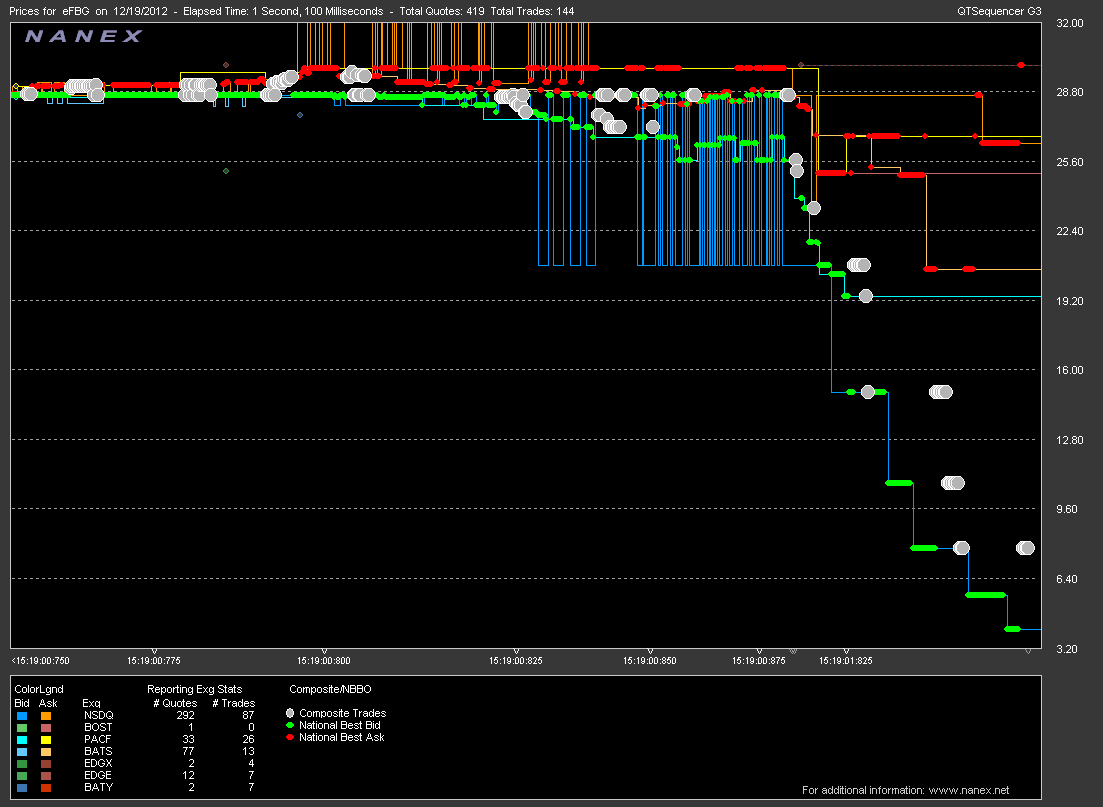
5. FBG - tick chart (zoom).
Nanex Research
Inquiries: pr@nanex.net


