Nanex Research

Nanex ~ 31-Dec-2012 ~ XOM 100,000 Share Mistake?
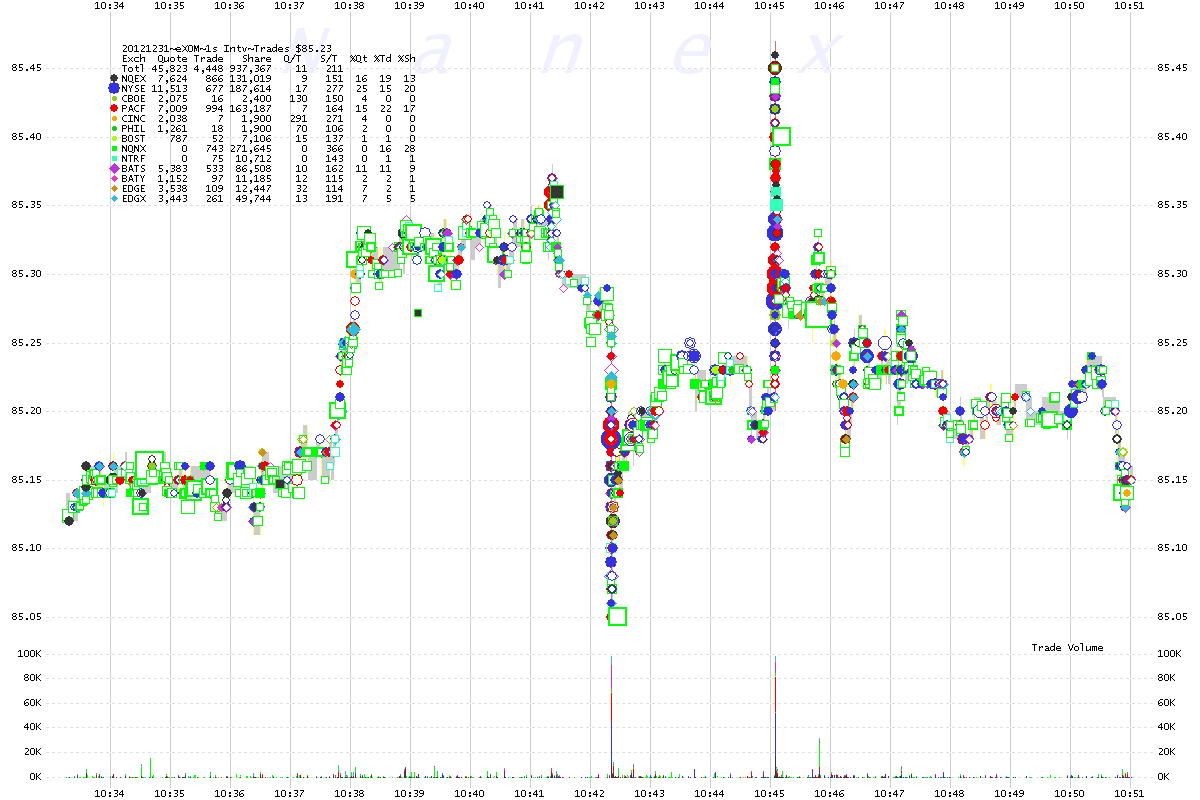
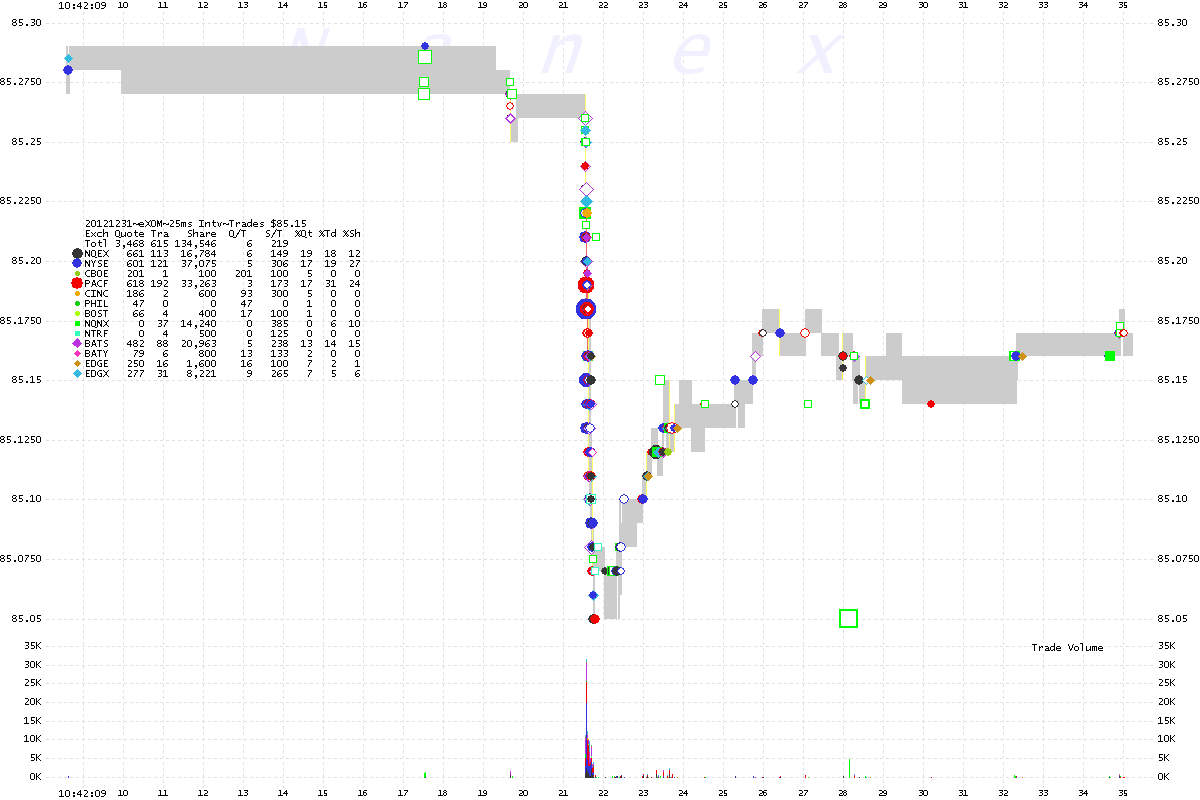
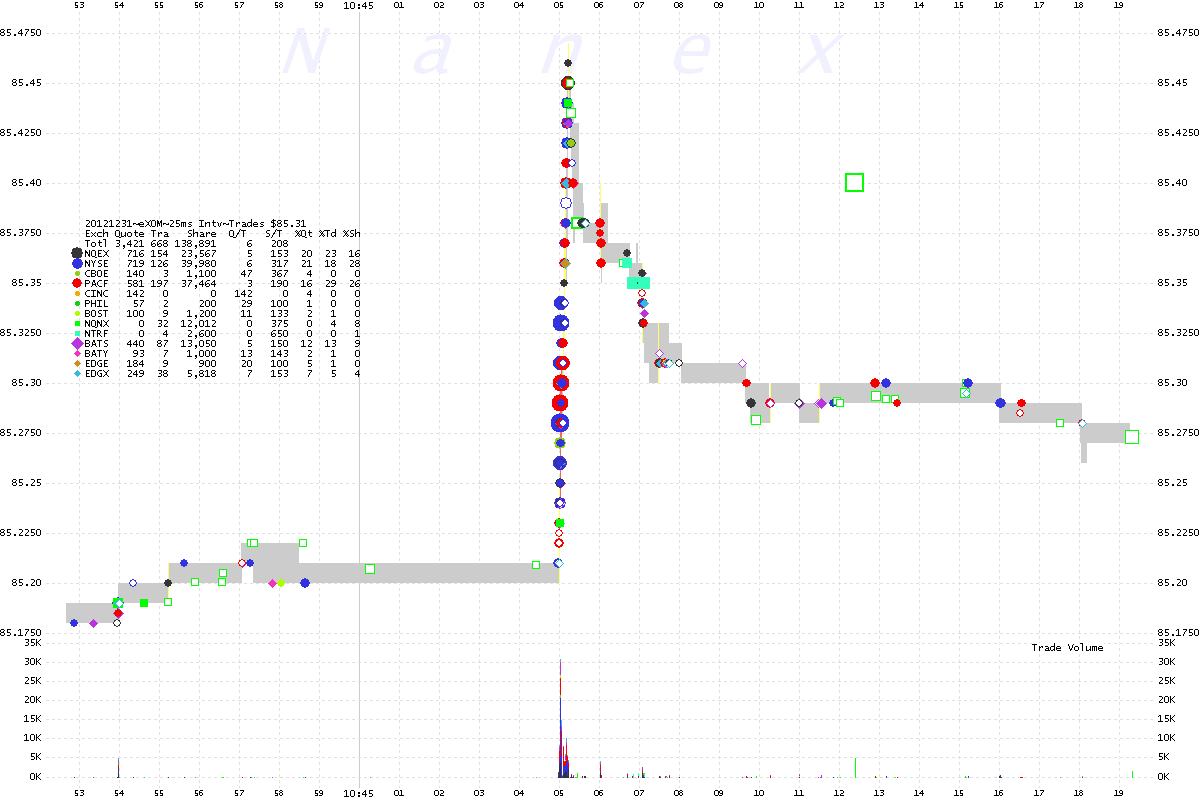
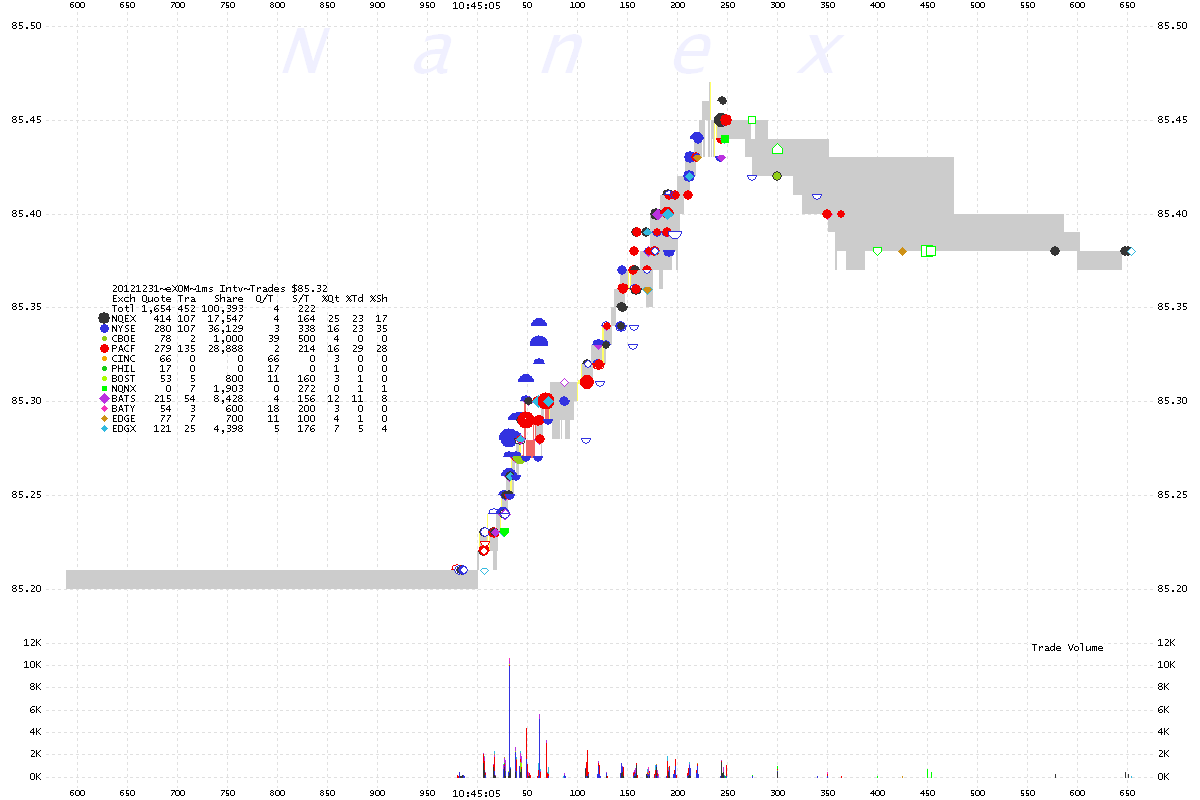
On December 31, 2012 at 10:42:21, the stock of Exxon Mobil Corporation Inc. (symbol XOM) suddenly dropped 0.24 on about 100,000 shares. 3 minutes later, it suddenly rose
0.26 on about 100,000 shares. And expensive lesson (~$16,000) if it was a mistake.
1. XOM - 1 second interval chart showing trades color coded by exchange.
Note the drop just after 10:42, and rally at 10:45.
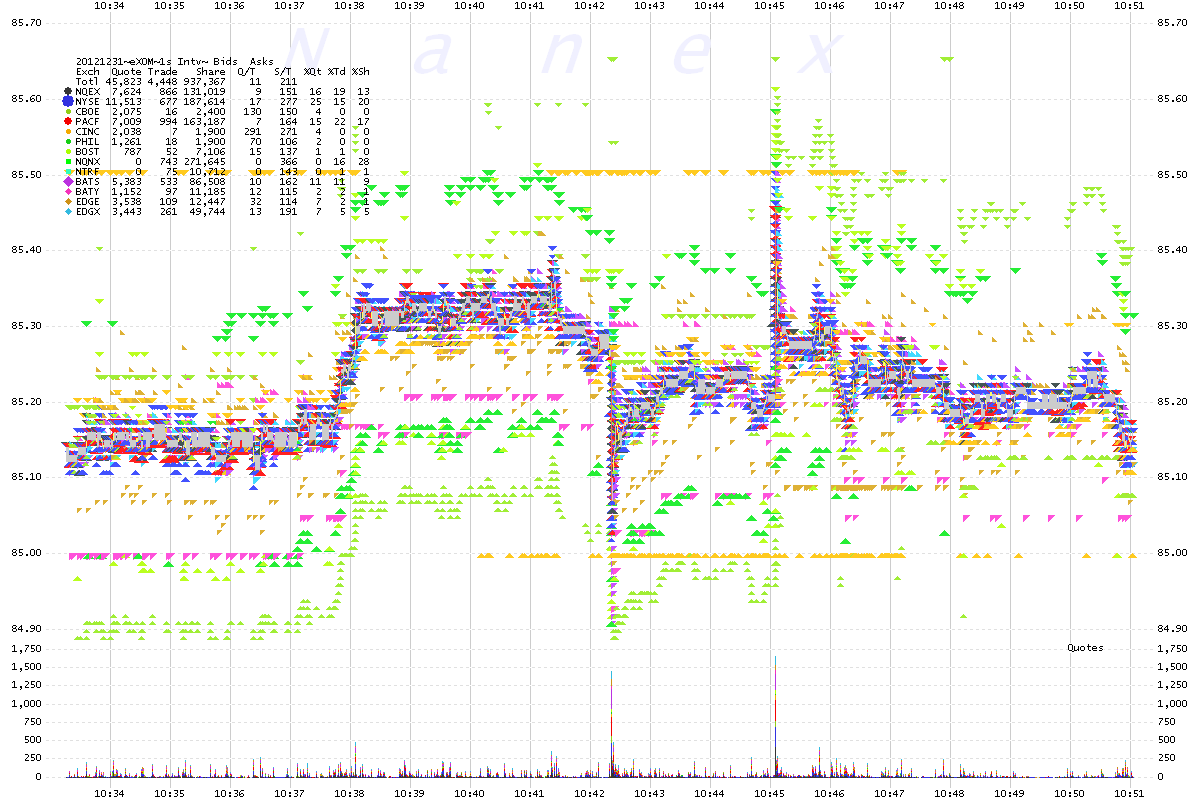
2. XOM - 1 second interval chart showing bids and asks color coded by exchange.
Quotes everywhere.
3. XOM - 25 millisecond interval chart showing trades color coded by exchange.
The Drop.
4. XOM - 25 millisecond interval chart showing trades color coded by exchange.
The Rally.
5. XOM - 1 millisecond interval chart showing trades color coded by exchange.
The Drop - involves about 100,000 shares.
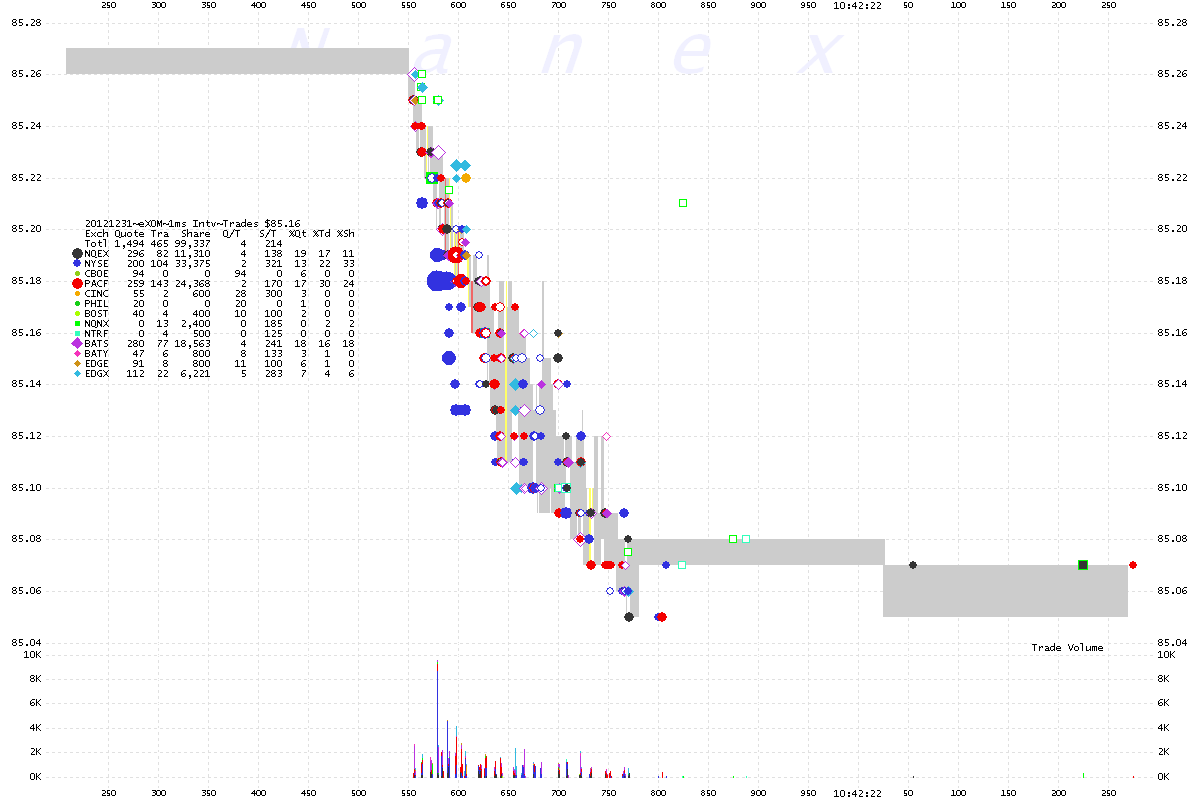
6. XOM - 1 millisecond interval chart showing trades color coded by exchange.
The Rally involves about 100,000 shares.
Nanex Research
Inquiries: pr@nanex.net


