Nanex Research

Nanex ~ 01-Jan-2013 ~ Natural Gas Rings in the New Year
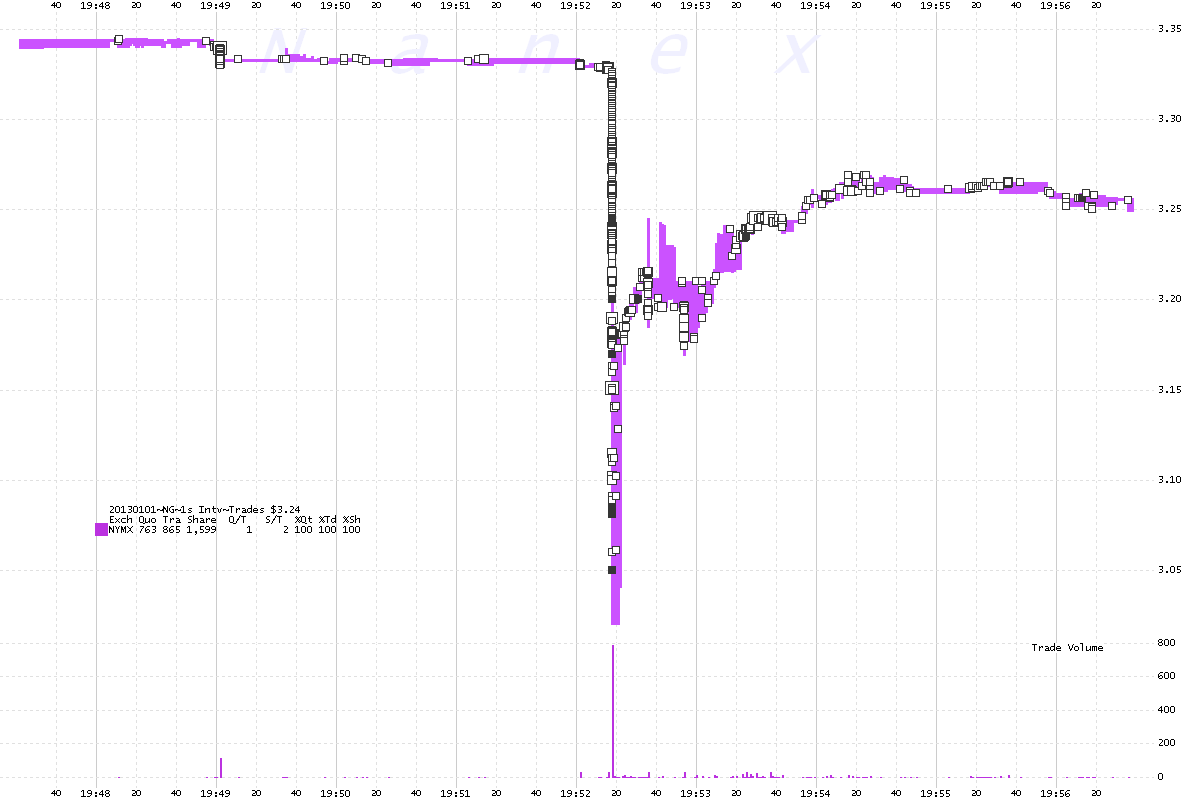
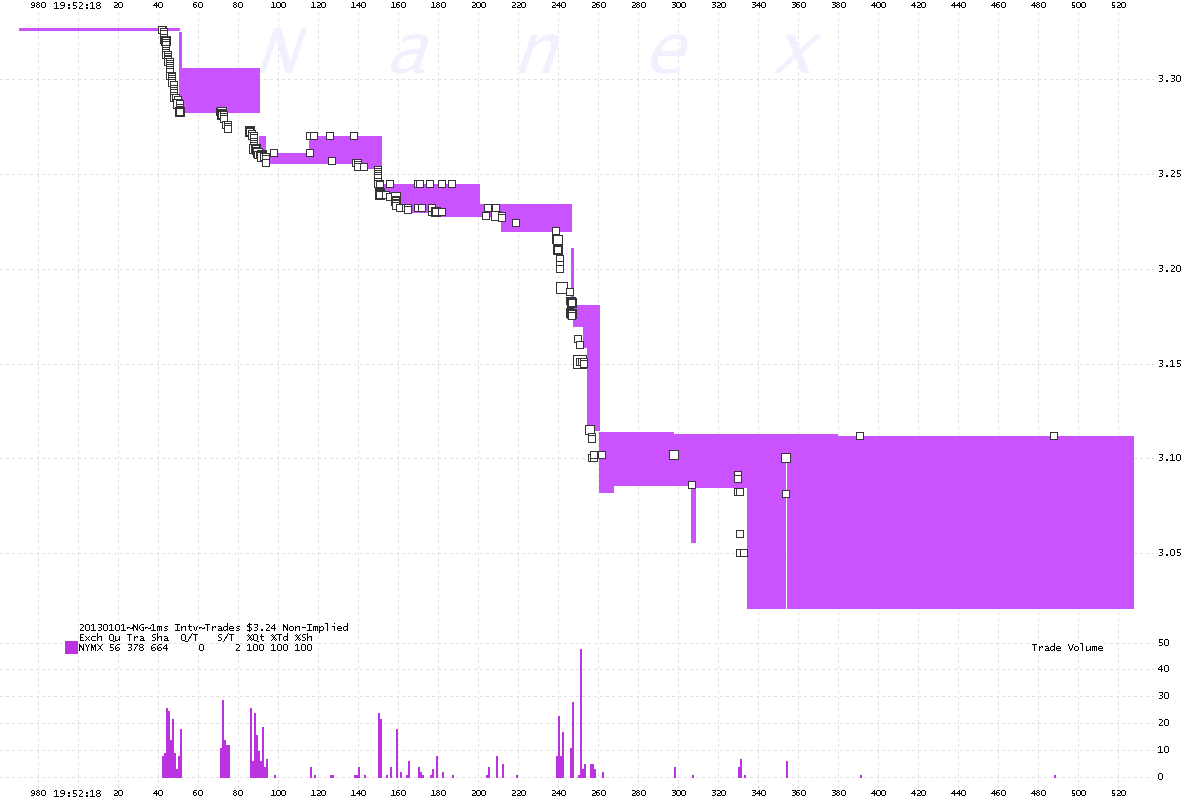
On January 1, 2013 at 19:52:18, the February 2013 Natural Gas Futures contract dropped
8.3% (3.326 to 3.050) in about 1/3 of a second, driven down by a sale of about 600 contracts.
1. NG.G13 - 1 second interval chart showing trades and quote spread.
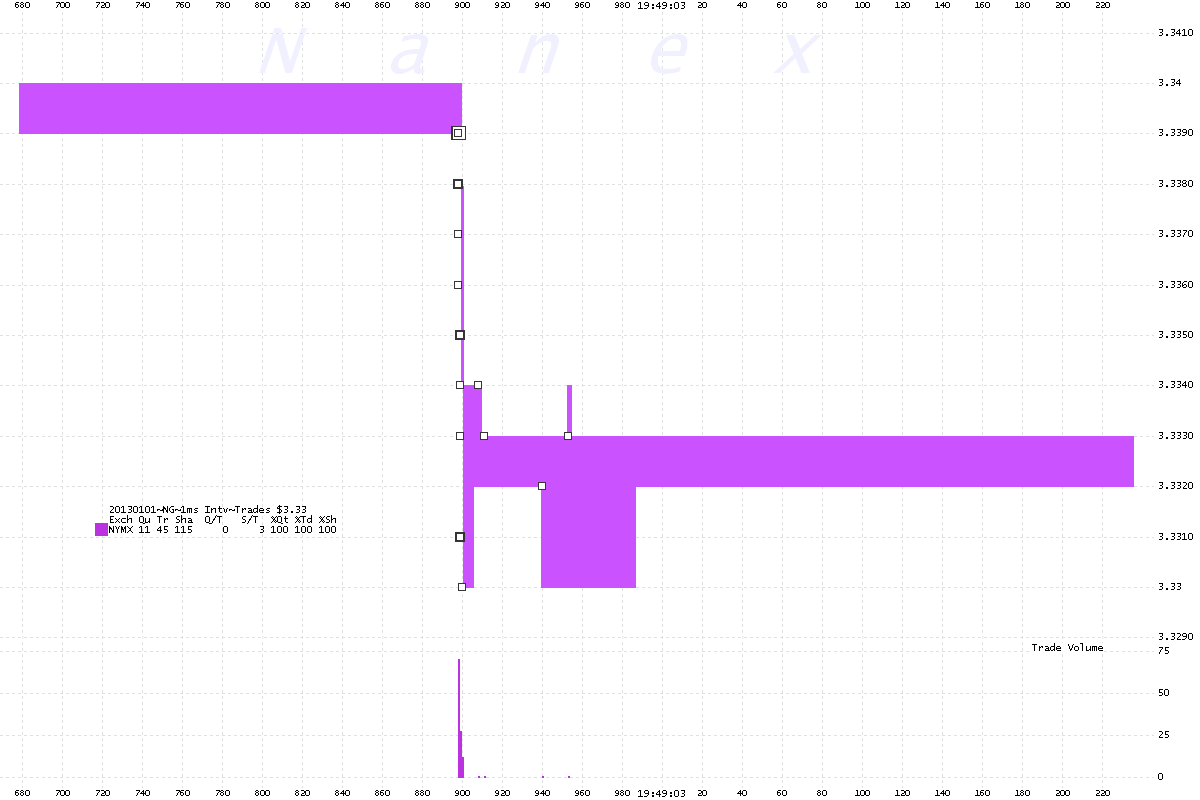
There was a smaller drop at 19:49:03 before the big drop at 19:52:18
2. NG.G13 - 1 millisecond interval chart showing trades and quote spread. Chart
shows about 1/2 second of time.
This is the first drop that came about 3 minutes before the big drop.
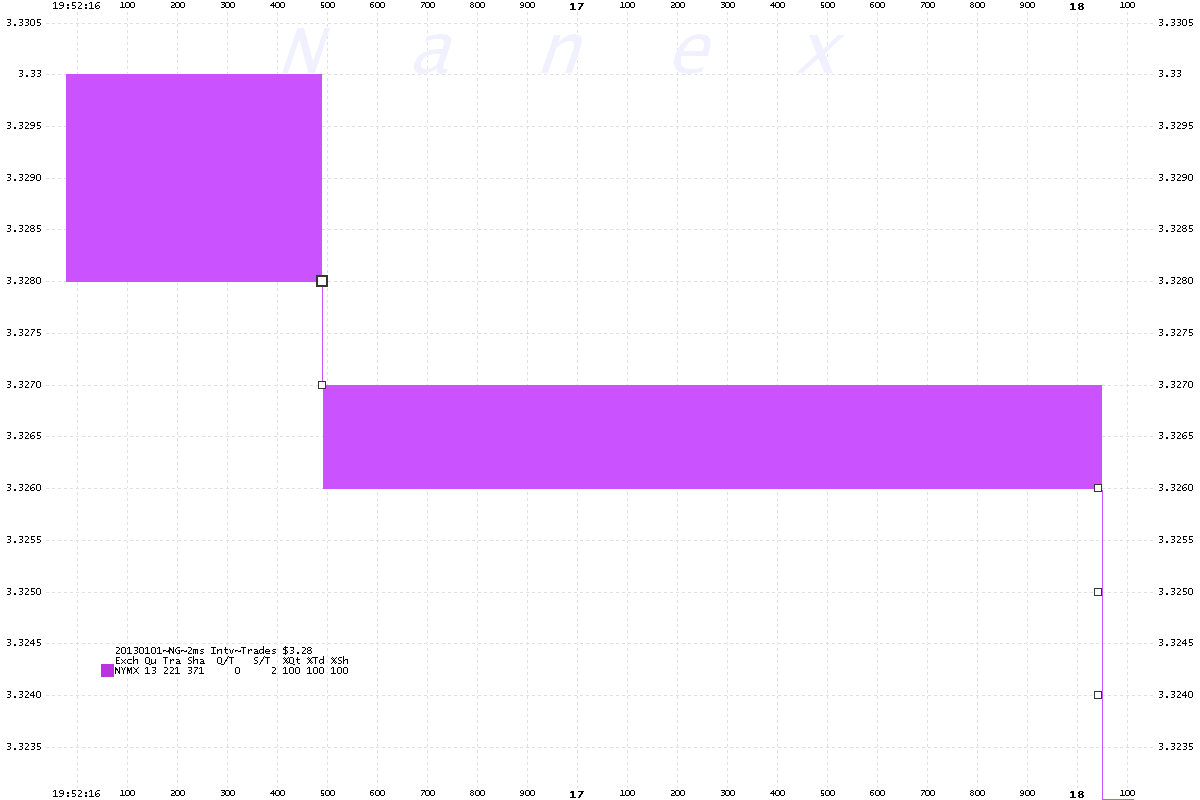
3. NG.G13 - 2 millisecond interval chart showing trades and quote spread. Chart
shows about 2 seconds of time.
Zooming in right before the big drop.
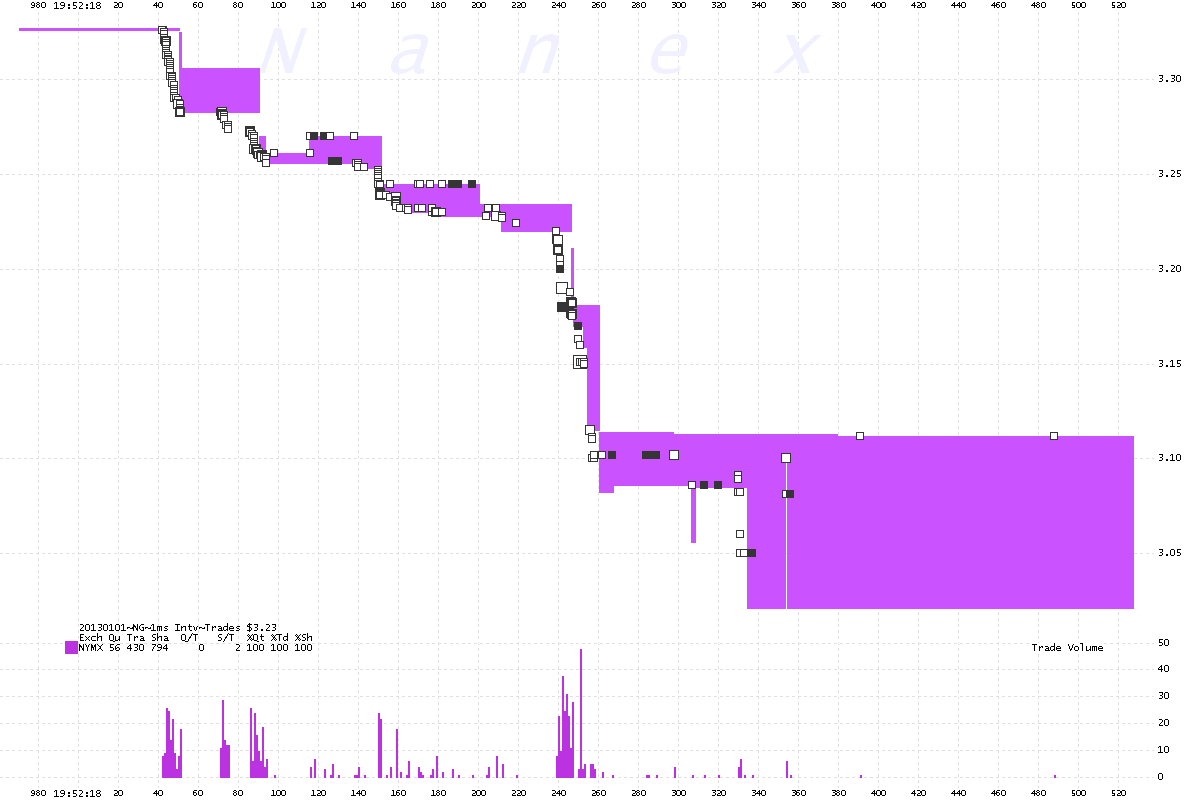
4. NG.G13 - 1 millisecond interval chart showing trades and quote spread. Chart
shows about 1/2 second of time.
Top to bottom in about 1/3 second. Note there was some buying along the way.
5. NG.G13 - 1 millisecond interval chart showing trades and quote spread. Chart
shows about 1/2 second of time.
Removing trades with the "Implied" condition (from spreads)
Nanex Research
Inquiries: pr@nanex.net


