Nanex ~ 31-Dec-2012 ~ Record Activity, Lowest Liquidity
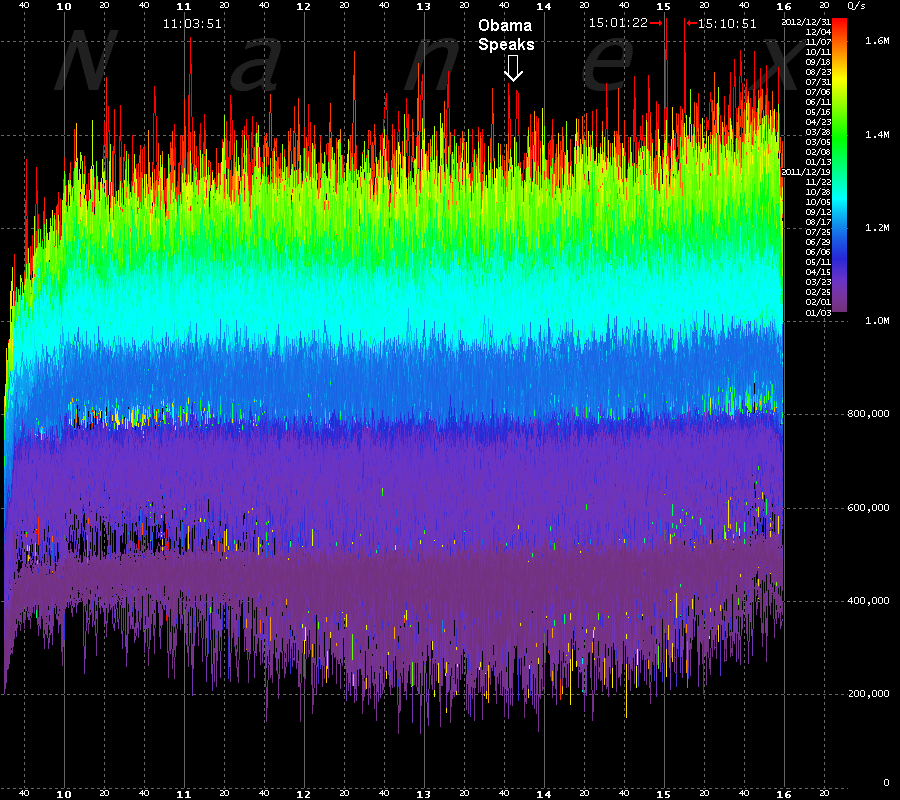
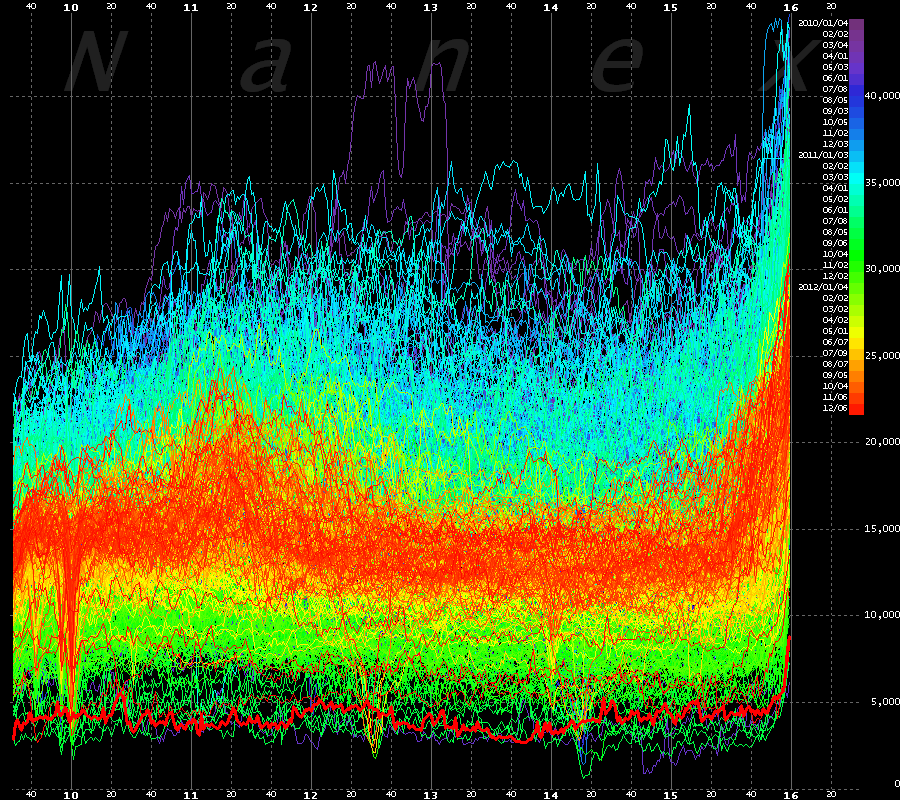
Our eMini Depth of Book indicator has proven to be an excellent early warning signal for extreme intraday volatility. It is based on the number of orders resting in the nearest 10 levels of depth for the active Electronic S&P 500 Futures Contract (symbol ES), also referred to as the "eMini".On December 31, 2012, the depth of book sunk to its lowest levels since January 2010. Not coincidentally, we also saw a record high number of quotes on CQS - the consolidated quote feed for NYSE, NY-ARCA and NY-AMEX equities. This is because a few hundred emini contracts bought or sold immediately, will clear out many levels of the order book, causing an explosion of quotes and trades as the entire market adjusts to the new price level.
Note that the $VIX index also sunk, nearing 52-week lows on the same date.
See also: HFT is Killing the EMini and High Frequency Quote Spam.


Inquiries: pr@nanex.net