Nanex Research

Nanex ~ 15-Jan-2013 ~ Stock Manipulation is Alive and Well
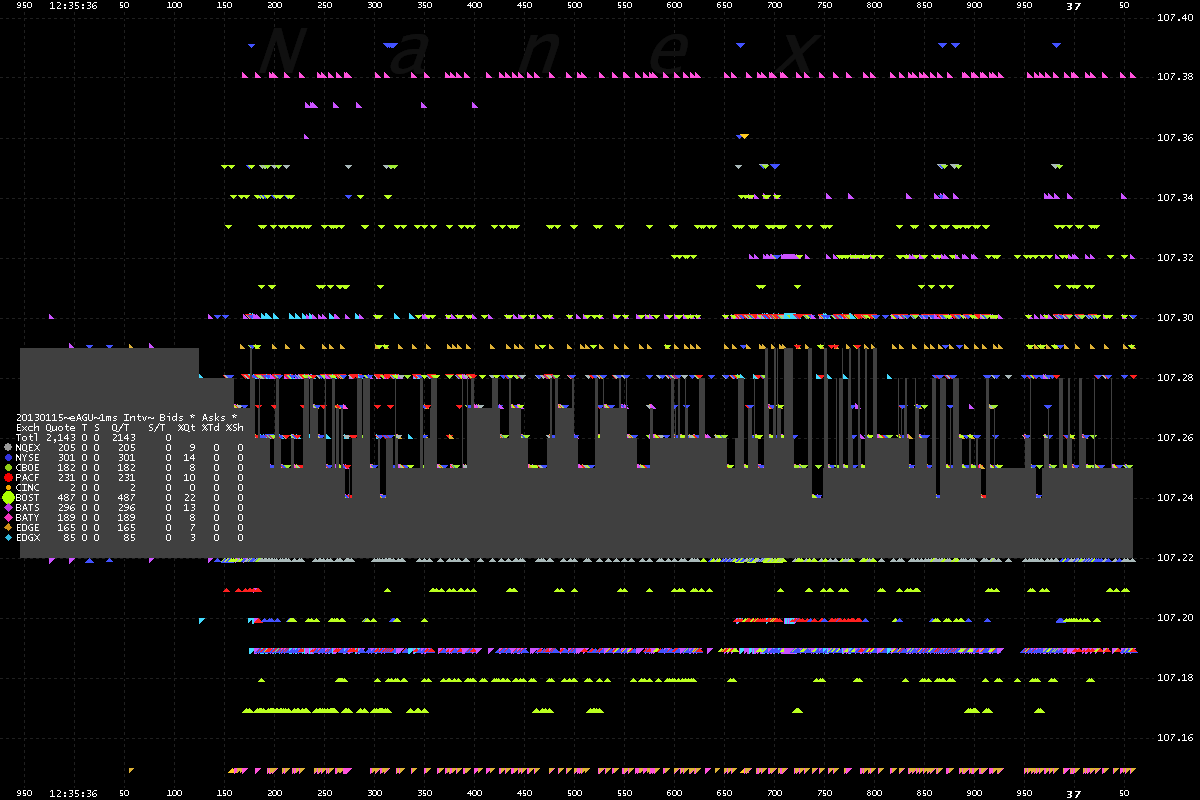
Take a close look at the first chart below: it shows bids and asks for 1 second of time
in the stock of Agrium Inc (symbol AGU, market cap $16 billion) on January 15,
2013 at 12:35:36. Each colored triangle represents at least one order that was placed
and almost immediately canceled. Triangles pointing up are bids, and those pointing
down are asks. The dark shading in middle is the NBBO (National Best Bid/Offer): it
represents the highest bid and lowest offer from the 10 exchanges submitting quotes
in this stock. Note how many times it changed in this one second. The NBBO spread
(difference between the ask and bid) ranges from 2 cents to 7 cents, and changes over
100 times in this one second. An investor looking to buy or sell this stock may get
any one of 7 different prices - and that is if they are lucky and get filled at the
NBBO. There were no trades executed in this time period.
That's right, not a single one of
these 2,143 bids and asks resulted in a trade.
According to Reg NMS, and recent rulings by the
SEC and
FINRA, placing orders with no intent of execution is illegal. But
examples like the one below occur thousands of times every trading day! It is also worth
noting that quotes are spread somewhat evenly across 8 of the 10 exchanges. Since each
exchange measures and observes only what is occurring on their local networks, this
type of behavior will elude their monitors and controls.
See also these two
pages for more charts showing manipulation on the same day.
1. AGU showing 1 second of bids and offers color coded by exchange. Dark gray shading is NBBO spread.

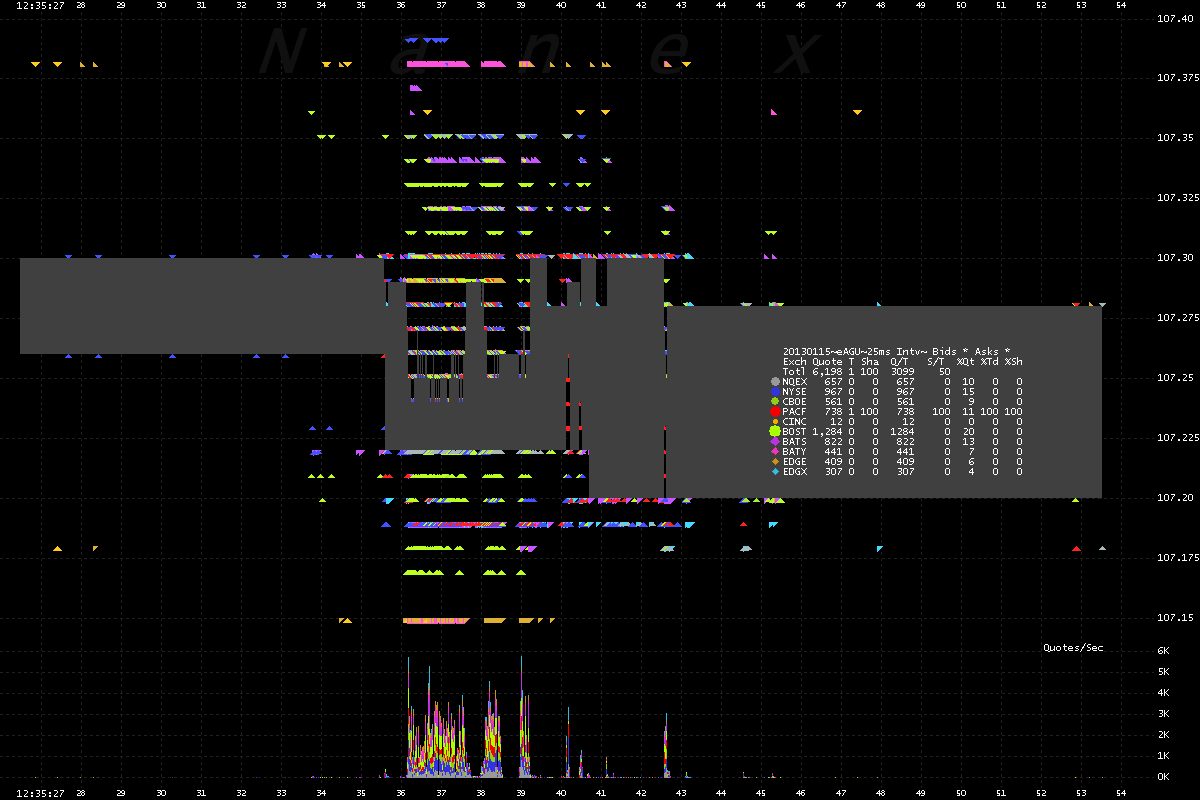
2. Zooming out to about 30 seconds of time.

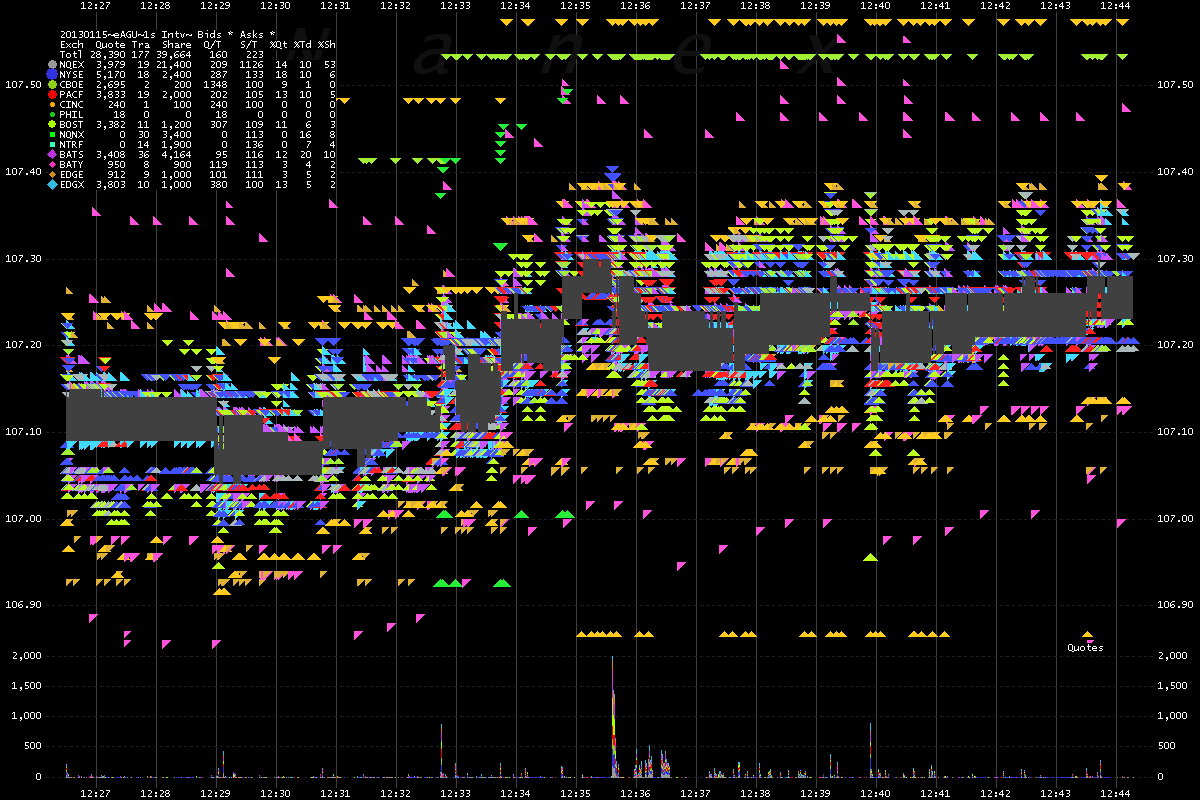
3. Zooming out to about 20 minutes of time.

Nanex Research
Inquiries: pr@nanex.net


