Nanex Research

Nanex ~ 26-Feb-2013 ~ Marked Market Shift
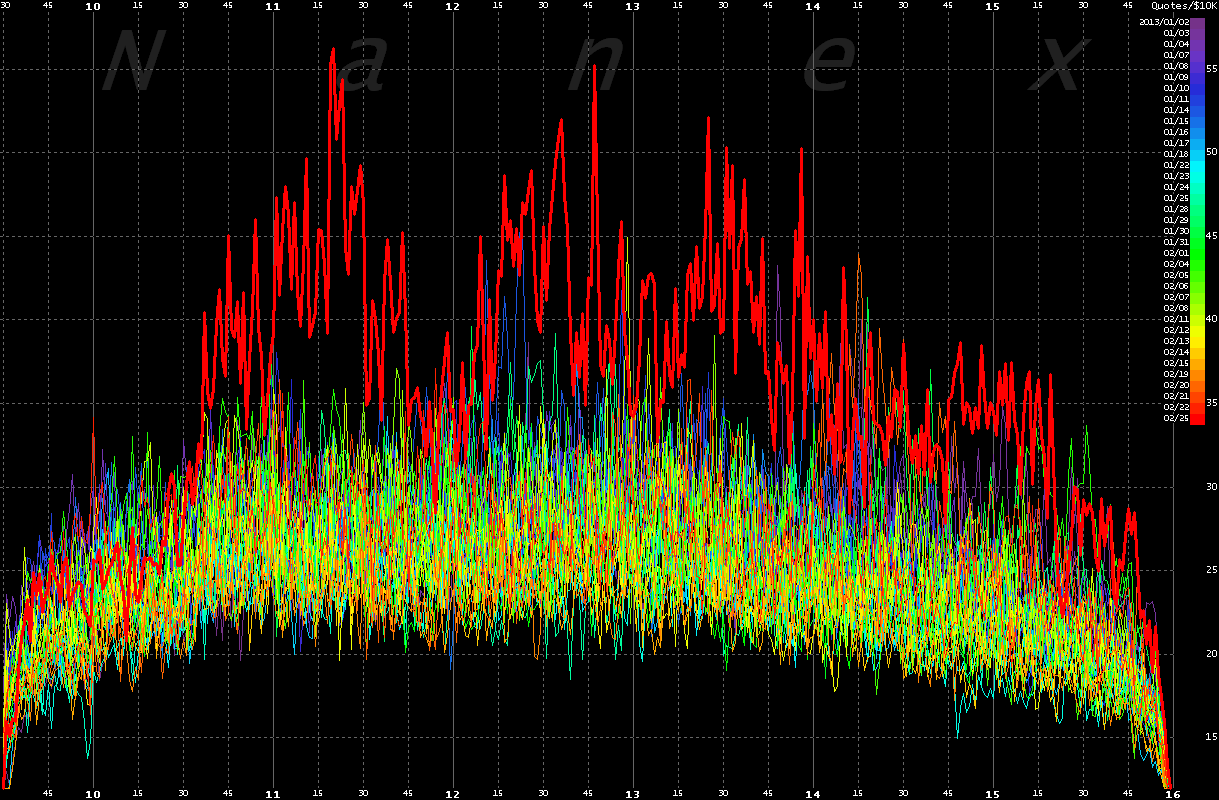
On February 25, 2013, starting around 10:35, the number of quotes relative to the number
of trades began surging and rocketed to levels not seen for several months. Although
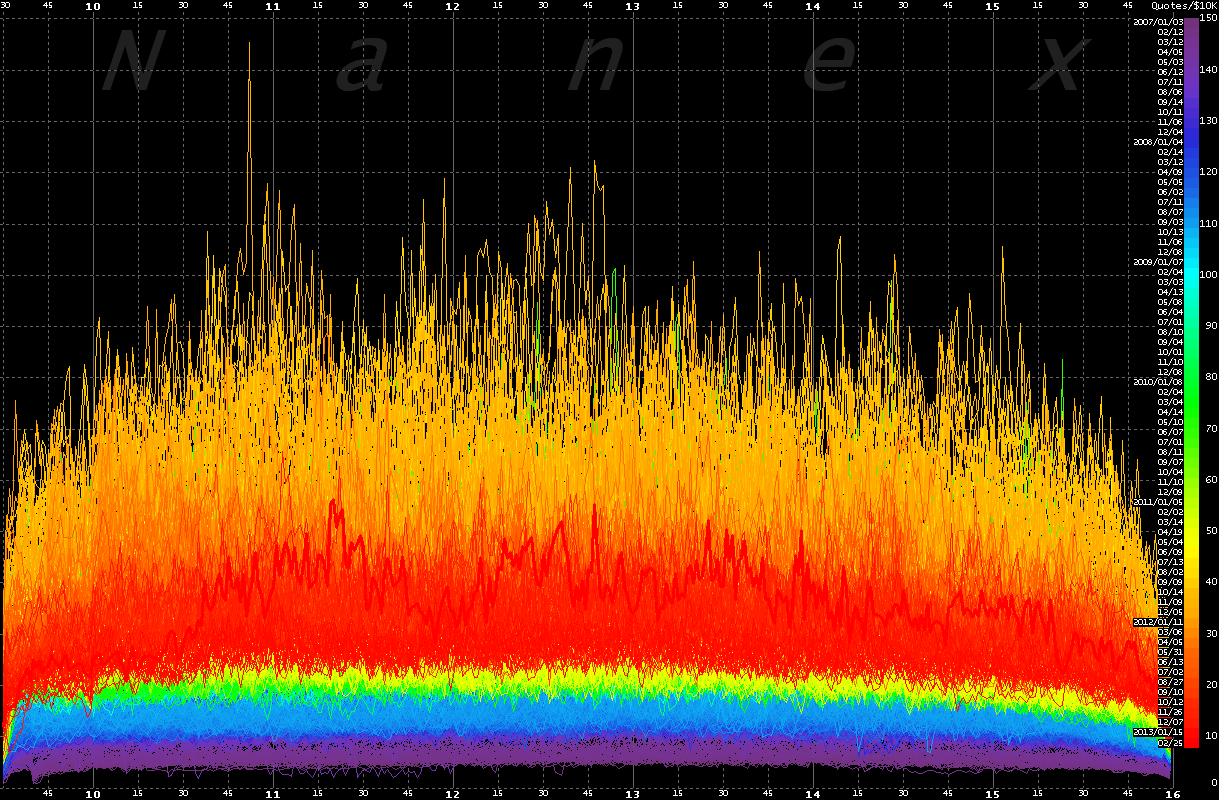
the levels have not come anywhere near the preposterous heights set back in August 2011
(when HFT reigned with impunity), the surge is enough to warrant extra attention. Charts
below plot the ratio of quotes to trade value (similar to Quotes/Trades but in way to
better compare the shifting lower transaction size since 2006). Each line shows the
one-minute average value for all NMS stocks (about 8,000) for each minute of one trading
day (9:30 to 16:00 ET), color coded by age: older dates towards the violet end of the
spectrum, while recent days are colored towards the red end. The thick red line is Feb
25, 2013: note the surge doesn't start until about 10:35.
A total of 764,962,237,673 quotes and 43,688,052,096 trades were processed to
create Chart 2.
1. Quotes per $10K of stock traded. One-minute average from Jan 2013 through Feb 25, 2013 for every minute of the trading day. Red line is Feb 25, 2013.
Things are normal until about 10:35am, when quote spamming surging.

2. Same as chart above, but showing from Jan 2007 through Feb 25, 2013
Excessive quote traffic has been on the decline. Though the surge on Feb 25th stood
out in stark contrast to recent trading, it is still way below the crazy days of August
2011, when HFT reigned with impunity.

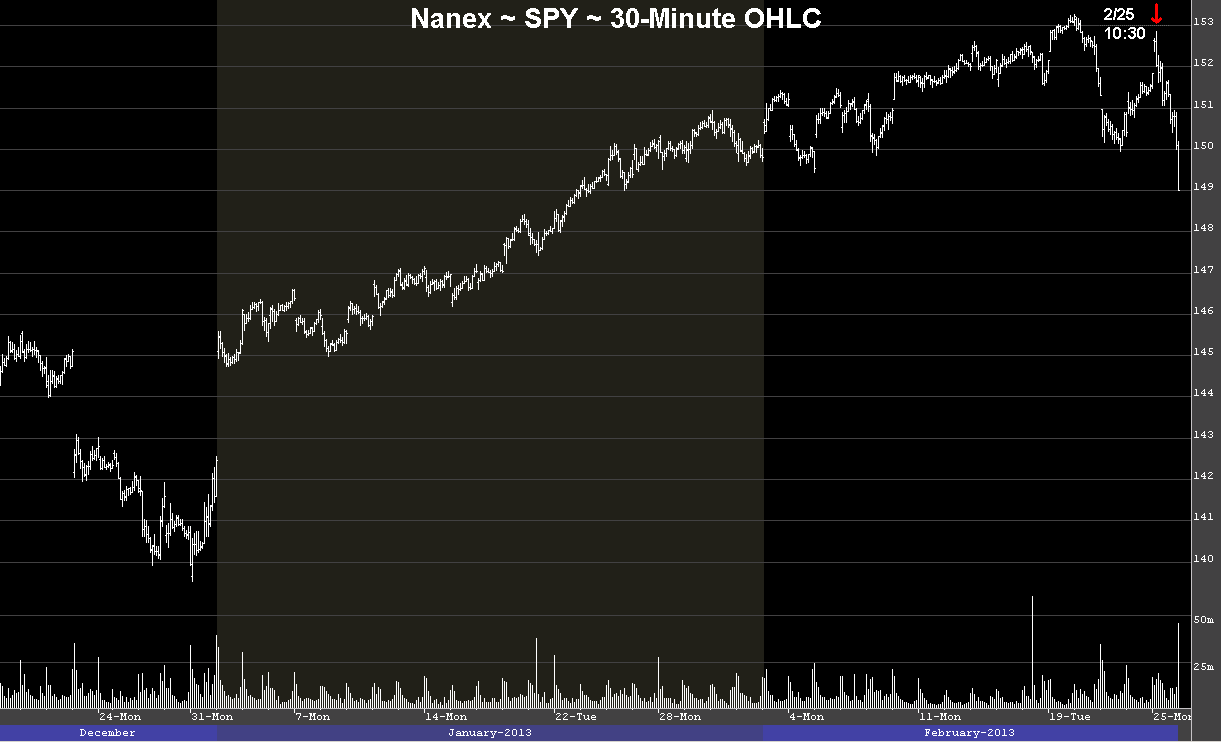
3. SPY 30-Minute OHLC bar chart. Red Arrow indicates when the surge in quotes
began.

Nanex Research
Inquiries: pr@nanex.net


